 🔨 Auction
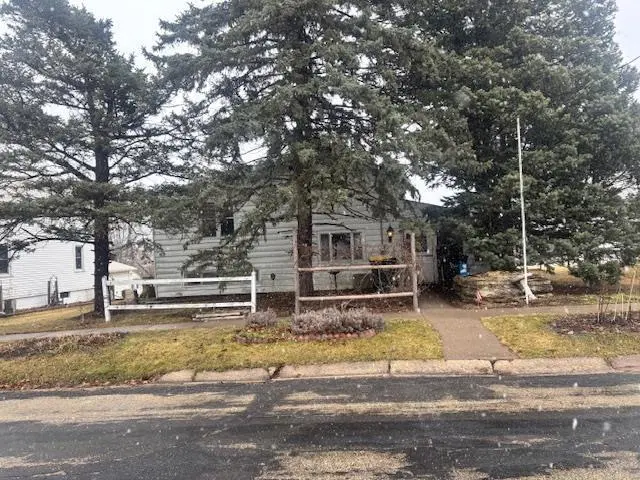
436 S Tyler St · Lancaster, WI
Flood risk 1/10 · Minimal
- FEMA flood zone
- X (unshaded)
- Chance of flooding over 30 yrs
- 0.0%
- Est. flood insurance / yr
- $473 – $860
Fire risk 1/10 · Minimal
- Est. fire insurance / yr
- $636 – $1,182
Heat risk 2/10 · Minimal
- Hot days now (above 99°F)
- 7 days/yr
- Hot days in 30 yrs
- 15 days/yr
Wind risk 2/10 · Minimal
- Chance of severe wind over 30 yrs
- —
Air-quality risk 2/10 · Minimal
- Unhealthy air days now
- 0 days/yr
- Unhealthy air days in 30 yrs
- 1 days/yr
Risk factors via First Street. Map © Google.
Why this score? — see what drove the F grade
The composite is a weighted blend of 9 inputs, each scored 0–100. Each bar is that input's sub-score; the figure is the points it added to the 100-point composite (weight × sub-score).
- ARV discount +7.5/15.0
- Cash flow +4.0/30.0
- Schools +3.7/10.0
- Livability +3.5/5.0
- Rent growth +2.5/5.0
- Condition / age +2.5/5.0
- 1% rule +0.2/10.0
- DSCR +0.0/10.0
- Appreciation +0.0/10.0
$1
🖨 Deal sheet 📄 Offer letter ✓ Due diligence
Listing remarks
Home will be sold at auction! Online auction will end May 29th! Home will sell as-is, where-is.
Key facts
- 7,405 sq ft lot
- 2 garage spots
- Built 1970
Property features AI
Finance
- Other: Items left in home at time of auction may be included; owner’s personal property is excluded
Exterior
- Parking: Detached 2-car garage
- Utilities: Municipal water; Municipal sewer; Electric service (standard)
- Home design: Tri-level single-family home; Finished area includes approximately 894 above-grade and 600 finished below-grade
- Construction: Information on year built from assessor/public records
- Exterior features: Aluminum/steel exterior; Zoned residential; Lot about 0.17 acre
Interior
- Kitchen: Main-level kitchen (approximately 10 x 12)
- Bedrooms: Three upper-level bedrooms (each about 10 x 10); Master bedroom on upper level (approximately 10 x 10)
- Bathrooms: One full bathroom; No en suite/master bathroom
- Heating & cooling: Forced air heating; Oil-fired heat
- Interior features: Partial, partially finished basement; Main-level living room; Lower-level family room
- Laundry & utility: Window A/C unit (portable/window mounted)
Neighborhood map
What this means for you Summary
Snapshot
- This is a 3-bed/1.0-bath single-family listed at $1.
Deal economics
- At list price, monthly cash flow is $-526 ($-6k/yr) — negative.
- The deal already cash-flows at list — no discount required.
- Meets the 1% rule at list price ($968 rent vs $1).
Location & tenants
- Location reads 69/100 on livability (#317 in WI) — a middle-class / working-renter tenant base. Strengths: cost of living A+, housing A+, health & safety A+; Watch: crime F, amenities F, commute F.
- Lancaster Community School District (town): math 47% / reading 39% proficiency, ranked #124 of 342 in WI (top 36%) — families likely to look elsewhere, expect single-tenant / working-renter base with shorter leases.
- Zoned schools: Winskill Elementary (math 62% / reading 47%, grade C, #166 of 1,041 statewide, top 20%, 472 students, 36% FRL); Lancaster High (math 27% / reading 37%, grade F, #184 of 483 statewide, top 41%, 287 students, 34% FRL).
- Market conditions: 16 active listings in the ZIP; 120 units permitted in Grant County in 2024 (0 in 5+ unit buildings).
Forward outlook
- Local home prices are declining (-3.0%/yr); year-one equity from $1k of loan paydown is wiped out by about $6k of value loss. Plan a longer hold.
- Grant County population projected at +10% by 2050 — modest demand growth; plan on rents tracking national, not racing it.
Negotiation context
- It's been on market 42 days — a 3% lower offer ($0) is reasonable based on typical stale-listing flexibility.
Risks & watch-outs
- Watch-outs: property tax is 280125.0% of price.
Questions for the listing agent
- What do current leases actually rent for vs. the listed asking? Can we see a recent rent roll and the last 12 months of T-12 income?
- It's been on market 42 days. Have you received any prior offers? Is the seller open to a 5% concession, seller financing, or rate buy-down credit?
- Built in 1970 — when were the roof, HVAC, electrical panel, plumbing, and water heater last replaced?
- Property tax is high relative to price — has the assessment been appealed recently, and will the sale trigger a re-assessment?
- Is there a deadline driving the sale (1031 exchange, divorce, estate, relocation)? That informs how much negotiation room exists.
- Crime grade is F in this area — have there been break-ins, vandalism, or insurance claims at this property in the last 3 years? What carrier currently insures it and at what premium?
- The area grade is low — what's the realistic commute time and amenity access for the typical tenant pool here? Any planned neighborhood developments (good or bad) we should know about?
- What's the average days-on-market for RENTAL listings here right now (not sales)? A rising rental-DOM trend means longer vacancies and softer asking-rent achievability than the comps imply.
- What's the recent tenant-quality profile in this submarket — average credit score on applications, eviction rate, late-payment / NSF rate, and stable-employment percentage? A property-management company in the area should have these aggregated.
- How much new for-sale + rental construction is in the pipeline within 1–3 miles? Heavy new supply typically softens prices + rents 12–24 months out; constrained supply supports both.
Investment metrics
- 1% rule
- 0.52% ✗
- Cap rate
- 2.91%
- Cash-on-cash
- -12.07%
- DSCR
- 0.46
- GRM
- 16.1
CMA / ARV
- ARV (on-the-fly)
- $186,750
- Comps found
- 12
Show comp detail 12 sales within ~0.75 mi
| Address | Dist | Beds/Ba | Sqft | Sold | Price | $/sf | Match |
|---|---|---|---|---|---|---|---|
| 436 S Tyler St | 0.00mi | 3/1.0 | 1,494 (0%) | 1mo | $50,000 | $33 | 99 |
| 529 S Harrison St | 0.04mi | 3/2.0 | 1,550 (+4%) | 2mo | $215,000 | $139 | 86 |
| 151 S Fillmore St | 0.31mi | 3/1.0 | 1,460 (-2%) | 11mo | $125,000 | $86 | 73 |
| 935 W Cherry St | 0.33mi | 3/1.5 | 1,365 (-9%) | 2mo | $180,000 | $132 | 67 |
| 843 Sycamore St | 0.17mi | 2/1.5 (-1) | 1,350 (-10%) | 5mo | $205,000 | $152 | 65 |
| 856 Pleasant St | 0.20mi | 4/2.0 (+1) | 1,674 (+12%) | 1mo | $210,000 | $125 | 61 |
| 326 N Monroe St | 0.55mi | 3/1.0 | 1,369 (-8%) | 7mo | $130,000 | $95 | 54 |
| 431 N Madison St | 0.60mi | 3/1.0 | 1,344 (-10%) | 3mo | $184,000 | $137 | 53 |
| 213 E Birch St | 0.70mi | 3/1.5 | 1,536 (+3%) | 10mo | $215,000 | $140 | 53 |
| 439 W Linden St | 0.56mi | 3/1.0 | 1,342 (-10%) | 10mo | $145,000 | $108 | 49 |
| 510 N Monroe St | 0.65mi | 3/1.5 | 1,271 (-15%) | 10mo | $152,000 | $120 | 34 |
| 529 N Madison St | 0.65mi | 4/2.0 (+1) | 1,678 (+12%) | 7mo | $200,000 | $119 | 34 |
Match score weights: distance 35% · size 25% · config 20% · recency 20%. Top-matched comps best support the ARV.
Projected returns pro-forma
-3.0% appreciation · 3.0% rent growth · sell at horizon
- IRR
- -38.6%
- Equity multiple
- -0.22×
- Total profit
- $-63,753
- Equity at exit
- $27,845
- IRR
- -58.5%
- Equity multiple
- -0.89×
- Total profit
- $-98,601
- Equity at exit
- $16,147
Cash invested: $52,290 (down + closing). Projections, not guarantees.
Landlord ↔ Tenant lean methodology
- Overall (STATE)
- 73 Landlord-Friendly
- State Wisconsin
- 73 Landlord-Friendly · R+2
- County
- — inherits STATE
- City
- — inherits STATE
ZIP-level market 53813
- Active inventory
- 16
Monthly cashflow live
- Estimated rent
- $968 medium interval (Pro) →
- Mortgage (P&I)
- −$979
- Tax est. 1.5%
- −$233 /mo · $2,801/yr
- Insurance
- −$78
- HOA
- −$0
- Vacancy / Maint / Mgmt
- −$203
- Net cashflow
- $-526
Break-even live
UW: 25.0% down · 7.5% · 30yr · 1.5% tax · 5.0% vac · 8.0% maint · 8.0% mgmt
Financing live
Cash to close
- Down payment
- $46,688
- Closing costs
- $5,602
- Reserves months
- —
- Total cash needed
- —
Loan-product check · same deal, 3 products live
Conventional
25% down · 7.5% · 30yr
- Down + closing
- —
- Monthly P&I
- —
- Monthly cashflow
- —
- DSCR
- —
- Eligible?
- —
Personal DTI + credit; lowest rate.
DSCR
20% down · 8.5% · 30yr
- Down + closing
- —
- Monthly P&I
- —
- Monthly cashflow
- —
- DSCR
- —
- Eligible?
- —
No personal income docs; deal must DSCR.
Hard money
10% down · 12.0% · 12mo
- Down + closing
- —
- Monthly P&I
- —
- Monthly cashflow
- —
- DSCR
- —
- Eligible?
- —
Short-term bridge; refi at stabilization.
Listing history 2 events
-
2026-04-30status Pending
-
2026-03-16$1 Active
ⓘ Source: listings_history table (triggers on properties + properties_extension) + one-shot
backfill from property_details.listing_events for pre-trigger history.
Climate risk First Street
- Flood 1/10 Low FEMA zone X (unshaded) · 0% chance over 30 yrs
- Wildfire 1/10 Low
- Heat 2/10 Low 7 d/yr ≥99°F today · 15 d/yr by 30 yrs out
- Wind 2/10 Low
- Air quality 2/10 Low 0 unhealthy d/yr today · 1 by 30 yrs out
Nearby sold comps map
Loading sold comps map…
Walkable amenities ~0.75 mi
Loading nearby amenities…
Taxation est. · year 1
- Rental income
- $11,613
- − Mortgage interest
- −$10,461
- − Property taxes
- −$2,801
- − Insurance
- −$934
- − Repairs & maintenance
- −$929
- − Management
- −$929
- − Depreciation
- −$5,433
- Taxable loss
- −$9,874
- Est. tax savings @ 24.0%
- +$2,370
- After-tax cash flow
- $-3,943/yr
For passive investors: Depreciation is non-cash, so a rental often shows a tax loss while cash-flowing — sheltering income. Rental losses are passive: they offset passive income freely, and up to $25,000/yr can offset ordinary (W-2) income if you actively participate and your MAGI is under $100k (phasing out to $0 by $150k); unused losses carry forward. On sale, claimed depreciation is recaptured at up to 25%, and gains may owe capital-gains tax (a 1031 exchange can defer both). Figures are a year-1 estimate at your 24.0% rate — not tax advice; consult a CPA.
Schools (NCES district)
- District
- Lancaster Community School District
- NCES district ID
- 5507770
- Math proficiency
- 47% ▲ 4.00%
- Reading proficiency
- 39% ▼ -1.00%
- Median HH income
- $47,439
- Composite
- 36.78/100
- National rank
- #4570
- State rank
- #124 of 342 in WI
Livability — Lancaster
- Score
- 69/100
- State rank
- #317
- US rank
- #8199
Category grades
Schools grade is shown separately in the Schools card above.
Census & demographics
- Census place
- Lancaster, WI
- City population
- 6,139
- Population (ZIP)
- 6,139
Population outlook (Grant County) Hauer SSP2
- Today (2025)
- 53,982 people
- By 2030
- 55,104 · +2.1%
- By 2040
- 57,353 · +6.2%
- By 2050
- 59,315 · +9.9%
- By 2075
- 65,496 · +21.3%
- By 2100
- 66,508 · +23.2%
Race, ethnicity, and origin ACS 2023
- Neighborhood character
- Predominantly White (94%)
- Race & ethnicity
- White 94% Hispanic / Latino 3% Two or more races 2%
- Common ancestry
- Portuguese 3% Lithuanian 2% Iranian 1%
- Foreign-born
- 2% · Canada
- Languages at home
- 93% English-only · German/W. Germanic 5% Spanish 2%
Political lean MEDSL · Grant
- 2024 margin
- R (+18.2) · D 40.2% · R 58.4% · Other 1.3%
- 2008→2024 swing
- -42.0pp toward R · 2008: 23.9pp · 2024: -18.2pp
- All cycles
- 2024: R+18.2 2020: R+12.3 2016: R+9.6 2012: D+13.7 2008: D+23.9
Not yet ingested
- Civics
- —
Market trends
- HPI YoY
- ▼ -131.15%
- Current HPI
- 188.9967
- Rent YoY
- —
- Metro
- —
- State GDP YoY
- ▲ 2.10%
- F500 in state
- 20
Industry mix (Fortune 500 HQ in WI)
| Industry | F500 HQs | Revenue |
|---|---|---|
| Industrial Machinery | 4 | $23B |
|
||
| Industrial Technology | 2 | $36B |
|
||
| Insurance | 1 | $36B |
|
||
| Professional Services | 1 | $19B |
|
||
| Utilities | 1 | $9B |
|
||
| Consumer Goods | 1 | $3B |
|
||
Property tax history
+0.9%/yrLatest (2025): $1,707 · +10.7% YoY. Source: county tax records.
Cash-flow waterfall
monthlySold comps — $/sqft
last 12 mo · ≤1 miLoading sold comps…