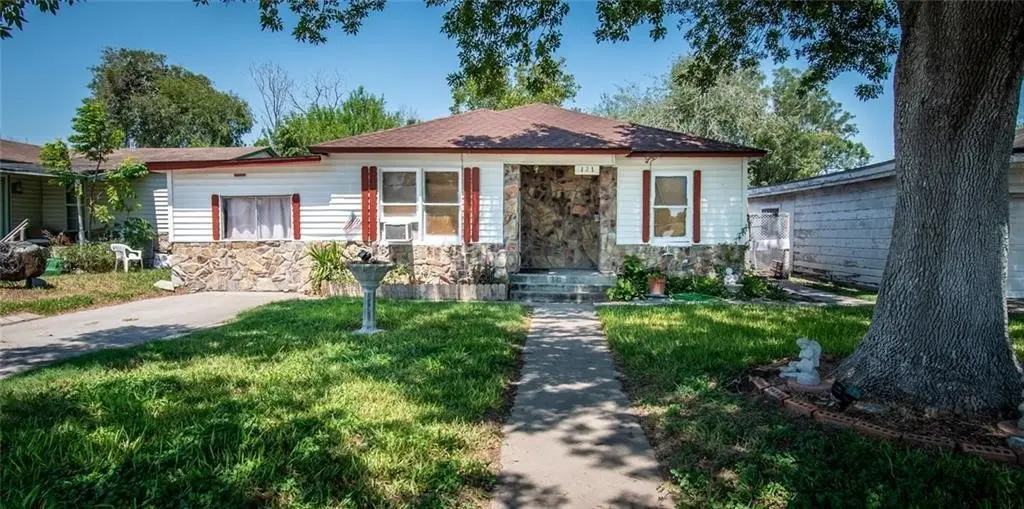
121 W Avenue E · Robstown, TX
Flood risk 8/10 · Major
- FEMA flood zone
- AE
- Chance of flooding over 30 yrs
- 0.99%
- Est. flood insurance / yr
- $1,737 – $8,500
Fire risk 1/10 · Minimal
- Est. fire insurance / yr
- $1,222 – $2,270
Heat risk 9/10 · Severe
- Hot days now (above 110°F)
- 7 days/yr
- Hot days in 30 yrs
- 23 days/yr
Wind risk 9/10 · Severe
- Chance of severe wind over 30 yrs
- 99.0%
Air-quality risk 1/10 · Minimal
- Unhealthy air days now
- 0 days/yr
- Unhealthy air days in 30 yrs
- 0 days/yr
Risk factors via First Street. Map © Google.
Why this score? — see what drove the B+ grade
The composite is a weighted blend of 9 inputs, each scored 0–100. Each bar is that input's sub-score; the figure is the points it added to the 100-point composite (weight × sub-score).
- Cash flow +30.0/30.0
- ARV discount +13.4/15.0
- 1% rule +10.0/10.0
- DSCR +10.0/10.0
- Livability +4.0/5.0
- Rent growth +2.5/5.0
- Condition / age +2.5/5.0
- Appreciation +2.2/10.0
- Schools +1.9/10.0
$93,999
🖨 Deal sheet (PDF) 📄 Offer letter ✓ Due diligence
Listing remarks MLS
One story, 3 bedroom home situated in the heart of Robstown. Beautiful hardwood floors throughout most of the house. Kitchen features vinyl wood look flooring and gas stove. Spacious bedrooms with ceiling fans and cedar closets. Large bathroom with tub/shower combo. Enclosed storage/laundry area. Large fenced in backyard. Roof replaced July 2022. Schedule a private tour today!
Key facts
- Cedar closets
- Ceiling fans
- Gas stove
Tags
Neighborhood map
What this means for you Summary
Snapshot
- This is a 3-bed/1.0-bath single-family listed at $94k.
Deal economics
- At list price, monthly cash flow is $-9 ($-102/yr) — negative.
- To cash-flow at today's rent, offer at most $92k (1.6% below list).
- Meets the 1% rule at list price ($1k rent vs $94k).
- Recommended offer: $83k (12.0% below list) — sets the bar for market timing.
- Cap rate 11.6% vs local median 5.2% in Robstown — top-decile yield for the area; either an underpriced asset or a hidden risk that comps aren't pricing in. Stress-test before assuming the spread holds.
Location & tenants
- Location reads 80/100 on livability (#47 in TX, #1,942 nationally) — a professional / high-income tenant draw. Strengths: commute A+, cost of living A+, housing A+; Watch: schools D-, crime D-, amenities F.
- Robstown ISD (town): math 18% / reading 28% proficiency, ranked #757 of 826 in TX (top 92%) — low school quality limits family demand, transient renter base, plan for 1-2y turnover; 71% free/reduced lunch — lower-income household profile, screen leases tightly.
- Market conditions: 194 active listings in the ZIP; 3 comparable units currently listed for rent nearby; rentals at typical pace (median 23d on market — plan ~3-4 weeks tenant-placement turnaround); 1,397 units permitted in Nueces County in 2024 (47 in 5+ unit buildings).
Forward outlook
- Local home prices are declining (-3.0%/yr); year-one equity from $650 of loan paydown is wiped out by about $3k of value loss. Plan a longer hold.
- Nueces County population projected at +36% by 2050 — long-run rental-demand tailwind backs the buy-and-hold thesis.
Negotiation context
- It's been on market 200 days — a 12% lower offer ($83k) is reasonable based on typical stale-listing flexibility.
- 5 sale attempts since 2y ago with the ask held roughly flat each time — persistent listings suggest the price (not the market) is what's stuck; bring a comps-based counter.
Risks & watch-outs
- Watch-outs: property tax is 2.5% of price; flood insurance adds $427/mo; built in 1955 — expect roof / HVAC / electrical / plumbing capex.
- Climate carrying-cost: in FEMA flood zone AE (mandatory federal flood insurance); severe wind risk, 99% chance of damaging wind over 30y; extreme-heat days projected 7→23/yr by 2055 (HVAC capex compounding) — expect insurance premiums to compound above CPI over the hold.
Questions for the listing agent
- What do current leases actually rent for vs. the listed asking? Can we see a recent rent roll and the last 12 months of T-12 income?
- It's been on market 200 days. Have you received any prior offers? Is the seller open to a 12% concession, seller financing, or rate buy-down credit?
- Built in 1955 — when were the roof, HVAC, electrical panel, plumbing, and water heater last replaced?
- Property tax is high relative to price — has the assessment been appealed recently, and will the sale trigger a re-assessment?
- What's the actual annual flood-insurance premium (NFIP or private), and is the property in a SFHA with mandatory coverage?
- Why hasn't it sold? Are there any deal-killer items the seller is aware of (foundation, flood, title, zoning, code violations)?
- Is there a deadline driving the sale (1031 exchange, divorce, estate, relocation)? That informs how much negotiation room exists.
- Schools are D-rated, which usually means shorter tenancies and higher turnover. Who's the typical renter profile here, and what's been the actual vacancy rate?
- Crime grade is D in this area — have there been break-ins, vandalism, or insurance claims at this property in the last 3 years? What carrier currently insures it and at what premium?
- What's the average days-on-market for RENTAL listings here right now (not sales)? A rising rental-DOM trend means longer vacancies and softer asking-rent achievability than the comps imply.
- What's the recent tenant-quality profile in this submarket — average credit score on applications, eviction rate, late-payment / NSF rate, and stable-employment percentage? A property-management company in the area should have these aggregated.
- How much new for-sale + rental construction is in the pipeline within 1–3 miles? Heavy new supply typically softens prices + rents 12–24 months out; constrained supply supports both.
Investment metrics
- 1% rule
- 1.55% ✓
- Cap rate
- 11.63%
- Cash-on-cash
- 19.06%
- DSCR
- 1.85
- GRM
- 5.4
CMA / ARV
- ARV (median comp)
- $108,094
- List price
- $93,999
- Delta
- -13.04%
- Verdict
- UNDERPRICED
- Comps
- 20 within 1.0 mi
Show comp detail 6 sales within ~0.75 mi
| Address | Dist | Beds/Ba | Sqft | Sold | Price | $/sf | Match |
|---|---|---|---|---|---|---|---|
| 107 W Avenue E | 0.07mi | 3/1.0 | 1,314 (-1%) | 13mo | $159,900 | $122 | 84 |
| 483 Cenizo St | 0.37mi | 3/2.0 | 1,301 (-2%) | 14mo | $175,000 | $135 | 63 |
| 203 N First St | 0.23mi | 2/1.0 (-1) | 1,201 (-10%) | 7mo | $39,900 | $33 | 62 |
| 209 E Avenue F Ave | 0.26mi | 3/2.0 | 1,170 (-12%) | 8mo | $145,000 | $124 | 57 |
| 416 & 420 E Avenue F | 0.45mi | 4/2.0 (+1) | 1,500 (+13%) | 5mo | $199,000 | $133 | 45 |
| 616 E Avenue G | 0.64mi | 3/2.0 | 1,196 (-10%) | 24mo | $74,900 | $63 | 29 |
Match score weights: distance 35% · size 25% · config 20% · recency 20%. Top-matched comps best support the ARV.
Projected returns pro-forma
-3.0% appreciation · 3.0% rent growth · sell at horizon
- IRR
- -16.5%
- Equity multiple
- 0.41×
- Total profit
- $-15,443
- Equity at exit
- $14,016
- IRR
- -7.6%
- Equity multiple
- 0.51×
- Total profit
- $-12,794
- Equity at exit
- $8,127
Cash invested: $26,320 (down + closing). Projections, not guarantees.
Landlord ↔ Tenant lean methodology
- Overall (STATE)
- 87 Strongly Landlord-Friendly
- State Texas
- 87 Strongly Landlord-Friendly · R+5
- County
- — inherits STATE
- City
- — inherits STATE
ZIP-level market 78380
- Home prices YoY
- -1.9%
- Active inventory
- 194
- Price-to-rent
- 5.4×
Monthly cashflow live
- Estimated rent
- $1,452 medium interval (Pro) →
- Mortgage (P&I)
- −$493
- Tax from tax record
- −$197 /mo · $2,368/yr
- Insurance
- −$39
- Flood insurance flood zone
- −$427 /mo · $5,118/yr
- HOA
- −$0
- Vacancy / Maint / Mgmt
- −$305
- Net cashflow
- $-9
Break-even live
Sensitivity live
| Price | -10% $45 | -5% $18 | +0% $-9 | +5% $-35 | +10% $-62 |
|---|---|---|---|---|---|
| Rent | -10% $-123 | -5% $-66 | +0% $-9 | +5% $49 | +10% $106 |
| Rate | -1.0pp $39 | -0.5pp $15 | base $-9 | +0.5pp $-33 | +1.0pp $-58 |
UW: 25.0% down · 7.5% · 30yr · 1.5% tax · 5.0% vac · 8.0% maint · 8.0% mgmt
Financing live
Cash to close
- Down payment
- $23,500
- Closing costs
- $2,820
- Reserves months
- —
- Total cash needed
- —
Loan-product check · same deal, 3 products live
Conventional
25% down · 7.5% · 30yr
- Down + closing
- —
- Monthly P&I
- —
- Monthly cashflow
- —
- DSCR
- —
- Eligible?
- —
Personal DTI + credit; lowest rate.
DSCR
20% down · 8.5% · 30yr
- Down + closing
- —
- Monthly P&I
- —
- Monthly cashflow
- —
- DSCR
- —
- Eligible?
- —
No personal income docs; deal must DSCR.
Hard money
10% down · 12.0% · 12mo
- Down + closing
- —
- Monthly P&I
- —
- Monthly cashflow
- —
- DSCR
- —
- Eligible?
- —
Short-term bridge; refi at stabilization.
Rent comps 3 comps
| Address | Beds | Baths | Sqft | Rent | $/sqft | DOM | Units | Dist |
|---|---|---|---|---|---|---|---|---|
| 228 East Avenue G Unit G Robstown, TX | 3.0 | 2.0 | 1222 | $1,700 | $1.39 | 22d | 1 | 0.34mi |
| 611 Lopez St Robstown, TX | 3.0 | 1.0 | 886 | $1,000 | $1.13 | 45d | 1 | 0.44mi |
| 630 Wright St Robstown, TX | 1.0–3.0 | 1.0–2.0 | 936 | $1,479 | $1.58 | 15d | 8 | 0.95mi |
Listing history 27 events
-
2026-06-21days on market $93,999 Active 200 DOM
-
2026-06-21days on market $93,999 Active 199 DOM
-
2026-06-18days on market $93,999 Active 197 DOM
-
2026-06-17days on market $93,999 Active 196 DOM
-
2026-06-16days on market $93,999 Active 195 DOM
-
2026-06-15days on market $93,999 Active 194 DOM
-
2026-06-15days on market $93,999 Active 193 DOM
-
2026-06-13days on market $93,999 Active 192 DOM
-
2026-06-09days on market $93,999 Active 188 DOM
-
2026-06-08days on market $93,999 Active 187 DOM
-
2026-06-08days on market $93,999 Active 186 DOM
-
2026-06-07days on market $93,999 Active 185 DOM
-
2026-06-03days on market $93,999 Active 182 DOM
-
2026-06-02days on market $93,999 Active 181 DOM
-
2026-06-01days on market $93,999 Active 180 DOM
-
2026-05-31days on market $93,999 Active 179 DOM
-
2026-01-01historical $1,200
-
2025-12-03$93,999 Active 379-char remark
Show marketing remark (379 chars)
One story, 3 bedroom home situated in the heart of Robstown. Beautiful hardwood floors throughout most of the house. Kitchen features vinyl wood look flooring and gas stove. Spacious bedrooms with ceiling fans and cedar closets. Large bathroom with tub/shower combo. Enclosed storage/laundry area. Large fenced in backyard. Roof replaced July 2022. Schedule a private tour today!
-
2025-09-11$1,200
-
2025-04-27status Active
-
2025-04-27status Pending
-
2025-04-21historical Active Under Contract
-
2025-04-14historical $1,200
-
2025-03-26$1,200
-
2024-11-11price $94,999
-
2024-09-20$98,000 Active
-
2011-06-24soldstatus
ⓘ Source: listings_history table (triggers on properties + properties_extension) + one-shot
backfill from property_details.listing_events for pre-trigger history.
Tax reassessment forecast TX · Resets to sale price
- Current annual tax
- $2,368 · $197/mo
- Projected year-2 tax
- $2,368 · $197/mo
- Expected delta
- $0/yr ($0/mo · 0.0%)
ⓘ Screening estimate from a state-policy table — verify with the county assessor before closing.
Climate risk First Street
- Flood 8/10 Severe FEMA zone AE · 99% chance over 30 yrs
- Wildfire 1/10 Low
- Heat 9/10 Extreme 7 d/yr ≥110°F today · 23 d/yr by 30 yrs out
- Wind 9/10 Extreme 99% chance of damaging wind over 30 yrs
- Air quality 1/10 Low 0 unhealthy d/yr today · 0 by 30 yrs out
Nearby sold comps map
Loading sold comps map…
Walkable amenities ~0.75 mi
Loading nearby amenities…
Taxation est. · year 1
- Rental income
- $17,429
- − Mortgage interest
- −$5,265
- − Property taxes
- −$2,368
- − Insurance
- −$5,588
- − Repairs & maintenance
- −$1,394
- − Management
- −$1,394
- − Depreciation
- −$2,735
- Taxable loss
- −$1,316
- Est. tax savings @ 24.0%
- +$316
- After-tax cash flow
- $213/yr
For passive investors: Depreciation is non-cash, so a rental often shows a tax loss while cash-flowing — sheltering income. Rental losses are passive: they offset passive income freely, and up to $25,000/yr can offset ordinary (W-2) income if you actively participate and your MAGI is under $100k (phasing out to $0 by $150k); unused losses carry forward. On sale, claimed depreciation is recaptured at up to 25%, and gains may owe capital-gains tax (a 1031 exchange can defer both). Figures are a year-1 estimate at your 24.0% rate — not tax advice; consult a CPA.
Schools (NCES district)
- District
- Robstown ISD
- NCES district ID
- 4837440
- Math proficiency
- 18% ▼ -21.00%
- Reading proficiency
- 28% ▼ -5.00%
- Median HH income
- $33,362
- Composite
- 18.77/100
- National rank
- #8875
- State rank
- #757 of 826 in TX
Livability — Robstown
- Score
- 80/100
- State rank
- #47
- US rank
- #1942
Category grades
Schools grade is shown separately in the Schools card above.
Census & demographics
- Census place
- Robstown, TX
- Population (ZIP)
- 23,752
Population outlook (Nueces County) Hauer SSP2
- Today (2025)
- 418,037 people
- By 2030
- 447,123 · +7.0%
- By 2040
- 505,911 · +21.0%
- By 2050
- 567,522 · +35.8%
- By 2075
- 729,686 · +74.6%
- By 2100
- 847,087 · +102.6%
Race, ethnicity, and origin ACS 2023
- Neighborhood character
- Predominantly Hispanic (76%)
- Race & ethnicity
- Hispanic / Latino 76% Two or more races 38% White 23%
- Hispanic origin (detail)
- Mexican 71%
- Foreign-born
- 5% · Canada, Vietnam
- Languages at home
- 52% English-only · Spanish 47%
Political lean MEDSL · Nueces
- 2024 margin
- R (+11.5) · D 43.8% · R 55.3%
- 2008→2024 swing
- -7.1pp toward R · 2008: -4.4pp · 2024: -11.5pp
- All cycles
- 2024: R+11.5 2020: R+2.9 2016: R+1.5 2012: R+3.2 2008: R+4.4
Not yet ingested
- Civics
- —
Market trends
- HPI YoY
- ▼ -5.51%
- Current HPI
- 286.19
- Rent YoY
- —
- Metro
- —
- State GDP YoY
- ▲ 3.95%
- F500 in state
- 110
Industry mix (Fortune 500 HQ in TX)
| Industry | F500 HQs | Revenue |
|---|---|---|
| Energy | 16 | $1,198B |
|
||
| Technology | 5 | $198B |
|
||
| Engineering / Construction | 4 | $72B |
|
||
| Energy Services | 3 | $60B |
|
||
| Utilities | 3 | $41B |
|
||
| Healthcare | 2 | $330B |
|
||
Price history
-98.8% since first listed11 events — show timeline
- 2026-01-01 Rental Removed $1,200 CBMLS
- 2025-12-03 Listed $93,999 CBMLS
- 2025-09-11 Listed for Rent $1,200 CBMLS
- 2025-04-27 Relisted — CBMLS
- 2025-04-27 Pending — CBMLS
- 2025-04-21 Contingent — CBMLS
- 2025-04-14 Rental Removed $1,200 CBMLS
- 2025-03-26 Listed for Rent $1,200 CBMLS
- 2024-11-11 Price Changed $94,999 CBMLS
- 2024-09-20 Listed $98,000 CBMLS
- 2011-06-24 Sold (Public Records) — Public Records
Property tax history
+3.6%/yrLatest (2025): $2,368 · -1.1% YoY. Source: county tax records.
Cash-flow waterfall
monthlySold comps — $/sqft
last 12 mo · ≤1 miLoading sold comps…