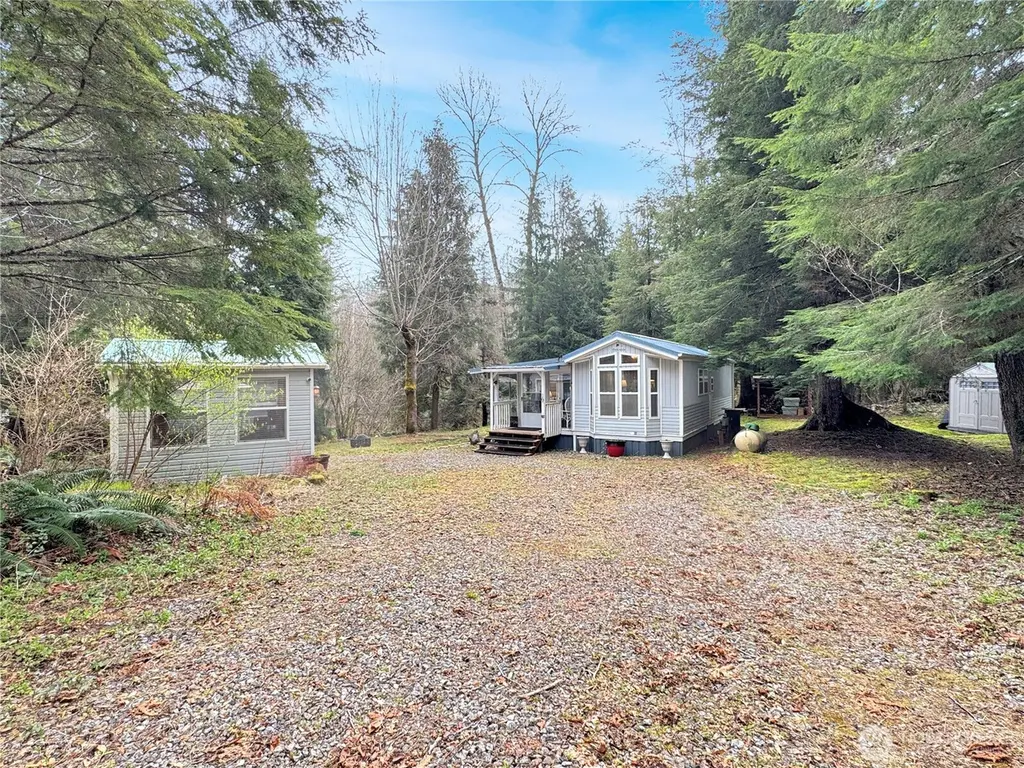
19 7 Big Tree Dr · Maple Falls, WA
Flood risk 1/10 · Minimal
- FEMA flood zone
- X (unshaded)
- Chance of flooding over 30 yrs
- 0.0%
- Est. flood insurance / yr
- $507 – $1,088
Fire risk 4/10 · Minor
- Est. fire insurance / yr
- $604 – $1,122
Heat risk 1/10 · Minimal
- Hot days now (above 84°F)
- 7 days/yr
- Hot days in 30 yrs
- 15 days/yr
Wind risk 1/10 · Minimal
- Chance of severe wind over 30 yrs
- —
Air-quality risk 7/10 · Major
- Unhealthy air days now
- 13 days/yr
- Unhealthy air days in 30 yrs
- 14 days/yr
Risk factors via First Street. Map © Google.
Why this score? — see what drove the C+ grade
The composite is a weighted blend of 9 inputs, each scored 0–100. Each bar is that input's sub-score; the figure is the points it added to the 100-point composite (weight × sub-score).
- Cash flow +30.0/30.0
- 1% rule +10.0/10.0
- DSCR +10.0/10.0
- Schools +4.2/10.0
- Livability +2.8/5.0
- Rent growth +2.5/5.0
- Condition / age +2.5/5.0
- ARV discount +0.0/15.0
- Appreciation +0.0/10.0
$118,000
🖨 Deal sheet (PDF) 📄 Offer letter ✓ Due diligence
Listing remarks
Rare one-acre lot in Division 7 at The Glen! This fully furnished park model offers an open floor plan with a spacious living area, full bathroom, and full-size appliances. A large sunroom and additional living space expand the footprint, creating flexibility for both relaxing and hosting. The covered porch with a wall of windows brings in natural light and allows you to enjoy the surrounding setting year-round. The home is currently configured to comfortably sleep up to ten. Outside, the property truly stands apart. A main shed with its own deck and dedicated dining area creates an ideal space for outdoor entertaining, while a second storage shed and woodshed provide excellent utility. A l
Key facts
- 1.09 acre lot
- Community pool
- Built 1994
Neighborhood map
What this means for you Summary
Snapshot
- This is a 1-bed/1.0-bath single-family listed at $118k.
Deal economics
- At list price, monthly cash flow is $477 ($6k/yr) — positive.
- The deal already cash-flows at list — no discount required.
- Meets the 1% rule at list price ($2k rent vs $118k).
- Recommended offer: $111k (6.0% below list) — sets the bar for market timing.
Location & tenants
- Location reads 56/100 on livability (#544 in WA) — a working-class tenant base; expect higher turnover. Watch: health & safety D, amenities F, commute F.
- Mount Baker School District (rural): math 40% / reading 53% proficiency, ranked #165 of 291 in WA (top 57%) — families likely to look elsewhere, expect single-tenant / working-renter base with shorter leases.
- Market conditions: 143 active listings in the ZIP; 1,190 units permitted in Whatcom County in 2024 (327 in 5+ unit buildings).
Forward outlook
- Local home prices are declining (-3.0%/yr); year-one equity from $816 of loan paydown is wiped out by about $4k of value loss. Plan a longer hold.
- Whatcom County population projected at +28% by 2050 — long-run rental-demand tailwind backs the buy-and-hold thesis.
- At projected returns (-3.0% appreciation + 3.0% rent growth), your $33k cash investment doubles in ~7 years — after that, you're playing with house money.
Negotiation context
- It's been on market 69 days — a 6% lower offer ($111k) is reasonable based on typical stale-listing flexibility.
- 2 sale attempts since 8y ago with the ask held roughly flat each time — persistent listings suggest the price (not the market) is what's stuck; bring a comps-based counter.
Questions for the listing agent
- It's been on market 69 days. Have you received any prior offers? Is the seller open to a 6% concession, seller financing, or rate buy-down credit?
- What does the HOA fee cover, when was the last increase, and are there any pending special assessments or reserve-fund shortfalls?
- Why hasn't it sold? Are there any deal-killer items the seller is aware of (foundation, flood, title, zoning, code violations)?
- Is there a deadline driving the sale (1031 exchange, divorce, estate, relocation)? That informs how much negotiation room exists.
- What's the average days-on-market for RENTAL listings here right now (not sales)? A rising rental-DOM trend means longer vacancies and softer asking-rent achievability than the comps imply.
- What's the recent tenant-quality profile in this submarket — average credit score on applications, eviction rate, late-payment / NSF rate, and stable-employment percentage? A property-management company in the area should have these aggregated.
- How much new for-sale + rental construction is in the pipeline within 1–3 miles? Heavy new supply typically softens prices + rents 12–24 months out; constrained supply supports both.
Investment metrics
- 1% rule
- 1.58% ✓
- Cap rate
- 11.14%
- Cash-on-cash
- 17.31%
- DSCR
- 1.77
- GRM
- 5.3
CMA / ARV
- ARV (median comp)
- $84,919
- List price
- $118,000
- Delta
- 38.96%
- Verdict
- OVERPRICED
- Comps
- 10 within 1.0 mi
Projected returns pro-forma
-3.0% appreciation · 3.0% rent growth · sell at horizon
- IRR
- 8.8%
- Equity multiple
- 1.34×
- Total profit
- $11,377
- Equity at exit
- $17,594
- IRR
- 18.0%
- Equity multiple
- 2.50×
- Total profit
- $49,564
- Equity at exit
- $10,202
Cash invested: $33,040 (down + closing). Projections, not guarantees.
Landlord ↔ Tenant lean methodology
- Overall (STATE)
- 28 Tenant-Leaning
- State Washington
- 28 Tenant-Leaning · D+8
- County
- — inherits STATE
- City
- — inherits STATE
ZIP-level market 98244
- Home prices YoY
- -15.7%
- Active inventory
- 143
- Price-to-rent
- 5.3×
Monthly cashflow live
- Estimated rent
- $1,865 medium interval (Pro) →
- Mortgage (P&I)
- −$619
- Tax est. 1.5%
- −$148 /mo · $1,770/yr
- Insurance
- −$49
- HOA
- −$181
- Vacancy / Maint / Mgmt
- −$392
- Net cashflow
- $477
Break-even live
Sensitivity live
| Price | -10% $558 | -5% $517 | +0% $477 | +5% $436 | +10% $395 |
|---|---|---|---|---|---|
| Rent | -10% $329 | -5% $403 | +0% $477 | +5% $550 | +10% $624 |
| Rate | -1.0pp $536 | -0.5pp $507 | base $477 | +0.5pp $446 | +1.0pp $415 |
UW: 25.0% down · 7.5% · 30yr · 1.5% tax · 5.0% vac · 8.0% maint · 8.0% mgmt
Financing live
Cash to close
- Down payment
- $29,500
- Closing costs
- $3,540
- Reserves months
- —
- Total cash needed
- —
Loan-product check · same deal, 3 products live
Conventional
25% down · 7.5% · 30yr
- Down + closing
- —
- Monthly P&I
- —
- Monthly cashflow
- —
- DSCR
- —
- Eligible?
- —
Personal DTI + credit; lowest rate.
DSCR
20% down · 8.5% · 30yr
- Down + closing
- —
- Monthly P&I
- —
- Monthly cashflow
- —
- DSCR
- —
- Eligible?
- —
No personal income docs; deal must DSCR.
Hard money
10% down · 12.0% · 12mo
- Down + closing
- —
- Monthly P&I
- —
- Monthly cashflow
- —
- DSCR
- —
- Eligible?
- —
Short-term bridge; refi at stabilization.
HOA detail
- Monthly dues
- $181 · $2,172/yr
Listing history 20 events
-
2026-06-18days on market $118,000 Active 69 DOM
-
2026-06-17days on market $118,000 Active 68 DOM
-
2026-06-16days on market $118,000 Active 67 DOM
-
2026-06-15days on market $118,000 Active 66 DOM
-
2026-06-14days on market $118,000 Active 64 DOM
-
2026-06-13days on market $118,000 Active 63 DOM
-
2026-06-10days on market $118,000 Active 61 DOM
-
2026-06-09days on market $118,000 Active 60 DOM
-
2026-06-08days on market $118,000 Active 59 DOM
-
2026-06-07days on market $118,000 Active 58 DOM
-
2026-06-05days on market $118,000 Active 55 DOM
-
2026-06-02days on market $118,000 Active 53 DOM
-
2026-06-01days on market $118,000 Active 52 DOM
-
2026-05-31days on market $118,000 Active 51 DOM
-
2026-05-30days on market $118,000 Active 50 DOM
-
2026-04-10$118,000 Active
-
2019-02-15soldstatus $105,000 Sold
-
2019-02-01status Pending Inspection
-
2019-01-29price $115,000
-
2018-08-31$119,900 Active
ⓘ Source: listings_history table (triggers on properties + properties_extension) + one-shot
backfill from property_details.listing_events for pre-trigger history.
Climate risk First Street
- Flood 1/10 Low FEMA zone X (unshaded) · 0% chance over 30 yrs
- Wildfire 4/10 Moderate
- Heat 1/10 Low 7 d/yr ≥84°F today · 15 d/yr by 30 yrs out
- Wind 1/10 Low
- Air quality 7/10 Severe 13 unhealthy d/yr today · 14 by 30 yrs out
Nearby sold comps map
Loading sold comps map…
Walkable amenities ~0.75 mi
Loading nearby amenities…
Taxation est. · year 1
- Rental income
- $22,377
- − Mortgage interest
- −$6,610
- − Property taxes
- −$1,770
- − Insurance
- −$590
- − Repairs & maintenance
- −$1,790
- − Management
- −$1,790
- − HOA
- −$2,172
- − Depreciation
- −$3,433
- Taxable income
- $4,222
- Est. tax owed @ 24.0%
- −$1,013
- After-tax cash flow
- $4,707/yr
For passive investors: Depreciation is non-cash, so a rental often shows a tax loss while cash-flowing — sheltering income. Rental losses are passive: they offset passive income freely, and up to $25,000/yr can offset ordinary (W-2) income if you actively participate and your MAGI is under $100k (phasing out to $0 by $150k); unused losses carry forward. On sale, claimed depreciation is recaptured at up to 25%, and gains may owe capital-gains tax (a 1031 exchange can defer both). Figures are a year-1 estimate at your 24.0% rate — not tax advice; consult a CPA.
Schools (NCES district)
- District
- Mount Baker School District
- NCES district ID
- 5305310
- Math proficiency
- 40% ▲ 3.00%
- Reading proficiency
- 53% ▼ -1.00%
- Median HH income
- $53,695
- Composite
- 42.37/100
- National rank
- #6931
- State rank
- #165 of 291 in WA
Livability — Maple Falls
- Score
- 56/100
- State rank
- #544
- US rank
- #22984
Category grades
Schools grade is shown separately in the Schools card above.
Census & demographics
- Census place
- Maple Falls, WA
- Population (ZIP)
- 3,080
Population outlook (Whatcom County) Hauer SSP2
- Today (2025)
- 240,408 people
- By 2030
- 254,667 · +5.9%
- By 2040
- 281,365 · +17.0%
- By 2050
- 307,592 · +27.9%
- By 2075
- 375,576 · +56.2%
- By 2100
- 421,637 · +75.4%
Race, ethnicity, and origin ACS 2023
- Neighborhood character
- Predominantly White (80%)
- Race & ethnicity
- White 80% Native American 9% Two or more races 9% Asian 1%
- Common ancestry
- Slovak 6% Lithuanian 3% Serbian 3%
- Foreign-born
- 6% · Canada
- Languages at home
- 93% English-only · German/W. Germanic 2% Other Asian/Pacific 2% Korean 1%
Political lean MEDSL · Whatcom
- 2024 margin
- Strong D (+24.9) · D 60.8% · R 35.9% · Other 3.3%
- 2008→2024 swing
- +6.9pp toward D · 2008: 18.0pp · 2024: 24.9pp
- All cycles
- 2024: D+24.9 2020: D+23.9 2016: D+17.7 2012: D+12.1 2008: D+18.0
Not yet ingested
- Civics
- —
Market trends
- HPI YoY
- ▼ -78.13%
- Current HPI
- 420.4673
- Rent YoY
- —
- Metro
- —
- State GDP YoY
- ▲ 4.65%
- F500 in state
- 22
Industry mix (Fortune 500 HQ in WA)
| Industry | F500 HQs | Revenue |
|---|---|---|
| Retail | 2 | $269B |
|
||
| Technology / Retail | 1 | $638B |
|
||
| Technology | 1 | $245B |
|
||
| Telecommunications | 1 | $38B |
|
||
| Food / Beverage | 1 | $36B |
|
||
| Automotive / Trucks | 1 | $34B |
|
||
Price history
-1.6% since first listed5 events — show timeline
- 2026-04-10 Listed $118,000 NWMLS as Distributed by MLS Grid
- 2019-02-15 Sold (MLS) $105,000 NWMLS as Distributed by MLS Grid
- 2019-02-01 Pending — NWMLS as Distributed by MLS Grid
- 2019-01-29 Price Changed $115,000 NWMLS as Distributed by MLS Grid
- 2018-08-31 Listed $119,900 NWMLS as Distributed by MLS Grid
Cash-flow waterfall
monthlySold comps — $/sqft
last 12 mo · ≤1 miLoading sold comps…