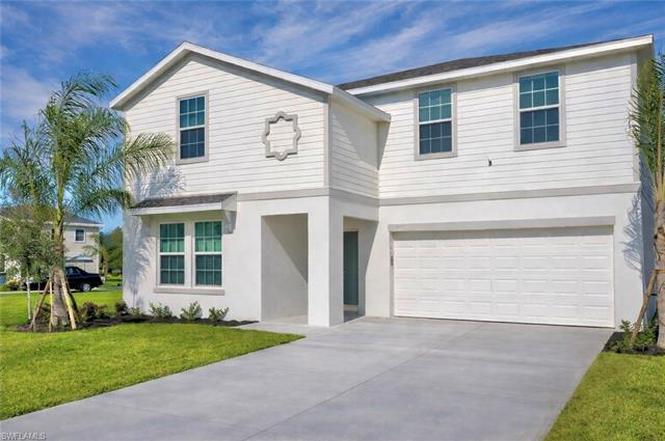
12075 Savanna Lakes Blvd · Lehigh Acres, FL
Flood risk 4/10 · Minor
- FEMA flood zone
- X (unshaded)
- Chance of flooding over 30 yrs
- 0.22%
- Est. flood insurance / yr
- $507 – $1,088
Fire risk 5/10 · Moderate
- Est. fire insurance / yr
- $947 – $1,759
Heat risk 9/10 · Severe
- Hot days now (above 108°F)
- 7 days/yr
- Hot days in 30 yrs
- 27 days/yr
Wind risk 10/10 · Severe
- Chance of severe wind over 30 yrs
- 99.0%
Air-quality risk 2/10 · Minimal
- Unhealthy air days now
- 1 days/yr
- Unhealthy air days in 30 yrs
- 2 days/yr
Risk factors via First Street. Map © Google.
Why this score? — see what drove the D- grade
The composite is a weighted blend of 9 inputs, each scored 0–100. Each bar is that input's sub-score; the figure is the points it added to the 100-point composite (weight × sub-score).
- Appreciation +10.0/10.0
- Cash flow +7.2/30.0
- ARV discount +5.9/15.0
- Schools +4.1/10.0
- Livability +3.0/5.0
- Condition / age +2.5/5.0
- 1% rule +1.9/10.0
- DSCR +1.4/10.0
- Rent growth +1.3/5.0
$424,900
🖨 Deal sheet (PDF) 📄 Offer letter ✓ Due diligence
Listing remarks MLS
The 3,326-square-foot Trenton is the perfect home to grow into. The first floor features an open plan kitchen, family room, and casual dining area. A breezy owner’s suite offers walk-in closet, dual sinks, and a tub shower. Also on the first floor is a flex space which makes for an ideal home office, and the second bedroom and full bath. Upstairs, a spacious loft offers more flexible living space, and four additional bedrooms that make use of a third full bath. Ideal for entertaining out-of-town guests, the Trenton is complete with back patio and 2-car garage. Renderings are used for display purposes only. Estimated delivery Aug/Sept 2023.
Key facts
- Corner double lot
- Massive loft
- City water
Tags
Property features AI
Finance
- Other: Zoning: MPD; Lot unit: 22; Total area: 3,869 (source: survey); Restrictions: Deeded; View: see remarks; Possession at closing
- HOA & community: Mandatory HOA; Gated community; On-site management; HOA maintains cable, irrigation water, and security; Community amenities include pool, exercise room, internet access, and play area
Exterior
- Parking: Attached 2-car garage; Attached 4-space carport
- Security: Community security (HOA maintenance); On-site management; Security system
- Utilities: Central water (assessment paid); Sewer assessment paid; Cable available; Electric power (central)
- Home design: Single-family residence; Two-story design; Built in 2023; Property type: Residential; Development: Savanna Lakes
- Construction: Concrete block construction; Shingle roof; Stucco finish; Built in 2023
- Exterior features: Stucco exterior; Impact-resistant windows; Impact-resistant storm protection; Shingle roof; Corner lot; Oversize lot; Rear exposure facing east; Surveyed lot
Interior
- Kitchen: Cooktop (electric); Range; Microwave; Dishwasher; Refrigerator/freezer; Freezer
- Bedrooms: 6+ bedrooms; First-floor bedroom; Ground-level master bedroom
- Flooring: Carpet; Tile
- Bathrooms: 3 full bathrooms; Master bath with dual sinks and shower (no tub)
- Heating & cooling: Central electric heat; Central electric air conditioning; Ceiling fans; Cooling notes: see remarks
- Interior features: Built-in cabinets; High-speed internet available; Open porch/lanai; Den / study; Breakfast bar; Family dining area; Security system; Unfurnished; Five ceiling fans
- Laundry & utility: Washer; Dryer
Neighborhood map
What this means for you Summary
Snapshot
- This is a 5-bed/3.0-bath single-family listed at $425k.
Deal economics
- At list price, monthly cash flow is $-587 ($-7k/yr) — negative.
- To cash-flow at today's rent, offer at most $321k (24.4% below list).
- To meet the 1% rule (rent ≥ 1% of price), the offer needs to be $293k (30.9% below list).
- Recommended offer: $293k (30.9% below list) — sets the bar for 1% rule.
Location & tenants
- Location reads 59/100 on livability (#826 in FL) — a working-class tenant base; expect higher turnover. Strengths: cost of living A+, housing A+; Watch: crime C-, employment D+, schools D-.
- Lee (suburban): math 47% / reading 50% proficiency, ranked #42 of 73 in FL (top 58%) — families likely to look elsewhere, expect single-tenant / working-renter base with shorter leases.
- Market conditions: Rents falling (-4.7%/yr); 2460 active listings in the ZIP; 7 comparable units currently listed for rent nearby; rentals at typical pace (median 22d on market — plan ~3-4 weeks tenant-placement turnaround); 15,411 units permitted in Lee County in 2024 (4,686 in 5+ unit buildings).
- At $2,935/mo this rent would consume 49% of the median local household income ($72k/yr) (locally 434% of renters already pay >50% of income on rent) — very limited rent-growth headroom before tenants either downsize or default.
Forward outlook
- In year one you build about $45k of equity ($3k loan paydown + $42k appreciation (10.0% local appreciation)).
- Lee County population projected at +44% by 2050 — long-run rental-demand tailwind backs the buy-and-hold thesis.
- By year 2, paydown + projected appreciation supports a ~$73k cash-out refi (75% LTV) — recoverable capital for the next deal without selling this one.
Negotiation context
- It's been on market 121 days — a 12% lower offer ($374k) is reasonable based on typical stale-listing flexibility.
- 2 sale attempts since 3y ago; this cycle's ask has dropped $40k (9%) from the opening price — seller is motivated, your offer sets the floor, not the list.
Risks & watch-outs
- Climate carrying-cost: severe wind risk, 99% chance of damaging wind over 30y; moderate wildfire risk; extreme-heat days projected 7→27/yr by 2055 (HVAC capex compounding) — expect insurance premiums to compound above CPI over the hold.
Questions for the listing agent
- What do current leases actually rent for vs. the listed asking? Can we see a recent rent roll and the last 12 months of T-12 income?
- It's been on market 121 days. Have you received any prior offers? Is the seller open to a 31% concession, seller financing, or rate buy-down credit?
- Why hasn't it sold? Are there any deal-killer items the seller is aware of (foundation, flood, title, zoning, code violations)?
- Is there a deadline driving the sale (1031 exchange, divorce, estate, relocation)? That informs how much negotiation room exists.
- Schools are D-rated, which usually means shorter tenancies and higher turnover. Who's the typical renter profile here, and what's been the actual vacancy rate?
- The area grade is low — what's the realistic commute time and amenity access for the typical tenant pool here? Any planned neighborhood developments (good or bad) we should know about?
- What's the average days-on-market for RENTAL listings here right now (not sales)? A rising rental-DOM trend means longer vacancies and softer asking-rent achievability than the comps imply.
- What's the recent tenant-quality profile in this submarket — average credit score on applications, eviction rate, late-payment / NSF rate, and stable-employment percentage? A property-management company in the area should have these aggregated.
- How much new for-sale + rental construction is in the pipeline within 1–3 miles? Heavy new supply typically softens prices + rents 12–24 months out; constrained supply supports both.
Investment metrics
- 1% rule
- 0.69% ✗
- Cap rate
- 4.63%
- Cash-on-cash
- -5.92%
- DSCR
- 0.74
- GRM
- 12.1
CMA / ARV
- ARV (on-the-fly)
- $410,520
- Comps found
- 4
Show comp detail 4 sales within ~0.75 mi
| Address | Dist | Beds/Ba | Sqft | Sold | Price | $/sf | Match |
|---|---|---|---|---|---|---|---|
| 11954 Savanna Lakes Blvd | 0.22mi | 6/3.0 (+1) | 3,041 (-11%) | 5mo | $365,000 | $120 | 62 |
| 19775 Lavender Field Ct | 0.19mi | 6/3.0 (+1) | 3,041 (-11%) | 9mo | $352,000 | $116 | 60 |
| 11902 Savanna Lakes Blvd | 0.34mi | 6/3.0 (+1) | 3,041 (-11%) | 2mo | $360,000 | $118 | 59 |
| 11889 Savanna Lakes Blvd | 0.37mi | 6/3.0 (+1) | 3,041 (-11%) | 2mo | $365,000 | $120 | 57 |
Match score weights: distance 35% · size 25% · config 20% · recency 20%. Top-matched comps best support the ARV.
Projected returns pro-forma
10.0% appreciation · 0.0% rent growth · sell at horizon
- IRR
- 19.3%
- Equity multiple
- 2.56×
- Total profit
- $185,431
- Equity at exit
- $382,784
- IRR
- 17.2%
- Equity multiple
- 5.71×
- Total profit
- $560,131
- Equity at exit
- $825,487
Cash invested: $118,972 (down + closing). Projections, not guarantees.
Landlord ↔ Tenant lean methodology
- Overall (STATE)
- 87 Strongly Landlord-Friendly
- State Florida
- 87 Strongly Landlord-Friendly · R+3
- County
- — inherits STATE
- City
- — inherits STATE
ZIP-level market 33974
- Home prices YoY
- 5.8%
- Rents YoY
- -4.7%
- Active inventory
- 2460
- Price-to-rent
- 12.1×
Monthly cashflow live
- Estimated rent
- $2,935 high interval (Pro) →
- Mortgage (P&I)
- −$2,228
- Tax from tax record
- −$500 /mo · $6,004/yr
- Insurance
- −$177
- HOA
- −$0
- Vacancy / Maint / Mgmt
- −$616
- Net cashflow
- $-587
Break-even live
Sensitivity live
| Price | -10% $-347 | -5% $-467 | +0% $-587 | +5% $-708 | +10% $-828 |
|---|---|---|---|---|---|
| Rent | -10% $-819 | -5% $-703 | +0% $-587 | +5% $-471 | +10% $-355 |
| Rate | -1.0pp $-373 | -0.5pp $-479 | base $-587 | +0.5pp $-697 | +1.0pp $-809 |
UW: 25.0% down · 7.5% · 30yr · 1.5% tax · 5.0% vac · 8.0% maint · 8.0% mgmt
Financing live
Cash to close
- Down payment
- $106,225
- Closing costs
- $12,747
- Reserves months
- —
- Total cash needed
- —
Loan-product check · same deal, 3 products live
Conventional
25% down · 7.5% · 30yr
- Down + closing
- —
- Monthly P&I
- —
- Monthly cashflow
- —
- DSCR
- —
- Eligible?
- —
Personal DTI + credit; lowest rate.
DSCR
20% down · 8.5% · 30yr
- Down + closing
- —
- Monthly P&I
- —
- Monthly cashflow
- —
- DSCR
- —
- Eligible?
- —
No personal income docs; deal must DSCR.
Hard money
10% down · 12.0% · 12mo
- Down + closing
- —
- Monthly P&I
- —
- Monthly cashflow
- —
- DSCR
- —
- Eligible?
- —
Short-term bridge; refi at stabilization.
Rent comps 7 comps
| Address | Beds | Baths | Sqft | Rent | $/sqft | DOM | Units | Dist |
|---|---|---|---|---|---|---|---|---|
| 11613 Savanna Lakes Blvd Lehigh Acres, FL | 5.0 | 3.0 | 2451 | $2,700 | $1.10 | 16d | 1 | 0.11mi |
| 19972 Green Pasture Rd Lehigh Acres, FL | 5.0 | 2.5 | 2959 | $3,000 | $1.01 | 22d | 1 | 0.17mi |
| 11902 Savanna Lakes Blvd Lehigh Acres, FL | 6.0 | 3.0 | 3041 | $2,750 | $0.90 | 16d | 1 | 0.32mi |
| 11634 Savanna Lakes Blvd Lehigh Acres, FL | 5.0 | 3.0 | 2451 | $2,650 | $1.08 | 22d | 1 | 0.39mi |
| 19525 Fairhill Ct Lehigh Acres, FL | 6.0 | 3.0 | 2463 | $2,499 | $1.01 | 24d | 1 | 0.77mi |
| 10329 Canal Brook Ln Lehigh Acres, FL | 4.0 | 2.5 | 2462 | $2,600 | $1.06 | 24d | 1 | 1.19mi |
| 10601 Crossback Ln Lehigh Acres, FL | 5.0 | 3.0 | 2634 | $2,800 | $1.06 | 24d | 1 | 1.30mi |
Listing history 18 events
-
2026-06-17days on market $424,900 Active 121 DOM
-
2026-06-16days on market $424,900 Active 120 DOM
-
2026-06-15days on market $424,900 Active 119 DOM
-
2026-06-13days on market $424,900 Active 117 DOM
-
2026-06-10days on market $424,900 Active 114 DOM
-
2026-06-09days on market $424,900 Active 113 DOM
-
2026-06-07days on market $424,900 Active 111 DOM
-
2026-06-02days on market $424,900 Active 106 DOM
-
2026-06-01days on market $424,900 Active 105 DOM
-
2026-06-01days on market $424,900 Active 104 DOM
-
2026-04-07price $424,900
-
2026-03-21price $462,900
-
2026-02-17$465,000 Active
-
2023-09-22soldstatus $445,000 Sold 653-char remark
Show marketing remark (653 chars)
The 3,326-square-foot Trenton is the perfect home to grow into. The first floor features an open plan kitchen, family room, and casual dining area. A breezy owner’s suite offers walk-in closet, dual sinks, and a tub shower. Also on the first floor is a flex space which makes for an ideal home office, and the second bedroom and full bath. Upstairs, a spacious loft offers more flexible living space, and four additional bedrooms that make use of a third full bath. Ideal for entertaining out-of-town guests, the Trenton is complete with back patio and 2-car garage. Renderings are used for display purposes only. Estimated delivery Aug/Sept 2023.
-
2023-08-23status Pending 653-char remark
Show marketing remark (653 chars)
The 3,326-square-foot Trenton is the perfect home to grow into. The first floor features an open plan kitchen, family room, and casual dining area. A breezy owner’s suite offers walk-in closet, dual sinks, and a tub shower. Also on the first floor is a flex space which makes for an ideal home office, and the second bedroom and full bath. Upstairs, a spacious loft offers more flexible living space, and four additional bedrooms that make use of a third full bath. Ideal for entertaining out-of-town guests, the Trenton is complete with back patio and 2-car garage. Renderings are used for display purposes only. Estimated delivery Aug/Sept 2023.
-
2023-08-18$451,297 Active 653-char remark
Show marketing remark (653 chars)
The 3,326-square-foot Trenton is the perfect home to grow into. The first floor features an open plan kitchen, family room, and casual dining area. A breezy owner’s suite offers walk-in closet, dual sinks, and a tub shower. Also on the first floor is a flex space which makes for an ideal home office, and the second bedroom and full bath. Upstairs, a spacious loft offers more flexible living space, and four additional bedrooms that make use of a third full bath. Ideal for entertaining out-of-town guests, the Trenton is complete with back patio and 2-car garage. Renderings are used for display purposes only. Estimated delivery Aug/Sept 2023.
-
2023-06-16soldstatus $352,300
-
2023-03-31soldstatus $4,853,900
ⓘ Source: listings_history table (triggers on properties + properties_extension) + one-shot
backfill from property_details.listing_events for pre-trigger history.
Tax reassessment forecast FL · Resets to sale price
- Current annual tax
- $6,004 · $500/mo
- Projected year-2 tax
- $6,004 · $500/mo
- Expected delta
- $0/yr ($0/mo · 0.0%)
ⓘ Screening estimate from a state-policy table — verify with the county assessor before closing.
Climate risk First Street
- Flood 4/10 Moderate FEMA zone X (unshaded) · 22% chance over 30 yrs
- Wildfire 5/10 Major
- Heat 9/10 Extreme 7 d/yr ≥108°F today · 27 d/yr by 30 yrs out
- Wind 10/10 Extreme 99% chance of damaging wind over 30 yrs
- Air quality 2/10 Low 1 unhealthy d/yr today · 2 by 30 yrs out
Nearby sold comps map
Loading sold comps map…
Walkable amenities ~0.75 mi
Loading nearby amenities…
Taxation est. · year 1
- Rental income
- $35,214
- − Mortgage interest
- −$23,801
- − Property taxes
- −$6,004
- − Insurance
- −$2,124
- − Repairs & maintenance
- −$2,817
- − Management
- −$2,817
- − Depreciation
- −$12,361
- Taxable loss
- −$14,710
- Est. tax savings @ 24.0%
- +$3,530
- After-tax cash flow
- $-3,517/yr
For passive investors: Depreciation is non-cash, so a rental often shows a tax loss while cash-flowing — sheltering income. Rental losses are passive: they offset passive income freely, and up to $25,000/yr can offset ordinary (W-2) income if you actively participate and your MAGI is under $100k (phasing out to $0 by $150k); unused losses carry forward. On sale, claimed depreciation is recaptured at up to 25%, and gains may owe capital-gains tax (a 1031 exchange can defer both). Figures are a year-1 estimate at your 24.0% rate — not tax advice; consult a CPA.
Schools (NCES district)
- District
- Lee
- NCES district ID
- 1201080
- Math proficiency
- 47% ▼ -11.00%
- Reading proficiency
- 50% ▼ -4.00%
- Median HH income
- $49,518
- Composite
- 41.49/100
- National rank
- #3458
- State rank
- #42 of 73 in FL
Livability — Lehigh Acres
- Score
- 59/100
- State rank
- #826
- US rank
- #20055
Category grades
Schools grade is shown separately in the Schools card above.
Census & demographics
- Census place
- Lehigh Acres, FL
- County
- Lee County · 788,662 people
- City population
- 130,638
- Metro
- Cape Coral-Fort Myers, FL
- Population (ZIP)
- 19,927
- Household income
- $72,192
- Rent vs Own
- Severe rent burden
- 434.0
Population outlook (Lee County) Hauer SSP2
- Today (2025)
- 871,946 people
- By 2030
- 955,468 · +9.6%
- By 2040
- 1,113,587 · +27.7%
- By 2050
- 1,256,891 · +44.1%
- By 2075
- 1,560,270 · +78.9%
- By 2100
- 1,726,848 · +98.0%
Race, ethnicity, and origin ACS 2023
- Neighborhood character
- Diverse neighborhood (Simpson 0.64)
- Race & ethnicity
- Hispanic / Latino 52% Two or more races 31% White 26% Black 18%
- Hispanic origin (detail)
- Mexican 12% Puerto Rican 7% Cuban 20% Dominican 4%
- Common ancestry
- Hispanic 7% Italian 1% Portuguese 1%
- Foreign-born
- 32% · Canada, Jamaica
- Languages at home
- 48% English-only · Spanish 43% French/Haitian/Cajun 7% Other Indo-European 1%
Political lean MEDSL · Lee
- 2024 margin
- Strong R (+28.4) · D 35.5% · R 63.9%
- 2008→2024 swing
- -18.0pp toward R · 2008: -10.4pp · 2024: -28.4pp
- All cycles
- 2024: R+28.4 2020: R+19.2 2016: R+20.4 2012: R+16.6 2008: R+10.4
Not yet ingested
- Civics
- —
Market trends
- HPI YoY
- ▲ 16.53%
- Current HPI
- 303.3399
- Rent YoY
- ▼ -4.68%
- Metro
- Cape Coral-Fort Myers, FL
- State GDP YoY
- ▲ 3.28%
- F500 in state
- 36
Industry mix (Fortune 500 HQ in FL)
| Industry | F500 HQs | Revenue |
|---|---|---|
| Industrial Technology | 2 | $29B |
|
||
| Insurance | 2 | $17B |
|
||
| Retail | 1 | $60B |
|
||
| Technology Distribution | 1 | $58B |
|
||
| Homebuilding | 1 | $35B |
|
||
| Technology Manufacturing | 1 | $35B |
|
||
Price history
-91.2% since first listed8 events — show timeline
- 2026-04-07 Price Changed $424,900 BEARMLS
- 2026-03-21 Price Changed $462,900 BEARMLS
- 2026-02-17 Listed $465,000 BEARMLS
- 2023-09-22 Sold (MLS) $445,000 NAPLESMLS
- 2023-08-23 Pending — NAPLESMLS
- 2023-08-18 Listed $451,297 NAPLESMLS
- 2023-06-16 Sold (Public Records) $352,300 Public Records
- 2023-03-31 Sold (Public Records) $4,853,900 Public Records
Property tax history
+165.5%/yrLatest (2025): $6,004 · +0.1% YoY. Source: county tax records.
Cash-flow waterfall
monthlySold comps — $/sqft
last 12 mo · ≤1 miLoading sold comps…