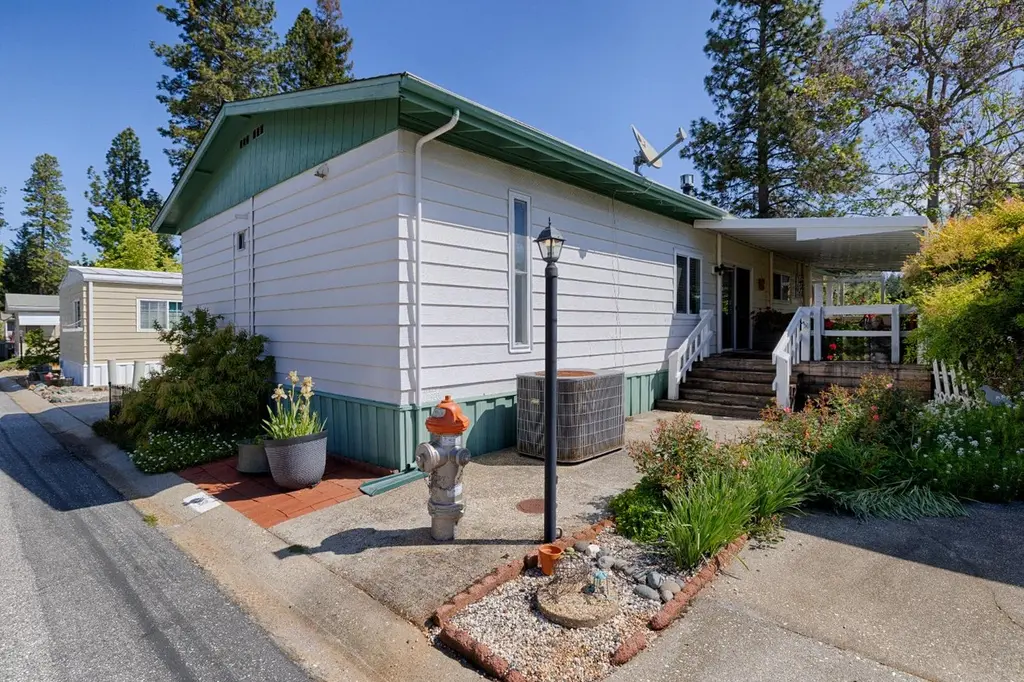
10131 Shamrock Lode · Alta Sierra, CA
Flood risk 1/10 · Minimal
- FEMA flood zone
- X (unshaded)
- Chance of flooding over 30 yrs
- 0.0%
- Est. flood insurance / yr
- $507 – $1,088
Fire risk 9/10 · Severe
- Est. fire insurance / yr
- $659 – $1,223
Heat risk 5/10 · Moderate
- Hot days now (above 96°F)
- 7 days/yr
- Hot days in 30 yrs
- 16 days/yr
Wind risk 1/10 · Minimal
- Chance of severe wind over 30 yrs
- —
Air-quality risk 10/10 · Severe
- Unhealthy air days now
- 33 days/yr
- Unhealthy air days in 30 yrs
- 40 days/yr
Risk factors via First Street. Map © Google.
Why this score? — see what drove the B+ grade
The composite is a weighted blend of 9 inputs, each scored 0–100. Each bar is that input's sub-score; the figure is the points it added to the 100-point composite (weight × sub-score).
- Cash flow +30.0/30.0
- ARV discount +15.0/15.0
- 1% rule +10.0/10.0
- DSCR +10.0/10.0
- Schools +3.8/10.0
- Livability +3.0/5.0
- Rent growth +2.5/5.0
- Condition / age +2.5/5.0
- Appreciation +0.0/10.0
$59,500
🖨 Deal sheet (PDF) 📄 Offer letter ✓ Due diligence
Listing remarks
Affordable & spacious 2-Bed, 2-Bath mobile home in Grass Valley near Alta Sierra. Discover this charming 2-bedroom, 2-bathroom mobile home, offering 1488 sq. ft. of comfortable living space. Built in 1974, this home is perfect for those seeking affordability without sacrificing space and convenience. Spacious layout with plenty of natural light. Don't miss out on this fantastic opportunity!
Key facts
- 2,853 sq ft lot
- Parking
- Built 1974
Property features AI
Finance
- Other: Property located at 10131 Shamrock Lode, Grass Valley, CA 95949; Lot features include landscaped yard and backyard; Lot has a land lease
- HOA & community: No homeowners association; Located in a senior community; Land lease: yes (monthly amount noted separately)
Exterior
- Parking: Attached covered parking
- Utilities: Public water; Public sewer; Cable available; Internet available; Individual electric meter; Generator; 220V outlet in laundry; Electric water heater
- Home design: Manufactured home in a park; Double-wide; Original condition; Built in 1974
- Construction: Aluminum skirting; Composition roof; Mobile Industries Inc. manufacturer/make
- Exterior features: Carport awning and porch awning; Backyard landscaping; Additional landscaping in back; Storage shed(s)
Interior
- Kitchen: Free standing gas range; Free standing electric range; Free standing refrigerator; Hood over range; Microwave; Dishwasher; Disposal; Laminate counters; Ice maker (plumbed)
- Bedrooms: 2 bedrooms (including master bedroom)
- Flooring: Carpet; Linoleum
- Bathrooms: 2 full bathrooms; Shower stall(s)
- Heating & cooling: Central heating and cooling; Gas heating; Wood stove; Ceiling fan(s)
- Interior features: Ceiling fan(s) and central cooling; Central gas heating plus wood stove; Thermostat (energy efficient); Porch steps, covered deck with rails; Dual-pane windows with coverings and screens; Great room living area; Dining/Family combo and Dining/Living combo
- Laundry & utility: Washer and dryer included; hookups provided; Laundry located inside
Neighborhood map
What this means for you Summary
Snapshot
- This is a 2-bed/2.0-bath manufactured listed at $60k.
Deal economics
- At list price, monthly cash flow is $1k ($16k/yr) — positive.
- The deal already cash-flows at list — no discount required.
- Meets the 1% rule at list price ($2k rent vs $60k).
- Cap rate 33.0% vs local median 3.4% in Alta Sierra — top-decile yield for the area; either an underpriced asset or a hidden risk that comps aren't pricing in. Stress-test before assuming the spread holds.
Location & tenants
- Location reads 59/100 on livability (#662 in CA) — a working-class tenant base; expect higher turnover. Strengths: employment A+, housing A+; Watch: crime C-, amenities F, commute F.
- Nevada Joint Union High (town): math 25% / reading 61% proficiency, ranked #201 of 517 in CA (top 39%) — families likely to look elsewhere, expect single-tenant / working-renter base with shorter leases.
- Zoned schools: Alta Sierra Elementary (math 52% / reading 52%, grade C-, #354 of 1,571 statewide, top 24%, 319 students, 34% FRL); Magnolia Intermediate (math 24% / reading 51%, grade F, #166 of 498 statewide, top 34%, 379 students, 35% FRL).
- Market conditions: 256 active listings in the ZIP; 1 comparable units currently listed for rent nearby; solid renter incomes; 215 units permitted in Nevada County in 2024 (0 in 5+ unit buildings).
Forward outlook
- Local home prices are declining (-3.0%/yr); year-one equity from $411 of loan paydown is wiped out by about $2k of value loss. Plan a longer hold.
- Nevada County population projected at -14% by 2050 — secular population decline; favor cash flow + early exit over multi-decade hold.
- At projected returns (-3.0% appreciation + 3.0% rent growth), your $17k cash investment doubles in ~2 years — after that, you're playing with house money.
Negotiation context
- Only 8 days on market — expect competitive offers; lowballing is unlikely to land.
Risks & watch-outs
- Climate carrying-cost: severe wildfire risk; extreme-heat days projected 7→16/yr by 2055 (HVAC capex compounding) — expect insurance premiums to compound above CPI over the hold.
Questions for the listing agent
- Built in 1974 — when were the roof, HVAC, electrical panel, plumbing, and water heater last replaced?
- Is there a deadline driving the sale (1031 exchange, divorce, estate, relocation)? That informs how much negotiation room exists.
- Schools are D-rated, which usually means shorter tenancies and higher turnover. Who's the typical renter profile here, and what's been the actual vacancy rate?
- What's the average days-on-market for RENTAL listings here right now (not sales)? A rising rental-DOM trend means longer vacancies and softer asking-rent achievability than the comps imply.
- What's the recent tenant-quality profile in this submarket — average credit score on applications, eviction rate, late-payment / NSF rate, and stable-employment percentage? A property-management company in the area should have these aggregated.
- How much new for-sale + rental construction is in the pipeline within 1–3 miles? Heavy new supply typically softens prices + rents 12–24 months out; constrained supply supports both.
Investment metrics
- 1% rule
- 3.69% ✓
- Cap rate
- 32.96%
- Cash-on-cash
- 95.26%
- DSCR
- 5.24
- GRM
- 2.3
CMA / ARV
- ARV (on-the-fly)
- $99,696
- Comps found
- 12
Show comp detail 12 sales within ~0.75 mi
| Address | Dist | Beds/Ba | Sqft | Sold | Price | $/sf | Match |
|---|---|---|---|---|---|---|---|
| 10131 Shamrock Lode | 0.00mi | 2/2.0 | 1,488 (0%) | 1mo | $60,000 | $40 | 99 |
| 10040 Stone Arch Dr | 0.09mi | 2/2.0 | 1,440 (-3%) | 4mo | $85,000 | $59 | 87 |
| 10042 Grinding Rock Dr | 0.14mi | 2/2.0 | 1,440 (-3%) | 5mo | $90,000 | $63 | 84 |
| 10086 Grinding Rock Dr #208 | 0.24mi | 2/2.0 | 1,536 (+3%) | 2mo | $75,000 | $49 | 82 |
| 10150 Stone Arch Dr | 0.10mi | 2/2.0 | 1,344 (-10%) | 1mo | $55,000 | $41 | 79 |
| 10024 Golden Shore Dr | 0.21mi | 3/2.0 (+1) | 1,566 (+5%) | 0mo | $210,000 | $134 | 76 |
| 10088 Dalewood Way | 0.43mi | 2/2.0 | 1,440 (-3%) | 0mo | $138,000 | $96 | 75 |
| 10046 Dalewood Way | 0.39mi | 2/2.0 | 1,440 (-3%) | 2mo | $160,000 | $111 | 75 |
| 10073 Dalewood Way | 0.43mi | 2/2.0 | 1,440 (-3%) | 1mo | $115,000 | $80 | 74 |
| 14821 Hidden Rock Dr #282 | 0.21mi | 2/2.0 | 1,337 (-10%) | 1mo | $89,500 | $67 | 72 |
| 14969 N Country Rd | 0.42mi | 3/2.0 (+1) | 1,456 (-2%) | 1mo | $82,500 | $57 | 71 |
| 14867 Hidden Rock Dr | 0.16mi | 3/2.0 (+1) | 1,658 (+11%) | 1mo | $186,000 | $112 | 68 |
Match score weights: distance 35% · size 25% · config 20% · recency 20%. Top-matched comps best support the ARV.
Projected returns pro-forma
-3.0% appreciation · 3.0% rent growth · sell at horizon
- IRR
- 96.2%
- Equity multiple
- 5.48×
- Total profit
- $74,621
- Equity at exit
- $8,872
- IRR
- 98.8%
- Equity multiple
- 11.42×
- Total profit
- $173,573
- Equity at exit
- $5,144
Cash invested: $16,660 (down + closing). Projections, not guarantees.
Landlord ↔ Tenant lean methodology
- Overall (STATE)
- 18 Strongly Tenant-Friendly
- State California
- 18 Strongly Tenant-Friendly · D+13
- County
- — inherits STATE
- City
- — inherits STATE
ZIP-level market 95949
- Home prices YoY
- -34.7%
- Active inventory
- 256
- Price-to-rent
- 2.3×
Monthly cashflow live
- Estimated rent
- $2,195 medium interval (Pro) →
- Mortgage (P&I)
- −$312
- Tax est. 1.5%
- −$74 /mo · $892/yr
- Insurance
- −$25
- HOA
- −$0
- Vacancy / Maint / Mgmt
- −$461
- Net cashflow
- $1,322
Break-even live
Sensitivity live
| Price | -10% $1,364 | -5% $1,343 | +0% $1,322 | +5% $1,302 | +10% $1,281 |
|---|---|---|---|---|---|
| Rent | -10% $1,149 | -5% $1,236 | +0% $1,322 | +5% $1,409 | +10% $1,496 |
| Rate | -1.0pp $1,352 | -0.5pp $1,338 | base $1,322 | +0.5pp $1,307 | +1.0pp $1,291 |
UW: 25.0% down · 7.5% · 30yr · 1.5% tax · 5.0% vac · 8.0% maint · 8.0% mgmt
Financing live
Cash to close
- Down payment
- $14,875
- Closing costs
- $1,785
- Reserves months
- —
- Total cash needed
- —
Loan-product check · same deal, 3 products live
Conventional
25% down · 7.5% · 30yr
- Down + closing
- —
- Monthly P&I
- —
- Monthly cashflow
- —
- DSCR
- —
- Eligible?
- —
Personal DTI + credit; lowest rate.
DSCR
20% down · 8.5% · 30yr
- Down + closing
- —
- Monthly P&I
- —
- Monthly cashflow
- —
- DSCR
- —
- Eligible?
- —
No personal income docs; deal must DSCR.
Hard money
10% down · 12.0% · 12mo
- Down + closing
- —
- Monthly P&I
- —
- Monthly cashflow
- —
- DSCR
- —
- Eligible?
- —
Short-term bridge; refi at stabilization.
Rent comps 1 comps
| Address | Beds | Baths | Sqft | Rent | $/sqft | DOM | Units | Dist |
|---|---|---|---|---|---|---|---|---|
| 15487 Kingsbury Cir Grass Valley, CA | 2.0 | 2.0 | 1200 | $2,000 | $1.67 | 4d | 1 | 1.25mi |
Climate risk First Street
- Flood 1/10 Low FEMA zone X (unshaded) · 0% chance over 30 yrs
- Wildfire 9/10 Extreme
- Heat 5/10 Major 7 d/yr ≥96°F today · 16 d/yr by 30 yrs out
- Wind 1/10 Low
- Air quality 10/10 Extreme 33 unhealthy d/yr today · 40 by 30 yrs out
Nearby sold comps map
Loading sold comps map…
Walkable amenities ~0.75 mi
Loading nearby amenities…
Taxation est. · year 1
- Rental income
- $26,334
- − Mortgage interest
- −$3,333
- − Property taxes
- −$892
- − Insurance
- −$298
- − Repairs & maintenance
- −$2,107
- − Management
- −$2,107
- − Depreciation
- −$1,731
- Taxable income
- $15,867
- Est. tax owed @ 24.0%
- −$3,808
- After-tax cash flow
- $12,062/yr
For passive investors: Depreciation is non-cash, so a rental often shows a tax loss while cash-flowing — sheltering income. Rental losses are passive: they offset passive income freely, and up to $25,000/yr can offset ordinary (W-2) income if you actively participate and your MAGI is under $100k (phasing out to $0 by $150k); unused losses carry forward. On sale, claimed depreciation is recaptured at up to 25%, and gains may owe capital-gains tax (a 1031 exchange can defer both). Figures are a year-1 estimate at your 24.0% rate — not tax advice; consult a CPA.
Schools (NCES district)
- District
- Nevada Joint Union High
- NCES district ID
- 0626880
- Math proficiency
- 25% ▼ -14.00%
- Reading proficiency
- 61% ▼ -7.00%
- Median HH income
- $57,336
- Composite
- 37.53/100
- National rank
- #4393
- State rank
- #201 of 517 in CA
Livability — Alta Sierra
- Score
- 59/100
- State rank
- #662
- US rank
- #20497
Category grades
Schools grade is shown separately in the Schools card above.
Census & demographics
- County
- Nevada County · 85,339 people
- Metro
- Truckee-Grass Valley, CA
- Population (ZIP)
- 20,552
- Household income
- $98,181
- Rent vs Own
- Severe rent burden
- 181.0
Population outlook (Nevada County) Hauer SSP2
- Today (2025)
- 98,490 people
- By 2030
- 97,295 · -1.2%
- By 2040
- 92,041 · -6.5%
- By 2050
- 85,164 · -13.5%
- By 2075
- 68,436 · -30.5%
- By 2100
- 49,536 · -49.7%
Race, ethnicity, and origin ACS 2023
- Neighborhood character
- Predominantly White (84%)
- Race & ethnicity
- White 84% Hispanic / Latino 8% Two or more races 8% Native American 1%
- Hispanic origin (detail)
- Mexican 6%
- Common ancestry
- Lithuanian 4% Italian 4% Slovak 2%
- Foreign-born
- 4% · Canada
- Languages at home
- 94% English-only · Spanish 3% Other Indo-European 1%
Political lean MEDSL · Nevada
- 2024 margin
- D (+12.2) · D 54.4% · R 42.1% · Other 3.5%
- 2008→2024 swing
- +6.9pp toward D · 2008: 5.3pp · 2024: 12.2pp
- All cycles
- 2024: D+12.2 2020: D+14.8 2016: D+4.5 2012: R+4.7 2008: D+5.3
Not yet ingested
- Civics
- —
Market trends
- HPI YoY
- ▼ -122.41%
- Current HPI
- 230.2373
- Rent YoY
- —
- Metro
- Truckee-Grass Valley, CA
- State GDP YoY
- ▲ 3.21%
- F500 in state
- 116
Industry mix (Fortune 500 HQ in CA)
| Industry | F500 HQs | Revenue |
|---|---|---|
| Technology | 27 | $1,492B |
|
||
| Financial Services | 3 | $174B |
|
||
| Retail | 3 | $44B |
|
||
| Insurance | 3 | $26B |
|
||
| Media / Entertainment | 2 | $115B |
|
||
| Pharmaceuticals / Biotech | 2 | $62B |
|
||
Property tax history
-44.0%/yrLatest (2021): $30 · -44.1% YoY. Source: county tax records.
Cash-flow waterfall
monthlySold comps — $/sqft
last 12 mo · ≤1 miLoading sold comps…