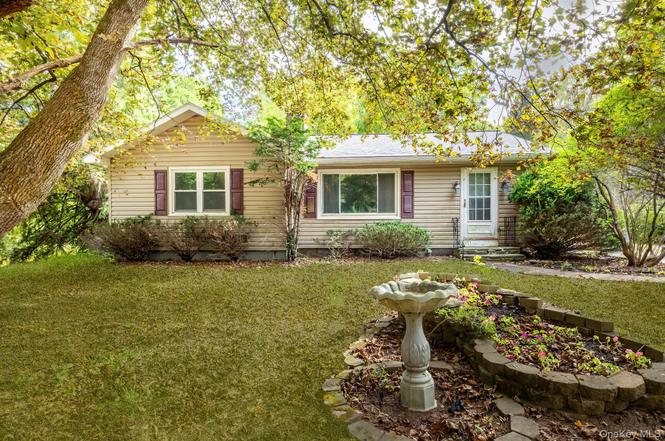
240 Stevers Crossing Rd · Philmont, NY
Flood risk 1/10 · Minimal
- FEMA flood zone
- X
- Chance of flooding over 30 yrs
- 0.0%
- Est. flood insurance / yr
- $473 – $860
Fire risk 5/10 · Moderate
- Est. fire insurance / yr
- $691 – $1,283
Heat risk 3/10 · Minor
- Hot days now (above 95°F)
- 7 days/yr
- Hot days in 30 yrs
- 16 days/yr
Wind risk 4/10 · Minor
- Chance of severe wind over 30 yrs
- 10.0%
Air-quality risk 2/10 · Minimal
- Unhealthy air days now
- 1 days/yr
- Unhealthy air days in 30 yrs
- 2 days/yr
Risk factors via First Street. Map © Google.
Why this score? — see what drove the B+ grade
The composite is a weighted blend of 9 inputs, each scored 0–100. Each bar is that input's sub-score; the figure is the points it added to the 100-point composite (weight × sub-score).
- Cash flow +24.8/30.0
- ARV discount +15.0/15.0
- Appreciation +10.0/10.0
- DSCR +8.0/10.0
- 1% rule +6.0/10.0
- Rent growth +5.0/5.0
- Schools +4.5/10.0
- Livability +3.0/5.0
- Condition / age +2.5/5.0
$239,000
🖨 Deal sheet 📄 Offer letter ✓ Due diligence
Listing remarks
Welcome to 240 Stevers Crossing in Hudson. This warm and inviting home features a new roof (2023), gutters (2024), electrical upgrade (2025), oil tank (2025), new septic tank and new leach fields (2021), and new bedroom carpets (2025). Enjoy cozy winters by the fireplace and a spacious yard that’s perfect for kids and outdoor gatherings. The location is ideal for nature lovers, with High Falls Park less than a mile away, Olana and Bash Bish Falls nearby, and plenty of trails for hiking and biking. Just minutes from Hudson’s Amtrak station, antique shops, and great restaurants, this home offers comfort, convenience, and the best of Hudson Valley living. HIGHEST AND BEST OFFERS DU
Key facts
- 1.2 acre lot
- Garage
- Built 1953
Neighborhood map
What this means for you Summary
Snapshot
- This is a 3-bed/1.0-bath single-family listed at $239k.
Deal economics
- At list price, monthly cash flow is $504 ($6k/yr) — positive.
- The deal already cash-flows at list — no discount required.
- Meets the 1% rule at list price ($3k rent vs $239k).
- Recommended offer: $225k (6.0% below list) — sets the bar for market timing.
Location & tenants
- Location reads 60/100 on livability (#958 in NY) — a middle-class / working-renter tenant base. Strengths: housing A+, cost of living B; Watch: crime F, amenities F, commute F.
- Taconic Hills Central School District (rural): math 53% / reading 51% proficiency, ranked #335 of 590 in NY (top 57%) — acceptable for families but not a draw, mixed tenant base, ~2y average lease.
- Zoned schools: Taconic Hills Elementary School (math 53% / reading 50%, grade C-, #1,041 of 2,108 statewide, top 50%, 562 students, 57% FRL); Taconic Hillsjunior/Senior High School (math 52% / reading 52%, grade D+, #946 of 1,100 statewide, top 88%, 502 students, 45% FRL).
- Market conditions: Rents rising fast (+10.9%/yr); 161 active listings in the ZIP; 1 comparable units currently listed for rent nearby; 136 units permitted in Columbia County in 2024 (0 in 5+ unit buildings).
Forward outlook
- In year one you build about $26k of equity ($2k loan paydown + $24k appreciation (10.0% local appreciation)).
- Columbia County population projected at -22% by 2050 — secular population decline; favor cash flow + early exit over multi-decade hold.
- At projected returns (10.0% appreciation + 8.0% rent growth), your $67k cash investment doubles in ~2 years — after that, you're playing with house money.
- By year 2, paydown + projected appreciation supports a ~$41k cash-out refi (75% LTV) — recoverable capital for the next deal without selling this one.
Negotiation context
- It's been on market 80 days — a 6% lower offer ($225k) is reasonable based on typical stale-listing flexibility.
- 2 sale attempts; this cycle's ask has dropped $26k (10%) from the opening price — seller is motivated, your offer sets the floor, not the list.
- Current owner paid $89k; list at $239k implies a 169% gain — meaningful room to come down on a strong offer.
Risks & watch-outs
- Watch-outs: built in 1953 — expect roof / HVAC / electrical / plumbing capex.
- Climate carrying-cost: moderate wildfire risk — expect insurance premiums to compound above CPI over the hold.
Questions for the listing agent
- It's been on market 80 days. Have you received any prior offers? Is the seller open to a 6% concession, seller financing, or rate buy-down credit?
- Built in 1953 — when were the roof, HVAC, electrical panel, plumbing, and water heater last replaced?
- Why hasn't it sold? Are there any deal-killer items the seller is aware of (foundation, flood, title, zoning, code violations)?
- Is there a deadline driving the sale (1031 exchange, divorce, estate, relocation)? That informs how much negotiation room exists.
- Schools are F-rated, which usually means shorter tenancies and higher turnover. Who's the typical renter profile here, and what's been the actual vacancy rate?
- Crime grade is F in this area — have there been break-ins, vandalism, or insurance claims at this property in the last 3 years? What carrier currently insures it and at what premium?
- What's the average days-on-market for RENTAL listings here right now (not sales)? A rising rental-DOM trend means longer vacancies and softer asking-rent achievability than the comps imply.
- What's the recent tenant-quality profile in this submarket — average credit score on applications, eviction rate, late-payment / NSF rate, and stable-employment percentage? A property-management company in the area should have these aggregated.
- How much new for-sale + rental construction is in the pipeline within 1–3 miles? Heavy new supply typically softens prices + rents 12–24 months out; constrained supply supports both.
Investment metrics
- 1% rule
- 1.10% ✓
- Cap rate
- 8.82%
- Cash-on-cash
- 9.03%
- DSCR
- 1.40
- GRM
- 7.6
CMA / ARV
- ARV (on-the-fly)
- $391,257
- Comps found
- 5
Show comp detail 5 sales within ~0.75 mi
| Address | Dist | Beds/Ba | Sqft | Sold | Price | $/sf | Match |
|---|---|---|---|---|---|---|---|
| 85 Summit St | 0.24mi | 3/1.0 | 1,240 (+7%) | 9mo | $370,000 | $298 | 70 |
| 43 Summit St | 0.61mi | 3/1.5 | 1,184 (+2%) | 2mo | $160,000 | $135 | 65 |
| 47 Summit St | 0.59mi | 3/1.5 | 1,300 (+12%) | 7mo | $437,500 | $337 | 45 |
| 47 Summit Street St | 0.59mi | 3/1.5 | 1,300 (+12%) | 7mo | $437,500 | $337 | 45 |
| 47 Summit St | 0.59mi | 3/1.5 | 1,300 (+12%) | 7mo | $437,500 | $337 | 45 |
Match score weights: distance 35% · size 25% · config 20% · recency 20%. Top-matched comps best support the ARV.
Projected returns pro-forma
10.0% appreciation · 8.0% rent growth · sell at horizon
- IRR
- 33.0%
- Equity multiple
- 3.63×
- Total profit
- $176,129
- Equity at exit
- $215,310
- IRR
- 30.1%
- Equity multiple
- 8.89×
- Total profit
- $527,872
- Equity at exit
- $464,324
Cash invested: $66,920 (down + closing). Projections, not guarantees.
Landlord ↔ Tenant lean methodology
- Overall (STATE)
- 15 Strongly Tenant-Friendly
- State New York
- 15 Strongly Tenant-Friendly · D+10
- County
- — inherits STATE
- City
- — inherits STATE
ZIP-level market 12534
- Home prices YoY
- 5.6%
- Rents YoY
- 10.9%
- Active inventory
- 161
- Price-to-rent
- 7.6×
Monthly cashflow live
- Estimated rent
- $2,630 medium interval (Pro) →
- Mortgage (P&I)
- −$1,253
- Tax from tax record
- −$222 /mo · $2,658/yr
- Insurance
- −$100
- HOA
- −$0
- Vacancy / Maint / Mgmt
- −$552
- Net cashflow
- $504
Break-even live
UW: 25.0% down · 7.5% · 30yr · 1.5% tax · 5.0% vac · 8.0% maint · 8.0% mgmt
Financing live
Cash to close
- Down payment
- $59,750
- Closing costs
- $7,170
- Reserves months
- —
- Total cash needed
- —
Loan-product check · same deal, 3 products live
Conventional
25% down · 7.5% · 30yr
- Down + closing
- —
- Monthly P&I
- —
- Monthly cashflow
- —
- DSCR
- —
- Eligible?
- —
Personal DTI + credit; lowest rate.
DSCR
20% down · 8.5% · 30yr
- Down + closing
- —
- Monthly P&I
- —
- Monthly cashflow
- —
- DSCR
- —
- Eligible?
- —
No personal income docs; deal must DSCR.
Hard money
10% down · 12.0% · 12mo
- Down + closing
- —
- Monthly P&I
- —
- Monthly cashflow
- —
- DSCR
- —
- Eligible?
- —
Short-term bridge; refi at stabilization.
Rent comps 1 comps
| Address | Beds | Baths | Sqft | Rent | $/sqft | DOM | Units | Dist |
|---|---|---|---|---|---|---|---|---|
| 129 Main St Unit 3 Philmont, NY | 2.0 | 1.0 | 1000 | $2,000 | $2.00 | 44d | 1 | 0.89mi |
Listing history 9 events
-
2026-05-21status Pending
-
2026-03-17status Active
-
2025-12-11status Pending
-
2025-11-07price $239,000
-
2025-10-14$265,000 Active
-
2025-10-10price $265,000
-
2025-10-10historical $260,000
-
2000-07-03soldstatus $89,000
-
1996-11-01soldstatus $87,000
ⓘ Source: listings_history table (triggers on properties + properties_extension) + one-shot
backfill from property_details.listing_events for pre-trigger history.
Tax reassessment forecast NY · Partial reset (capped growth)
- Current annual tax
- $2,658 · $222/mo
- Projected year-2 tax
- $3,349 · $279/mo
- Expected delta
- +$690/yr (+$58/mo · 26.0%)
ⓘ Screening estimate from a state-policy table — verify with the county assessor before closing.
Climate risk First Street
- Flood 1/10 Low FEMA zone X · 0% chance over 30 yrs
- Wildfire 5/10 Major
- Heat 3/10 Moderate 7 d/yr ≥95°F today · 16 d/yr by 30 yrs out
- Wind 4/10 Moderate 10% chance of damaging wind over 30 yrs
- Air quality 2/10 Low 1 unhealthy d/yr today · 2 by 30 yrs out
Nearby sold comps map
Loading sold comps map…
Walkable amenities ~0.75 mi
Loading nearby amenities…
Taxation est. · year 1
- Rental income
- $31,564
- − Mortgage interest
- −$13,388
- − Property taxes
- −$2,658
- − Insurance
- −$1,195
- − Repairs & maintenance
- −$2,525
- − Management
- −$2,525
- − Depreciation
- −$6,953
- Taxable income
- $2,320
- Est. tax owed @ 24.0%
- −$557
- After-tax cash flow
- $5,485/yr
For passive investors: Depreciation is non-cash, so a rental often shows a tax loss while cash-flowing — sheltering income. Rental losses are passive: they offset passive income freely, and up to $25,000/yr can offset ordinary (W-2) income if you actively participate and your MAGI is under $100k (phasing out to $0 by $150k); unused losses carry forward. On sale, claimed depreciation is recaptured at up to 25%, and gains may owe capital-gains tax (a 1031 exchange can defer both). Figures are a year-1 estimate at your 24.0% rate — not tax advice; consult a CPA.
Schools (NCES district)
- District
- Taconic Hills Central School District
- NCES district ID
- 3628620
- Math proficiency
- 53% ▲ 10.00%
- Reading proficiency
- 51% ▲ 11.00%
- Median HH income
- $57,329
- Composite
- 45.16/100
- National rank
- #2676
- State rank
- #335 of 590 in NY
Livability — Philmont
- Score
- 60/100
- State rank
- #958
- US rank
- #18780
Category grades
Schools grade is shown separately in the Schools card above.
Census & demographics
- County
- Columbia County · 17,176 people
- City population
- 1,575
- Metro
- Hudson, NY
- Population (ZIP)
- 17,176
- Household income
- $72,741
- Rent vs Own
- Severe rent burden
- 1083.0
Population outlook (Columbia County) Hauer SSP2
- Today (2025)
- 58,662 people
- By 2030
- 56,557 · -3.6%
- By 2040
- 51,324 · -12.5%
- By 2050
- 45,790 · -21.9%
- By 2075
- 35,232 · -39.9%
- By 2100
- 25,846 · -55.9%
Race, ethnicity, and origin ACS 2023
- Neighborhood character
- Predominantly White (74%)
- Race & ethnicity
- White 74% Two or more races 7% Black 7% Hispanic / Latino 7% Asian 6%
- Hispanic origin (detail)
- Mexican 2% Puerto Rican 1%
- Common ancestry
- Lithuanian 4% Romanian 4% Iranian 3%
- Foreign-born
- 10% · Canada, China
- Languages at home
- 88% English-only · Spanish 5% Other Indo-European 3% Chinese 1%
Political lean MEDSL · Columbia
- 2024 margin
- D (+14.7) · D 57.4% · R 42.6%
- 2008→2024 swing
- +1.3pp toward D · 2008: 13.4pp · 2024: 14.7pp
- All cycles
- 2024: D+14.7 2020: D+16.7 2016: D+1.4 2012: D+11.7 2008: D+13.4
Not yet ingested
- Civics
- —
Market trends
- HPI YoY
- ▲ 25.98%
- Current HPI
- 490.0412
- Rent YoY
- ▲ 10.88%
- Metro
- Hudson, NY
- State GDP YoY
- ▲ 2.60%
- F500 in state
- 92
Industry mix (Fortune 500 HQ in NY)
| Industry | F500 HQs | Revenue |
|---|---|---|
| Financial Services | 10 | $950B |
|
||
| Consumer Goods | 9 | $162B |
|
||
| Insurance | 4 | $225B |
|
||
| Telecommunications | 2 | $144B |
|
||
| Pharmaceuticals | 2 | $112B |
|
||
| Media / Entertainment | 2 | $69B |
|
||
Price history
+174.7% since first listed9 events — show timeline
- 2026-05-21 Pending — OneKey® MLS as Distributed by MLS Grid
- 2026-03-17 Relisted — OneKey® MLS as Distributed by MLS Grid
- 2025-12-11 Pending — OneKey® MLS as Distributed by MLS Grid
- 2025-11-07 Price Changed $239,000 OneKey® MLS as Distributed by MLS Grid
- 2025-10-14 Listed $265,000 OneKey® MLS as Distributed by MLS Grid
- 2025-10-10 Price Changed $265,000 OneKey® MLS as Distributed by MLS Grid
- 2025-10-10 Coming Soon $260,000 OneKey® MLS as Distributed by MLS Grid
- 2000-07-03 Sold (Public Records) $89,000 Public Records
- 1996-11-01 Sold (Public Records) $87,000 Public Records
Property tax history
+0.1%/yrLatest (2025): $2,658 · -0.1% YoY. Source: county tax records.
Cash-flow waterfall
monthlySold comps — $/sqft
last 12 mo · ≤1 miLoading sold comps…