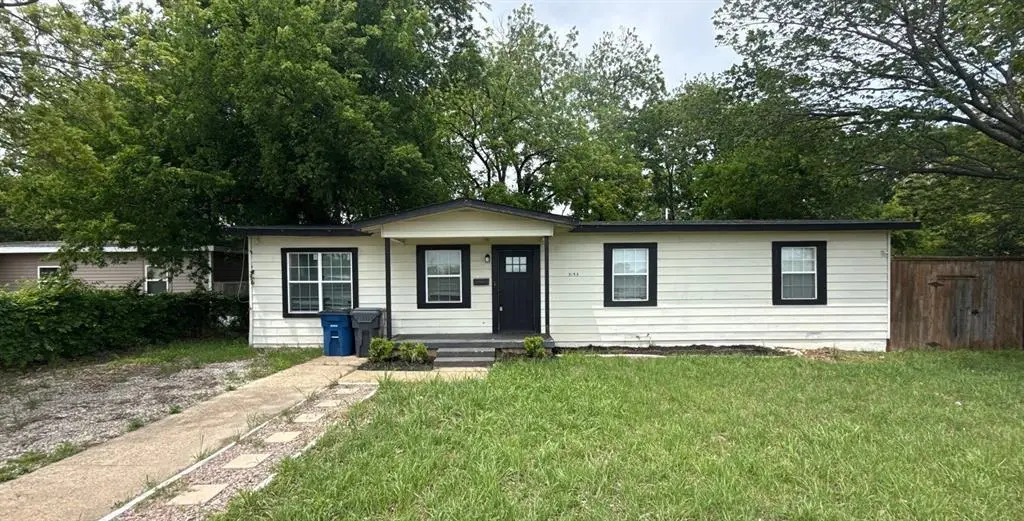
3155 E Ledbetter Dr · Dallas, TX
Flood risk 1/10 · Minimal
- FEMA flood zone
- X (unshaded)
- Chance of flooding over 30 yrs
- 0.0%
- Est. flood insurance / yr
- $507 – $1,088
Fire risk 3/10 · Minor
- Est. fire insurance / yr
- $1,222 – $2,270
Heat risk 7/10 · Major
- Hot days now (above 110°F)
- 7 days/yr
- Hot days in 30 yrs
- 25 days/yr
Wind risk 6/10 · Moderate
- Chance of severe wind over 30 yrs
- 27.0%
Air-quality risk 2/10 · Minimal
- Unhealthy air days now
- 1 days/yr
- Unhealthy air days in 30 yrs
- 2 days/yr
Risk factors via First Street. Map © Google.
Why this score? — see what drove the D+ grade
The composite is a weighted blend of 9 inputs, each scored 0–100. Each bar is that input's sub-score; the figure is the points it added to the 100-point composite (weight × sub-score).
- ARV discount +15.0/15.0
- Cash flow +12.2/30.0
- 1% rule +5.3/10.0
- Livability +4.0/5.0
- DSCR +3.6/10.0
- Rent growth +3.6/5.0
- Schools +2.8/10.0
- Condition / age +2.5/5.0
- Appreciation +0.0/10.0
$169,900
🖨 Deal sheet (PDF) 📄 Offer letter ✓ Due diligence
Listing remarks MLS
Beautifully remodeled home in a great location just 10 minutes to Downtown Dallas! This home is filled with endless updates that include wood-look laminate flooring, recessed lighting, soft neutral tones throughout, renovated bathrooms and so much more! The kitchen boasts stone countertops, updated stainless steel appliances, a center island with a breakfast bar and single-basin sink, and an open concept view into the spacious living room, perfect for entertaining! When you need to unwind, escape to one of the comfortable living rooms, or step out onto the open patio that overlooks the backyard full of mature trees and an 8ft privacy fence. Additional noteworthy items include recently replaced HVAC & air ducts, roof, electric panel, and water heater. This home provides easy access to major highways, where you can enjoy numerous shopping, dining & entertainment attractions. No detail was overlooked in this incredible home. Schedule your showing today!
Key facts
- Open patio
- Stone countertops
- Private backyard
Tags
Property features AI
Finance
- Other: Sold/possession at closing/funding; Seller disclosure not required; new survey at buyer's expense if needed
- Financial info: Listing available for cash or conventional financing; Property listed as real estate owned
- HOA & community: No homeowners association
Exterior
- Parking: Gravel parking
- Utilities: City water; City sewer; Not in a municipal utility district
- Home design: Single family residence; Residential property; One story
- Construction: Built in 1955
- Exterior features: Less than 0.5-acre lot; Lot in the Ann Arbor subdivision; Follow GPS for directions (property on Ledbetter Dr near Bismark Dr)
Interior
- Kitchen: Dishwasher
- Bedrooms: Primary bedroom on level 1; Two additional bedrooms on level 1 (three bedrooms total)
- Bathrooms: Two full bathrooms
- Interior features: Eat-in kitchen; Kitchen island; Open floorplan; Has basement; One living area; Five total rooms
Neighborhood map
What this means for you Summary
Snapshot
- This is a 3-bed/2.0-bath single-family listed at $170k.
Deal economics
- At list price, monthly cash flow is $-35 ($-425/yr) — negative.
- To cash-flow at today's rent, offer at most $164k (3.7% below list).
- Meets the 1% rule at list price ($2k rent vs $170k).
- Recommended offer: $164k (3.7% below list) — sets the bar for cash-flow.
- Cap rate 6.0% vs local median 2.3% in Dallas — top-decile yield for the area; either an underpriced asset or a hidden risk that comps aren't pricing in. Stress-test before assuming the spread holds.
Location & tenants
- Location reads 81/100 on livability (#24 in TX, #1,380 nationally) — a professional / high-income tenant draw. Strengths: amenities A+, commute A+, housing A+; Watch: crime F.
- Dallas ISD (urban): math 31% / reading 36% proficiency, ranked #559 of 826 in TX (top 68%) — families likely to look elsewhere, expect single-tenant / working-renter base with shorter leases; 83% free/reduced lunch — lower-income household profile, screen leases tightly.
- Zoned schools: Elisha M Pease El (math 18% / reading 24%, grade F, #3,492 of 4,322 statewide, top 81%, 817 students, 98% FRL); D A Hulcy Steam Middle (math 33% / reading 32%, grade F, #947 of 1,662 statewide, top 58%, 423 students, 88% FRL); South Oak Cliff H S (math 12% / reading 17%, grade F, #1,522 of 1,632 statewide, top 94%, 1,513 students, 94% FRL).
- Market conditions: Rents rising fast (+4.2%/yr); 253 active listings in the ZIP; 18 comparable units currently listed for rent nearby; rentals at typical pace (median 27d on market — plan ~3-4 weeks tenant-placement turnaround); lower-income renter base — watch delinquency; 12,577 units permitted in Dallas County in 2024 (6,829 in 5+ unit buildings).
- At $1,756/mo this rent would consume 51% of the median local household income ($41k/yr) (locally 2465% of renters already pay >50% of income on rent) — very limited rent-growth headroom before tenants either downsize or default.
Forward outlook
- Local home prices are declining (-3.0%/yr); year-one equity from $1k of loan paydown is wiped out by about $5k of value loss. Plan a longer hold.
- Dallas County population projected at +35% by 2050 — long-run rental-demand tailwind backs the buy-and-hold thesis.
Negotiation context
- It's been on market 20 days — a 2% lower offer ($167k) is reasonable based on typical stale-listing flexibility.
- 6 sale attempts since 4y ago with the ask held roughly flat each time — persistent listings suggest the price (not the market) is what's stuck; bring a comps-based counter.
Risks & watch-outs
- Watch-outs: property tax is 3.3% of price; built in 1955 — expect roof / HVAC / electrical / plumbing capex.
- Climate carrying-cost: major wind risk, 27% chance of damaging wind over 30y; extreme-heat days projected 7→25/yr by 2055 (HVAC capex compounding) — expect insurance premiums to compound above CPI over the hold.
Questions for the listing agent
- What do current leases actually rent for vs. the listed asking? Can we see a recent rent roll and the last 12 months of T-12 income?
- Built in 1955 — when were the roof, HVAC, electrical panel, plumbing, and water heater last replaced?
- Property tax is high relative to price — has the assessment been appealed recently, and will the sale trigger a re-assessment?
- Is there a deadline driving the sale (1031 exchange, divorce, estate, relocation)? That informs how much negotiation room exists.
- Crime grade is F in this area — have there been break-ins, vandalism, or insurance claims at this property in the last 3 years? What carrier currently insures it and at what premium?
- The area grade is low — what's the realistic commute time and amenity access for the typical tenant pool here? Any planned neighborhood developments (good or bad) we should know about?
- What's the average days-on-market for RENTAL listings here right now (not sales)? A rising rental-DOM trend means longer vacancies and softer asking-rent achievability than the comps imply.
- What's the recent tenant-quality profile in this submarket — average credit score on applications, eviction rate, late-payment / NSF rate, and stable-employment percentage? A property-management company in the area should have these aggregated.
- How much new for-sale + rental construction is in the pipeline within 1–3 miles? Heavy new supply typically softens prices + rents 12–24 months out; constrained supply supports both.
Investment metrics
- 1% rule
- 1.03% ✓
- Cap rate
- 6.04%
- Cash-on-cash
- -0.89%
- DSCR
- 0.96
- GRM
- 8.1
CMA / ARV
- ARV (on-the-fly)
- $239,400
- Comps found
- 12
Show comp detail 12 sales within ~0.75 mi
| Address | Dist | Beds/Ba | Sqft | Sold | Price | $/sf | Match |
|---|---|---|---|---|---|---|---|
| 3039 Dahlia Dr | 0.10mi | 3/2.0 | 1,275 (-9%) | 1mo | $220,000 | $173 | 80 |
| 3025 Dahlia Dr | 0.13mi | 3/1.0 | 1,356 (-3%) | 14mo | $150,000 | $111 | 72 |
| 3436 Kristen Dr | 0.50mi | 3/2.0 | 1,432 (+2%) | 2mo | $285,900 | $200 | 71 |
| 4605 Haas Dr | 0.47mi | 3/1.0 | 1,356 (-3%) | 1mo | $125,000 | $92 | 68 |
| 2977 Marjorie Ave | 0.47mi | 3/1.0 | 1,324 (-5%) | 6mo | $170,000 | $128 | 60 |
| 4841 Bromfield St | 0.15mi | 4/2.0 (+1) | 1,217 (-13%) | 11mo | $220,000 | $181 | 57 |
| 3214 51st St | 0.27mi | 3/1.0 | 1,196 (-15%) | 8mo | $220,000 | $184 | 52 |
| 5103 Cardiff | 0.72mi | 4/3.0 (+1) | 1,400 (0%) | 9mo | $240,000 | $171 | 50 |
| 4519 Colwick Dr | 0.66mi | 4/2.0 (+1) | 1,348 (-4%) | 13mo | $179,900 | $133 | 47 |
| 2836 Modree Ave | 0.55mi | 3/1.0 | 1,252 (-11%) | 13mo | $159,500 | $127 | 42 |
| 4324 Tacoma St | 0.75mi | 3/1.0 | 1,208 (-14%) | 3mo | $185,000 | $153 | 36 |
| 4515 Vandervort Dr | 0.67mi | 4/2.5 (+1) | 1,599 (+14%) | 15mo | $320,000 | $200 | 26 |
Match score weights: distance 35% · size 25% · config 20% · recency 20%. Top-matched comps best support the ARV.
Projected returns pro-forma
-3.0% appreciation · 4.2% rent growth · sell at horizon
- IRR
- -16.0%
- Equity multiple
- 0.42×
- Total profit
- $-27,463
- Equity at exit
- $25,333
- IRR
- -5.1%
- Equity multiple
- 0.64×
- Total profit
- $-17,071
- Equity at exit
- $14,690
Cash invested: $47,572 (down + closing). Projections, not guarantees.
Landlord ↔ Tenant lean methodology
- Overall (STATE)
- 87 Strongly Landlord-Friendly
- State Texas
- 87 Strongly Landlord-Friendly · R+5
- County
- — inherits STATE
- City
- — inherits STATE
ZIP-level market 75216
- Home prices YoY
- -29.7%
- Rents YoY
- 4.2%
- Active inventory
- 253
- Price-to-rent
- 8.1×
Monthly cashflow live
- Estimated rent
- $1,756 high interval (Pro) →
- Mortgage (P&I)
- −$891
- Tax from tax record
- −$461 /mo · $5,529/yr
- Insurance
- −$71
- HOA
- −$0
- Vacancy / Maint / Mgmt
- −$369
- Net cashflow
- $-35
Break-even live
Sensitivity live
| Price | -10% $61 | -5% $13 | +0% $-35 | +5% $-84 | +10% $-132 |
|---|---|---|---|---|---|
| Rent | -10% $-174 | -5% $-105 | +0% $-35 | +5% $34 | +10% $103 |
| Rate | -1.0pp $50 | -0.5pp $8 | base $-35 | +0.5pp $-79 | +1.0pp $-124 |
UW: 25.0% down · 7.5% · 30yr · 1.5% tax · 5.0% vac · 8.0% maint · 8.0% mgmt
Financing live
Cash to close
- Down payment
- $42,475
- Closing costs
- $5,097
- Reserves months
- —
- Total cash needed
- —
Loan-product check · same deal, 3 products live
Conventional
25% down · 7.5% · 30yr
- Down + closing
- —
- Monthly P&I
- —
- Monthly cashflow
- —
- DSCR
- —
- Eligible?
- —
Personal DTI + credit; lowest rate.
DSCR
20% down · 8.5% · 30yr
- Down + closing
- —
- Monthly P&I
- —
- Monthly cashflow
- —
- DSCR
- —
- Eligible?
- —
No personal income docs; deal must DSCR.
Hard money
10% down · 12.0% · 12mo
- Down + closing
- —
- Monthly P&I
- —
- Monthly cashflow
- —
- DSCR
- —
- Eligible?
- —
Short-term bridge; refi at stabilization.
Rent comps 18 comps
| Address | Beds | Baths | Sqft | Rent | $/sqft | DOM | Units | Dist |
|---|---|---|---|---|---|---|---|---|
| 3015 E Ledbetter Dr Dallas, TX | 2.0–3.0 | 2.0 | 1030 | $1,475 | $1.43 | 5d | 1 | 0.29mi |
| 3460 South Loop 12 Dallas, TX | 3.0 | 2.0 | 1048 | $1,350 | $1.29 | 26d | 1 | 0.37mi |
| 4836 Sunnyvale St Dallas, TX | 1.0–3.0 | 1.0–2.0 | 515 | $1,512 | $2.94 | 45d | 7 | 0.37mi |
| 3130 Stag Rd Dallas, TX | 1.0–3.0 | 1.0–2.0 | 831 | $1,469 | $1.77 | 45d | 3 | 0.38mi |
| 3024 Modree Ave Dallas, TX | 3.0 | 2.0 | 1149 | $1,700 | $1.48 | 45d | 1 | 0.41mi |
| 2751 E Ledbetter Dr Dallas, TX | 1.0–3.0 | 1.0–1.5 | 794 | $1,410 | $1.78 | 45d | 3 | 0.66mi |
| 5160 Cardiff St Dallas, TX | 4.0 | 2.0 | 1251 | $1,950 | $1.56 | 6d | 1 | 0.74mi |
| 5175 Cardiff St Dallas, TX | 3.0 | 1.0 | 1248 | $1,650 | $1.32 | 45d | 1 | 0.74mi |
| 4306 Landrum Ave Dallas, TX | 3.0 | 2.0 | 1226 | $1,695 | $1.38 | 4d | 1 | 0.85mi |
| 4306 Landrum Ave Dallas, TX | 3.0 | 2.0 | 1226 | $1,695 | $1.38 | 8d | 1 | 0.85mi |
| 4105 Balch Dr Unit B Dallas, TX | 3.0 | 2.5 | 1524 | $1,650 | $1.08 | 26d | 1 | 0.97mi |
| 4105 Balch Dr Dallas, TX | 3.0 | 2.5 | 1464 | $1,650 | $1.13 | 45d | 1 | 0.98mi |
| 3528 Keyridge Dr Dallas, TX | 3.0 | 2.0 | 1362 | $1,795 | $1.32 | 22d | 1 | 1.11mi |
| 2526 Exeter Ave Dallas, TX | 3.0 | 2.0 | 1520 | $1,800 | $1.18 | 13d | 1 | 1.14mi |
| 3835 Basswood Dr Dallas, TX | 3.0 | 2.0 | 1000 | $1,625 | $1.62 | 26d | 1 | 1.27mi |
| 3806 Castle Hills Dr Dallas, TX | 4.0 | 2.0 | 1422 | $1,900 | $1.34 | 19d | 1 | 1.35mi |
| 2228 52nd St Dallas, TX | 4.0 | 3.0 | 1730 | $2,300 | $1.33 | 9d | 1 | 1.38mi |
| 5821 Bonnie View Rd Dallas, TX | 1.0–3.0 | 1.0–2.0 | 820 | $1,101 | $1.34 | 9d | 7 | 1.41mi |
Listing history 13 events
-
2026-06-21days on market $169,900 Active 20 DOM
-
2026-06-18days on market $169,900 Active 17 DOM
-
2026-06-17days on market $169,900 Active 16 DOM
-
2026-06-16days on market $169,900 Active 15 DOM
-
2026-06-15days on market $169,900 Active 14 DOM
-
2026-06-13days on market $169,900 Active 12 DOM
-
2026-06-09days on market $169,900 Active 8 DOM
-
2026-06-08days on market $169,900 Active 7 DOM
-
2026-06-07days on market $169,900 Active 6 DOM
-
2026-06-04days on market $169,900 Active 3 DOM
-
2026-06-03days on market $169,900 Active 2 DOM
-
2026-06-02remarks 693-char remark
-
2026-06-02$169,900 Active 1 DOM
ⓘ Source: listings_history table (triggers on properties + properties_extension) + one-shot
backfill from property_details.listing_events for pre-trigger history.
Tax reassessment forecast TX · Resets to sale price
- Current annual tax
- $5,529 · $461/mo
- Projected year-2 tax
- $5,529 · $461/mo
- Expected delta
- $0/yr ($0/mo · 0.0%)
ⓘ Screening estimate from a state-policy table — verify with the county assessor before closing.
Climate risk First Street
- Flood 1/10 Low FEMA zone X (unshaded) · 0% chance over 30 yrs
- Wildfire 3/10 Moderate
- Heat 7/10 Severe 7 d/yr ≥110°F today · 25 d/yr by 30 yrs out
- Wind 6/10 Major 27% chance of damaging wind over 30 yrs
- Air quality 2/10 Low 1 unhealthy d/yr today · 2 by 30 yrs out
Nearby sold comps map
Loading sold comps map…
Walkable amenities ~0.75 mi
Loading nearby amenities…
Taxation est. · year 1
- Rental income
- $21,070
- − Mortgage interest
- −$9,517
- − Property taxes
- −$5,529
- − Insurance
- −$850
- − Repairs & maintenance
- −$1,686
- − Management
- −$1,686
- − Depreciation
- −$4,943
- Taxable loss
- −$3,140
- Est. tax savings @ 24.0%
- +$753
- After-tax cash flow
- $328/yr
For passive investors: Depreciation is non-cash, so a rental often shows a tax loss while cash-flowing — sheltering income. Rental losses are passive: they offset passive income freely, and up to $25,000/yr can offset ordinary (W-2) income if you actively participate and your MAGI is under $100k (phasing out to $0 by $150k); unused losses carry forward. On sale, claimed depreciation is recaptured at up to 25%, and gains may owe capital-gains tax (a 1031 exchange can defer both). Figures are a year-1 estimate at your 24.0% rate — not tax advice; consult a CPA.
Schools (NCES district)
- District
- Dallas ISD
- NCES district ID
- 4816230
- Math proficiency
- 31% ▼ -16.00%
- Reading proficiency
- 36% ▼ -4.00%
- Median HH income
- $42,881
- Composite
- 28.41/100
- National rank
- #6763
- State rank
- #559 of 826 in TX
Livability — Dallas
- Score
- 81/100
- State rank
- #24
- US rank
- #1380
Category grades
Schools grade is shown separately in the Schools card above.
Census & demographics
- Census place
- Dallas, TX
- County
- Dallas County · 2,612,404 people
- City population
- 1,168,437
- Metro
- Dallas-Fort Worth-Arlington, TX
- Population (ZIP)
- 55,894
- Household income
- $41,386
- Rent vs Own
- Severe rent burden
- 2465.0
Population outlook (Dallas County) Hauer SSP2
- Today (2025)
- 2,979,839 people
- By 2030
- 3,191,823 · +7.1%
- By 2040
- 3,619,611 · +21.5%
- By 2050
- 4,026,915 · +35.1%
- By 2075
- 4,957,073 · +66.4%
- By 2100
- 5,508,725 · +84.9%
Race, ethnicity, and origin ACS 2023
- Neighborhood character
- Majority Black (51%)
- Race & ethnicity
- Black 51% Hispanic / Latino 44% Two or more races 14% White 3%
- Hispanic origin (detail)
- Mexican 40%
- Common ancestry
- Hispanic 1%
- Foreign-born
- 17% · Canada
- Languages at home
- 62% English-only · Spanish 37%
Political lean MEDSL · Dallas
- 2024 margin
- Strong D (+22.2) · D 60.2% · R 38.0% · Other 1.8%
- 2008→2024 swing
- +6.9pp toward D · 2008: 15.3pp · 2024: 22.2pp
- All cycles
- 2024: D+22.2 2020: D+31.6 2016: D+26.2 2012: D+15.4 2008: D+15.3
Not yet ingested
- Civics
- —
Market trends
- HPI YoY
- ▼ -126.35%
- Current HPI
- 299.1825
- Rent YoY
- ▲ 4.20%
- Metro
- Dallas-Fort Worth-Arlington, TX
- State GDP YoY
- ▲ 3.95%
- F500 in state
- 110
Industry mix (Fortune 500 HQ in TX)
| Industry | F500 HQs | Revenue |
|---|---|---|
| Energy | 16 | $1,198B |
|
||
| Technology | 5 | $198B |
|
||
| Engineering / Construction | 4 | $72B |
|
||
| Energy Services | 3 | $60B |
|
||
| Utilities | 3 | $41B |
|
||
| Healthcare | 2 | $330B |
|
||
Price history
-27.7% since first listed17 events — show timeline
- 2026-05-29 Listed $169,900 NTREIS
- 2023-03-10 Sold (Public Records) — Public Records
- 2023-03-10 Sold (MLS) — NTREIS
- 2023-02-16 Pending — NTREIS
- 2023-02-14 Contingent — NTREIS
- 2023-02-07 Listed $235,000 NTREIS
- 2022-12-28 Listing Removed — NTREIS
- 2022-10-25 Listing Removed — NTREIS
- 2022-10-25 Listed $235,000 NTREIS
- 2022-10-20 Relisted — NTREIS
- 2022-10-19 Contingent — NTREIS
- 2022-09-27 Relisted — NTREIS
- 2022-09-25 Contingent — NTREIS
- 2022-09-14 Listed $235,000 NTREIS
- 2022-01-24 Sold (Public Records) — Public Records
- 2021-10-19 Sold (Public Records) — Public Records
- 2001-11-05 Sold (Public Records) — Public Records
Property tax history
+9.9%/yrLatest (2025): $5,529 · -0.4% YoY. Source: county tax records.
Cash-flow waterfall
monthlySold comps — $/sqft
last 12 mo · ≤1 miLoading sold comps…