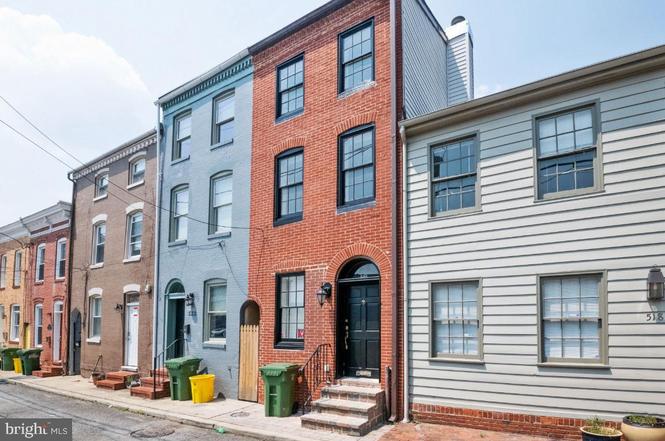
520 S Bethel St · Baltimore, MD
Flood risk 6/10 · Moderate
- FEMA flood zone
- X (unshaded)
- Chance of flooding over 30 yrs
- 0.69%
- Est. flood insurance / yr
- $473 – $860
Fire risk 1/10 · Minimal
- Est. fire insurance / yr
- $755 – $1,403
Heat risk 8/10 · Major
- Hot days now (above 103°F)
- 7 days/yr
- Hot days in 30 yrs
- 15 days/yr
Wind risk 6/10 · Moderate
- Chance of severe wind over 30 yrs
- 27.0%
Air-quality risk 4/10 · Minor
- Unhealthy air days now
- 6 days/yr
- Unhealthy air days in 30 yrs
- 7 days/yr
Risk factors via First Street. Map © Google.
Why this score? — see what drove the D grade
The composite is a weighted blend of 9 inputs, each scored 0–100. Each bar is that input's sub-score; the figure is the points it added to the 100-point composite (weight × sub-score).
- Cash flow +12.7/30.0
- ARV discount +11.3/15.0
- 1% rule +3.9/10.0
- DSCR +3.8/10.0
- Livability +3.8/5.0
- Rent growth +3.1/5.0
- Condition / age +2.5/5.0
- Schools +1.0/10.0
- Appreciation +0.0/10.0
$309,900
🖨 Deal sheet (PDF) 📄 Offer letter ✓ Due diligence
Listing remarks
This gorgeous three level townhouse has been rebuilt from the ground up. All new electrical, plumbing, roof, floors, HVAC, windows, etc. NOT a cosmetic renovation. Plenty of exposed brick walls, hardwood pickled floors, all new carpeting, wainscotting, crown molding and window seat. The kitchen is all granite and stainless-steel appliances with a breakfast bar and built-in wine caddie. Two Decks – one big roof top deck with Baltimore Skyline views and another deck off a bedroom/office that is extremely private. Completely renovated with new HVAC, hot water heater, carpet, ALL New! The Master Bath has a very unique glass block shower that has fiber optics built into it that changes the
Key facts
- Exposed brick walls
- Built-in wine caddie
- Roof top deck
Tags
Property features AI
Exterior
- Parking: On-street parking
- Utilities: Public water; Public sewer; Electric power
- Home design: Interior townhouse/rowhouse; Fee simple ownership; Year built is estimated
- Construction: Brick exterior; Other foundation type
- Exterior features: Brick construction; Deck(s); Above-grade and below-grade structures noted
Interior
- Kitchen: Built-in microwave; Dishwasher; Disposal; Refrigerator; Stainless steel appliances; Exhaust fan
- Bedrooms: Two bedrooms on the first upper level; One bedroom on the second upper level
- Bathrooms: Two full bathrooms (one on the first upper level, one on the second upper level)
- Heating & cooling: Forced air heating (electric); Central air conditioning (electric); Hot water via natural gas
- Interior features: Basement with outside entrance and partial finish; Deck(s); No tidal water on the lot; Pets allowed with no pet restrictions
- Laundry & utility: Washer and dryer included; Water heater
Neighborhood map
What this means for you Summary
Snapshot
- This is a 3-bed/1.5-bath townhouse listed at $310k.
Deal economics
- At list price, monthly cash flow is $-34 ($-409/yr) — negative.
- To cash-flow at today's rent, offer at most $304k (1.9% below list).
- To meet the 1% rule (rent ≥ 1% of price), the offer needs to be $277k (10.6% below list).
- Recommended offer: $277k (10.6% below list) — sets the bar for 1% rule.
Location & tenants
- Location reads 76/100 on livability (#90 in MD, #3,396 nationally) — a middle-class / working-renter tenant base. Strengths: amenities A+, commute A+, housing A+; Watch: crime F.
- Baltimore City Public Schools (urban): math 7% / reading 16% proficiency, ranked #24 of 24 in MD (top 100%) — low school quality limits family demand, transient renter base, plan for 1-2y turnover; 79% free/reduced lunch — lower-income household profile, screen leases tightly.
- Zoned schools: Elmer A. Henderson: A Johns Hopkins Partnership (math 2% / reading 16%, grade F, #650 of 860 statewide, top 77%, 642 students, 80% FRL); Baltimore Polytechnic Institute (math 71% / reading 84%, grade A-, #22 of 222 statewide, top 10%, 1,555 students, 43% FRL) — zoned schools average 62% FRL vs 79% district-wide (17 pts lower); this property's tenant base skews higher-income than the district average.
- Zoned-school proficiency averages 43% at this address vs 12% district-wide (+32 pts) — the actual schools serving this property are materially stronger than the Baltimore City Public Schools average implies; a family-tenant draw the district grade alone would hide.
- Market conditions: Rents rising (+2.3%/yr); 133 active listings in the ZIP; 40 comparable units currently listed for rent nearby; rentals at typical pace (median 26d on market — plan ~3-4 weeks tenant-placement turnaround); 40% of comp listings sitting > 30 days — soft ceiling on asking rent; solid renter incomes; 1,273 units permitted in Baltimore city in 2024 (1,104 in 5+ unit buildings).
- This rent runs 39% of the median local income ($85k/yr) — at the standard rent-burdened threshold; future hikes will face affordability resistance.
Forward outlook
- Local home prices are declining (-3.0%/yr); year-one equity from $2k of loan paydown is wiped out by about $9k of value loss. Plan a longer hold.
- Baltimore County population projected to shrink 4% by 2050 — rents likely to lag national; underwrite the cash flow, not the appreciation.
Negotiation context
- Only 3 days on market — expect competitive offers; lowballing is unlikely to land.
- 4 sale attempts since 21y ago with the ask held roughly flat each time — persistent listings suggest the price (not the market) is what's stuck; bring a comps-based counter.
- Current owner paid $201k; list at $310k implies a 54% gain — meaningful room to come down on a strong offer.
Risks & watch-outs
- Watch-outs: built in 1900 — expect roof / HVAC / electrical / plumbing capex.
- Climate carrying-cost: major flood risk; major wind risk, 27% chance of damaging wind over 30y; extreme-heat days projected 7→15/yr by 2055 (HVAC capex compounding) — expect insurance premiums to compound above CPI over the hold.
Questions for the listing agent
- What do current leases actually rent for vs. the listed asking? Can we see a recent rent roll and the last 12 months of T-12 income?
- Built in 1900 — when were the roof, HVAC, electrical panel, plumbing, and water heater last replaced?
- Is there a deadline driving the sale (1031 exchange, divorce, estate, relocation)? That informs how much negotiation room exists.
- Schools are D-rated, which usually means shorter tenancies and higher turnover. Who's the typical renter profile here, and what's been the actual vacancy rate?
- Crime grade is F in this area — have there been break-ins, vandalism, or insurance claims at this property in the last 3 years? What carrier currently insures it and at what premium?
- The area grade is low — what's the realistic commute time and amenity access for the typical tenant pool here? Any planned neighborhood developments (good or bad) we should know about?
- What's the average days-on-market for RENTAL listings here right now (not sales)? A rising rental-DOM trend means longer vacancies and softer asking-rent achievability than the comps imply.
- What's the recent tenant-quality profile in this submarket — average credit score on applications, eviction rate, late-payment / NSF rate, and stable-employment percentage? A property-management company in the area should have these aggregated.
- How much new for-sale + rental construction is in the pipeline within 1–3 miles? Heavy new supply typically softens prices + rents 12–24 months out; constrained supply supports both.
Investment metrics
- 1% rule
- 0.89% ✗
- Cap rate
- 6.16%
- Cash-on-cash
- -0.47%
- DSCR
- 0.98
- GRM
- 9.3
CMA / ARV
- ARV (on-the-fly)
- $338,800
- Comps found
- 12
Show comp detail 12 sales within ~0.75 mi
| Address | Dist | Beds/Ba | Sqft | Sold | Price | $/sf | Match |
|---|---|---|---|---|---|---|---|
| 1330 Lancaster St Unit C402 | 0.26mi | 2/2.0 (-1) | 1,429 (+2%) | 0mo | $775,000 | $542 | 77 |
| 219 S Washington St | 0.41mi | 3/2.0 | 1,434 (+2%) | 0mo | $350,000 | $244 | 74 |
| 509 S Collington Ave S | 0.48mi | 3/2.0 | 1,451 (+4%) | 1mo | $250,000 | $172 | 69 |
| 18 S Washington St | 0.51mi | 3/3.0 | 1,410 (+1%) | 0mo | $318,000 | $226 | 69 |
| 317 S Collington | 0.50mi | 3/2.5 | 1,440 (+3%) | 1mo | $365,000 | $253 | 67 |
| 307 S Exeter St | 0.34mi | 2/2.0 (-1) | 1,497 (+7%) | 1mo | $362,900 | $242 | 65 |
| 1400 Lancaster St #303 | 0.20mi | 2/2.5 (-1) | 1,539 (+10%) | 1mo | $425,000 | $276 | 64 |
| 14 N Wolfe St N | 0.56mi | 2/2.0 (-1) | 1,424 (+2%) | 1mo | $292,000 | $205 | 64 |
| 1330 Lancaster St Unit C603 | 0.26mi | 2/2.0 (-1) | 1,550 (+11%) | 0mo | $985,000 | $635 | 63 |
| 411 S Chester St | 0.43mi | 2/2.0 (-1) | 1,491 (+6%) | 1mo | $360,000 | $241 | 61 |
| 325 S Castle St | 0.40mi | 2/1.5 (-1) | 1,196 (-15%) | 0mo | $275,000 | $230 | 52 |
| 2428 Fleet St | 0.68mi | 2/2.5 (-1) | 1,300 (-7%) | 1mo | $285,000 | $219 | 47 |
Match score weights: distance 35% · size 25% · config 20% · recency 20%. Top-matched comps best support the ARV.
Projected returns pro-forma
-3.0% appreciation · 2.26% rent growth · sell at horizon
- IRR
- -17.9%
- Equity multiple
- 0.37×
- Total profit
- $-54,342
- Equity at exit
- $46,207
- IRR
- -11.6%
- Equity multiple
- 0.33×
- Total profit
- $-58,017
- Equity at exit
- $26,794
Cash invested: $86,772 (down + closing). Projections, not guarantees.
Landlord ↔ Tenant lean methodology
- Overall (CITY)
- 12 Strongly Tenant-Friendly
- State Maryland
- 27 Tenant-Leaning · D+14
- County
- — inherits STATE
- City Baltimore
- 12 Strongly Tenant-Friendly · D+58
ZIP-level market 21231
- Rents YoY
- 2.3%
- Active inventory
- 133
- Price-to-rent
- 9.3×
Monthly cashflow live
- Estimated rent
- $2,769 high interval (Pro) →
- Mortgage (P&I)
- −$1,625
- Tax from tax record
- −$468 /mo · $5,611/yr
- Insurance
- −$129
- HOA
- −$0
- Vacancy / Maint / Mgmt
- −$582
- Net cashflow
- $-34
Break-even live
Sensitivity live
| Price | -10% $141 | -5% $54 | +0% $-34 | +5% $-122 | +10% $-209 |
|---|---|---|---|---|---|
| Rent | -10% $-253 | -5% $-143 | +0% $-34 | +5% $75 | +10% $185 |
| Rate | -1.0pp $122 | -0.5pp $45 | base $-34 | +0.5pp $-114 | +1.0pp $-196 |
UW: 25.0% down · 7.5% · 30yr · 1.5% tax · 5.0% vac · 8.0% maint · 8.0% mgmt
Financing live
Cash to close
- Down payment
- $77,475
- Closing costs
- $9,297
- Reserves months
- —
- Total cash needed
- —
Loan-product check · same deal, 3 products live
Conventional
25% down · 7.5% · 30yr
- Down + closing
- —
- Monthly P&I
- —
- Monthly cashflow
- —
- DSCR
- —
- Eligible?
- —
Personal DTI + credit; lowest rate.
DSCR
20% down · 8.5% · 30yr
- Down + closing
- —
- Monthly P&I
- —
- Monthly cashflow
- —
- DSCR
- —
- Eligible?
- —
No personal income docs; deal must DSCR.
Hard money
10% down · 12.0% · 12mo
- Down + closing
- —
- Monthly P&I
- —
- Monthly cashflow
- —
- DSCR
- —
- Eligible?
- —
Short-term bridge; refi at stabilization.
Rent comps 40 comps
| Address | Beds | Baths | Sqft | Rent | $/sqft | DOM | Units | Dist |
|---|---|---|---|---|---|---|---|---|
| 516 S Bethel St Baltimore, MD | 2.0 | 2.0 | 1307 | $2,500 | $1.91 | 25d | 1 | 0.02mi |
| 430 S Bond St Baltimore, MD | 3.0 | 2.5 | 1842 | $2,875 | $1.56 | 19d | 1 | 0.05mi |
| 622 S Broadway Baltimore, MD | 2.0 | 1.0–2.0 | 953 | $2,998 | $3.14 | 0d | 12 | 0.11mi |
| 520 S Caroline St Unit 405 Baltimore, MD | 2.0 | 1.0 | 890 | $2,300 | $2.58 | 25d | 1 | 0.11mi |
| 706 S Bethel St Baltimore, MD | 3.0 | 2.0 | 1500 | $3,300 | $2.20 | 45d | 1 | 0.13mi |
| 1742 Fleet St Unit 204 Baltimore, MD | 2.0 | 2.0 | 916 | $2,100 | $2.29 | 45d | 1 | 0.17mi |
| 424 S Eden St Baltimore, MD | 4.0 | 3.5 | 1830 | $3,200 | $1.75 | 25d | 1 | 0.20mi |
| 210 S Caroline St Baltimore, MD | 1.0–2.0 | 1.0 | 808 | $1,965 | $2.43 | 45d | 23 | 0.26mi |
| 1802 Gough St Baltimore, MD | 3.0 | 2.0 | 1368 | $2,595 | $1.90 | 45d | 1 | 0.28mi |
| 1911 Eastern Ave Baltimore, MD | 4.0 | 4.0 | 1520 | $2,600 | $1.71 | 25d | 1 | 0.29mi |
| 1816 Gough St Baltimore, MD | 4.0 | 2.0 | 1248 | $3,500 | $2.80 | 25d | 1 | 0.29mi |
| 1904 Bank St Baltimore, MD | 3.0 | 3.5 | 1792 | $3,250 | $1.81 | 45d | 1 | 0.30mi |
| 251 S Durham St Baltimore, MD | 2.0 | 1.5 | 1120 | $2,300 | $2.05 | 25d | 1 | 0.31mi |
| 1927 Bank St Baltimore, MD | 2.0 | 2.5 | 1106 | $2,250 | $2.03 | 0d | 1 | 0.33mi |
| 1402 Point St Baltimore, MD | 2.0–3.0 | 2.5–3.0 | 1470 | $5,730 | $3.90 | 5d | 3 | 0.33mi |
| 675 President St #1501 Baltimore, MD | 2.0 | 2.0 | 1466 | $5,500 | $3.75 | 45d | 1 | 0.36mi |
| 2013 Fleet St Baltimore, MD | 3.0 | 2.5 | 1565 | $2,800 | $1.79 | 0d | 1 | 0.36mi |
| 1818 E Pratt St Apt A Baltimore, MD | 3.0 | 2.5 | 1736 | $2,500 | $1.44 | 19d | 1 | 0.38mi |
| 2018 Fountain St Baltimore, MD | 2.0 | 1.0 | 1000 | $1,550 | $1.55 | 19d | 1 | 0.38mi |
| 555 President St Baltimore, MD | 3.0 | 1.0–4.0 | 1352 | $5,438 | $4.02 | 0d | 1 | 0.39mi |
| 122 Lloyd St Baltimore, MD | 2.0 | 2.5 | 1620 | $2,855 | $1.76 | 25d | 1 | 0.42mi |
| 301 S President St Unit 1013815P Baltimore, MD | 2.0 | 2.0 | 1097 | $4,837 | $4.41 | 0d | 1 | 0.42mi |
| 1005 Granby St #187 Baltimore, MD | 2.0 | 2.0 | 1351 | $2,200 | $1.63 | 45d | 1 | 0.43mi |
| 513 S Chester St Baltimore, MD | 4.0 | 4.5 | 1534 | $3,000 | $1.96 | 19d | 1 | 0.44mi |
| 1000 Fell St #603 Baltimore, MD | 2.0 | 1.0 | 1224 | $2,200 | $1.80 | 46d | 1 | 0.45mi |
| 16 S Wolfe St Unit B Baltimore, MD | 2.0 | 2.0 | 1014 | $1,800 | $1.78 | 19d | 1 | 0.47mi |
| 250 President St #403 Baltimore, MD | 2.0 | 2.0 | 1500 | $3,000 | $2.00 | 45d | 1 | 0.47mi |
| 328 S Collington Ave Baltimore, MD | 2.0 | 2.0 | 1100 | $2,300 | $2.09 | 45d | 1 | 0.50mi |
| 104 N Dallas St Baltimore, MD | 3.0 | 2.5 | 1584 | $2,500 | $1.58 | 23d | 1 | 0.53mi |
| 2210 Cambridge St Baltimore, MD | 3.0 | 3.5 | 1450 | $2,725 | $1.88 | 45d | 1 | 0.54mi |
| 513 S Madeira St Baltimore, MD | 2.0 | 2.0 | 1132 | $2,000 | $1.77 | 6d | 1 | 0.55mi |
| 411 S Madeira St Baltimore, MD | 2.0 | 2.0 | 1312 | $2,150 | $1.64 | 45d | 1 | 0.55mi |
| 2217 Fleet St Baltimore, MD | 3.0 | 2.0 | 1598 | $2,700 | $1.69 | 12d | 1 | 0.55mi |
| 227 S Madeira St Baltimore, MD | 2.0 | 2.5 | 1100 | $2,200 | $2.00 | 45d | 1 | 0.59mi |
| 2015 E Fairmount Ave Baltimore, MD | 3.0 | 3.5 | 1402 | $2,500 | $1.78 | 45d | 1 | 0.63mi |
| 801 Key Hwy Unit P60 Baltimore, MD | 2.0 | 2.0 | 1864 | $6,500 | $3.49 | 25d | 1 | 0.68mi |
| 2115 E Fairmount Ave Baltimore, MD | 3.0 | 2.5 | 1736 | $2,795 | $1.61 | 25d | 1 | 0.70mi |
| 100 Harborview Dr #204 Baltimore, MD | 2.0 | 2.0 | 1447 | $3,500 | $2.42 | 14d | 1 | 0.72mi |
| 107 N Chester St Unit 2 Baltimore, MD | 3.0 | 1.0 | 1750 | $2,750 | $1.57 | 45d | 1 | 0.72mi |
| 825 S Port St Baltimore, MD | 2.0 | 1.5 | 1316 | $2,800 | $2.13 | 45d | 1 | 0.73mi |
Listing history 3 events
-
2026-06-21days on market $309,900 Active 3 DOM
-
2026-06-18remarks 693-char remark
-
2026-06-18$309,900 Active 1 DOM
ⓘ Source: listings_history table (triggers on properties + properties_extension) + one-shot
backfill from property_details.listing_events for pre-trigger history.
Tax reassessment forecast MD · Partial reset (capped growth)
- Current annual tax
- $5,611 · $468/mo
- Projected year-2 tax
- $5,611 · $468/mo
- Expected delta
- $0/yr ($0/mo · 0.0%)
ⓘ Screening estimate from a state-policy table — verify with the county assessor before closing.
Climate risk First Street
- Flood 6/10 Major FEMA zone X (unshaded) · 69% chance over 30 yrs
- Wildfire 1/10 Low
- Heat 8/10 Severe 7 d/yr ≥103°F today · 15 d/yr by 30 yrs out
- Wind 6/10 Major 27% chance of damaging wind over 30 yrs
- Air quality 4/10 Moderate 6 unhealthy d/yr today · 7 by 30 yrs out
Nearby sold comps map
Loading sold comps map…
Walkable amenities ~0.75 mi
Loading nearby amenities…
Taxation est. · year 1
- Rental income
- $33,233
- − Mortgage interest
- −$17,359
- − Property taxes
- −$5,611
- − Insurance
- −$1,550
- − Repairs & maintenance
- −$2,659
- − Management
- −$2,659
- − Depreciation
- −$9,015
- Taxable loss
- −$5,620
- Est. tax savings @ 24.0%
- +$1,349
- After-tax cash flow
- $940/yr
For passive investors: Depreciation is non-cash, so a rental often shows a tax loss while cash-flowing — sheltering income. Rental losses are passive: they offset passive income freely, and up to $25,000/yr can offset ordinary (W-2) income if you actively participate and your MAGI is under $100k (phasing out to $0 by $150k); unused losses carry forward. On sale, claimed depreciation is recaptured at up to 25%, and gains may owe capital-gains tax (a 1031 exchange can defer both). Figures are a year-1 estimate at your 24.0% rate — not tax advice; consult a CPA.
Schools (NCES district)
- District
- Baltimore City Public Schools
- NCES district ID
- 2400090
- Math proficiency
- 7% ▼ -9.00%
- Reading proficiency
- 16% ▼ -5.00%
- Median HH income
- $42,108
- Composite
- 10.08/100
- National rank
- #9805
- State rank
- #24 of 24 in MD
Livability — Baltimore
- Score
- 76/100
- State rank
- #90
- US rank
- #3396
Category grades
Schools grade is shown separately in the Schools card above.
Census & demographics
- Census place
- Baltimore, MD
- County
- Baltimore City · 558,601 people
- City population
- 588,727
- Metro
- Baltimore-Columbia-Towson, MD
- Population (ZIP)
- 14,969
- Household income
- $85,254
- Rent vs Own
- Severe rent burden
- 1147.0
Population outlook (Baltimore County) Hauer SSP2
- Today (2025)
- 624,249 people
- By 2030
- 621,541 · -0.4%
- By 2040
- 609,756 · -2.3%
- By 2050
- 597,249 · -4.3%
- By 2075
- 552,236 · -11.5%
- By 2100
- 513,934 · -17.7%
Race, ethnicity, and origin ACS 2023
- Neighborhood character
- Diverse neighborhood (Simpson 0.62)
- Race & ethnicity
- White 53% Black 29% Hispanic / Latino 9% Two or more races 7% Asian 4%
- Hispanic origin (detail)
- Mexican 3% Puerto Rican 1%
- Common ancestry
- Romanian 6% Slovak 2% Lithuanian 2%
- Foreign-born
- 10% · Canada, China, South Korea
- Languages at home
- 85% English-only · Spanish 6% Other Indo-European 2% Russian/Polish/Slavic 1%
Political lean MEDSL · Baltimore
- 2024 margin
- Solid D (+73.0) · D 85.2% · R 12.2% · Other 2.6%
- 2008→2024 swing
- -2.5pp toward R · 2008: 75.5pp · 2024: 73.0pp
- All cycles
- 2024: D+73.0 2020: D+76.6 2016: D+74.6 2012: D+76.4 2008: D+75.5
Not yet ingested
- Civics
- —
Market trends
- HPI YoY
- ▼ -545.26%
- Current HPI
- 351.3778
- Rent YoY
- ▲ 2.26%
- Metro
- Baltimore-Columbia-Towson, MD
- State GDP YoY
- ▲ 2.97%
- F500 in state
- 12
Industry mix (Fortune 500 HQ in MD)
| Industry | F500 HQs | Revenue |
|---|---|---|
| Aerospace / Defense | 1 | $71B |
|
||
| Utilities | 1 | $25B |
|
||
| Hotels | 1 | $24B |
|
||
| Consumer Goods | 1 | $7B |
|
||
| Real Estate | 1 | $6B |
|
||
| Chemicals | 1 | $2B |
|
||
Price history
+378.5% since first listed10 events — show timeline
- 2026-06-18 Listed $309,900 BRIGHT MLS
- 2021-08-14 Listing Removed — BRIGHT MLS
- 2021-07-16 Listed $379,000 BRIGHT MLS
- 2007-12-05 Delisted — MRIS
- 2006-11-15 Listed — MRIS
- 2005-09-30 Sold (Public Records) $201,000 Public Records
- 2005-08-29 Sold (MLS) $201,000 MRIS
- 2005-07-28 Delisted — MRIS
- 2005-06-20 Listed $199,900 MRIS
- 2001-02-20 Sold (Public Records) $64,770 Public Records
Property tax history
+0.5%/yrLatest (2025): $5,611 · +6.0% YoY. Source: county tax records.
Cash-flow waterfall
monthlySold comps — $/sqft
last 12 mo · ≤1 miLoading sold comps…