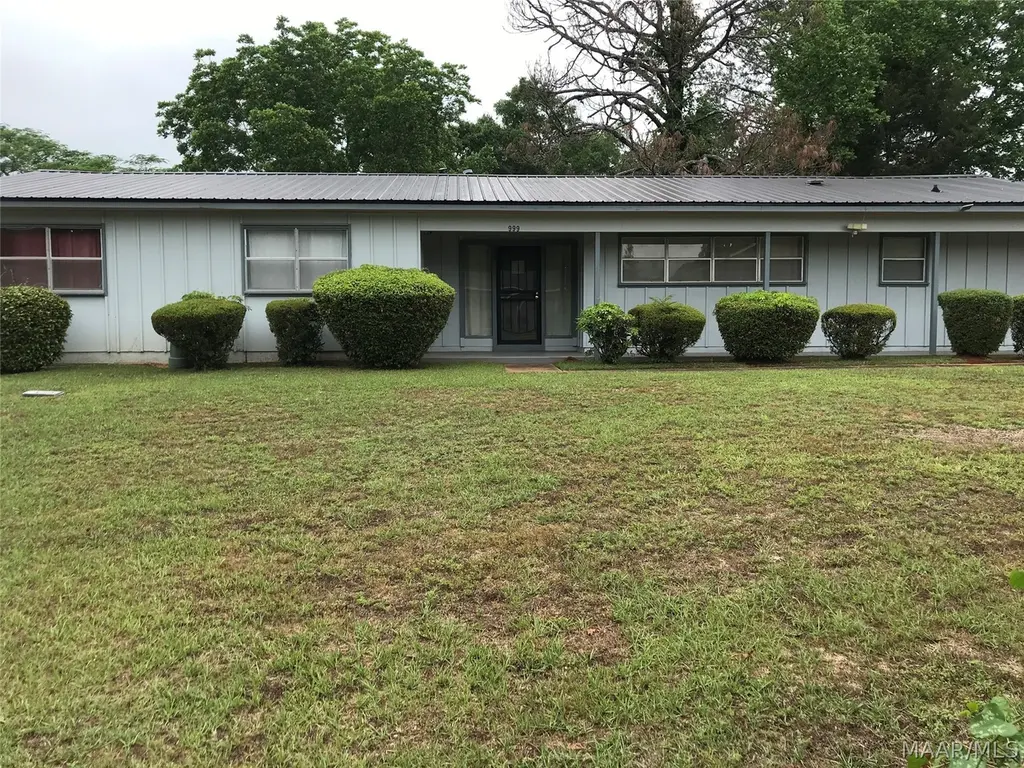
999 Randolph Cir · Selmont-West Selmont, AL
Flood risk 1/10 · Minimal
- FEMA flood zone
- X (unshaded)
- Chance of flooding over 30 yrs
- 0.0%
- Est. flood insurance / yr
- $507 – $1,088
Fire risk 3/10 · Minor
- Est. fire insurance / yr
- $916 – $1,700
Heat risk 7/10 · Major
- Hot days now (above 108°F)
- 7 days/yr
- Hot days in 30 yrs
- 19 days/yr
Wind risk 8/10 · Major
- Chance of severe wind over 30 yrs
- 80.0%
Air-quality risk 1/10 · Minimal
- Unhealthy air days now
- 0 days/yr
- Unhealthy air days in 30 yrs
- 0 days/yr
Risk factors via First Street. Map © Google.
Why this score? — see what drove the C- grade
The composite is a weighted blend of 9 inputs, each scored 0–100. Each bar is that input's sub-score; the figure is the points it added to the 100-point composite (weight × sub-score).
- Cash flow +25.9/30.0
- DSCR +8.7/10.0
- ARV discount +6.1/15.0
- 1% rule +5.5/10.0
- Rent growth +2.5/5.0
- Livability +2.5/5.0
- Condition / age +2.5/5.0
- Schools +1.0/10.0
- Appreciation +0.0/10.0
$115,000
🖨 Deal sheet 📄 Offer letter ✓ Due diligence
Listing remarks
Step into this beautiful, move-in ready 4-bedroom, 2-bath home featuring recent renovations, modern updates, and plenty of space for comfortable living that is ready for its new owners!
Key facts
- 0.66 acre lot
- 2 parking spots
- Built 1982
Property features AI
Exterior
- Parking: Attached carport; 2-car carport
- Utilities: Electricity available; Natural gas available; Public water; Public sewer
- Home design: Single-story; Masonite exterior; Slab foundation; Located outside city limits; Level topography
- Construction: Masonite construction; Slab foundation; Built (year source: public records)
- Exterior features: Partial fencing; Porch; Patio; Fence
Interior
- Kitchen: Gas range
- Bedrooms: Bedroom on the fourth level
- Flooring: Laminate
- Bathrooms: 2 full bathrooms
- Heating & cooling: Central heating (electric); Central air conditioning (electric)
- Interior features: Laminate flooring; Electric water heater; Gas range
- Laundry & utility: Washer hookup
Neighborhood map
What this means for you Summary
Snapshot
- This is a 4-bed/1.0-bath single-family listed at $115k.
Deal economics
- At list price, monthly cash flow is $281 ($3k/yr) — positive.
- The deal already cash-flows at list — no discount required.
- Meets the 1% rule at list price ($1k rent vs $115k).
- Recommended offer: $112k (3.0% below list) — sets the bar for market timing.
Location & tenants
- Location reads: area grade C — affects rentability + tenant quality, not the cash-flow math above.
- Dallas County (rural): math 2% / reading 22% proficiency, ranked #115 of 129 in AL (top 89%) — low school quality limits family demand, transient renter base, plan for 1-2y turnover; 79% free/reduced lunch — lower-income household profile, screen leases tightly.
- Market conditions: 104 active listings in the ZIP; 7 units permitted in Dallas County in 2024 (0 in 5+ unit buildings).
Forward outlook
- Local home prices are declining (-3.0%/yr); year-one equity from $795 of loan paydown is wiped out by about $3k of value loss. Plan a longer hold.
- Dallas County population projected at -36% by 2050 — secular population decline; favor cash flow + early exit over multi-decade hold.
Negotiation context
- It's been on market 50 days — a 3% lower offer ($112k) is reasonable based on typical stale-listing flexibility.
Risks & watch-outs
- Climate carrying-cost: severe wind risk, 80% chance of damaging wind over 30y; extreme-heat days projected 7→19/yr by 2055 (HVAC capex compounding) — expect insurance premiums to compound above CPI over the hold.
Questions for the listing agent
- It's been on market 50 days. Have you received any prior offers? Is the seller open to a 3% concession, seller financing, or rate buy-down credit?
- Is there a deadline driving the sale (1031 exchange, divorce, estate, relocation)? That informs how much negotiation room exists.
- What's the average days-on-market for RENTAL listings here right now (not sales)? A rising rental-DOM trend means longer vacancies and softer asking-rent achievability than the comps imply.
- What's the recent tenant-quality profile in this submarket — average credit score on applications, eviction rate, late-payment / NSF rate, and stable-employment percentage? A property-management company in the area should have these aggregated.
- How much new for-sale + rental construction is in the pipeline within 1–3 miles? Heavy new supply typically softens prices + rents 12–24 months out; constrained supply supports both.
Investment metrics
- 1% rule
- 1.05% ✓
- Cap rate
- 9.23%
- Cash-on-cash
- 10.48%
- DSCR
- 1.47
- GRM
- 7.9
CMA / ARV
- ARV (median comp)
- $111,551
- List price
- $115,000
- Delta
- 3.09%
- Verdict
- FAIR
- Comps
- 2 within 1.0 mi
Projected returns pro-forma
-3.0% appreciation · 3.0% rent growth · sell at horizon
- IRR
- -0.6%
- Equity multiple
- 0.98×
- Total profit
- $-780
- Equity at exit
- $17,147
- IRR
- 9.0%
- Equity multiple
- 1.69×
- Total profit
- $22,162
- Equity at exit
- $9,943
Cash invested: $32,200 (down + closing). Projections, not guarantees.
Landlord ↔ Tenant lean methodology
- Overall (STATE)
- 90 Strongly Landlord-Friendly
- State Alabama
- 90 Strongly Landlord-Friendly · R+15
- County
- — inherits STATE
- City
- — inherits STATE
ZIP-level market 36701
- Home prices YoY
- -6.3%
- Active inventory
- 104
- Price-to-rent
- 7.9×
Monthly cashflow live
- Estimated rent
- $1,213 medium interval (Pro) →
- Mortgage (P&I)
- −$603
- Tax from tax record
- −$26 /mo · $314/yr
- Insurance
- −$48
- HOA
- −$0
- Vacancy / Maint / Mgmt
- −$255
- Net cashflow
- $281
Break-even live
UW: 25.0% down · 7.5% · 30yr · 1.5% tax · 5.0% vac · 8.0% maint · 8.0% mgmt
Financing live
Cash to close
- Down payment
- $28,750
- Closing costs
- $3,450
- Reserves months
- —
- Total cash needed
- —
Loan-product check · same deal, 3 products live
Conventional
25% down · 7.5% · 30yr
- Down + closing
- —
- Monthly P&I
- —
- Monthly cashflow
- —
- DSCR
- —
- Eligible?
- —
Personal DTI + credit; lowest rate.
DSCR
20% down · 8.5% · 30yr
- Down + closing
- —
- Monthly P&I
- —
- Monthly cashflow
- —
- DSCR
- —
- Eligible?
- —
No personal income docs; deal must DSCR.
Hard money
10% down · 12.0% · 12mo
- Down + closing
- —
- Monthly P&I
- —
- Monthly cashflow
- —
- DSCR
- —
- Eligible?
- —
Short-term bridge; refi at stabilization.
Listing history 17 events
-
2026-06-19days on market $115,000 Active 50 DOM
-
2026-06-18days on market $115,000 Active 49 DOM
-
2026-06-17days on market $115,000 Active 48 DOM
-
2026-06-16days on market $115,000 Active 47 DOM
-
2026-06-15days on market $115,000 Active 46 DOM
-
2026-06-14days on market $115,000 Active 44 DOM
-
2026-06-12days on market $115,000 Active 43 DOM
-
2026-06-09days on market $115,000 Active 40 DOM
-
2026-06-08days on market $115,000 Active 39 DOM
-
2026-06-07days on market $115,000 Active 38 DOM
-
2026-06-07days on market $115,000 Active 37 DOM
-
2026-06-04days on market $115,000 Active 34 DOM
-
2026-06-02days on market $115,000 Active 33 DOM
-
2026-06-01days on market $115,000 Active 32 DOM
-
2026-05-31days on market $115,000 Active 31 DOM
-
2026-05-31days on market $115,000 Active 30 DOM
-
2026-04-29$115,000 Active 185-char remark
ⓘ Source: listings_history table (triggers on properties + properties_extension) + one-shot
backfill from property_details.listing_events for pre-trigger history.
Tax reassessment forecast AL · Resets to sale price
- Current annual tax
- $314 · $26/mo
- Projected year-2 tax
- $472 · $39/mo
- Expected delta
- +$157/yr (+$13/mo · 50.1%)
ⓘ Screening estimate from a state-policy table — verify with the county assessor before closing.
Climate risk First Street
- Flood 1/10 Low FEMA zone X (unshaded) · 0% chance over 30 yrs
- Wildfire 3/10 Moderate
- Heat 7/10 Severe 7 d/yr ≥108°F today · 19 d/yr by 30 yrs out
- Wind 8/10 Severe 80% chance of damaging wind over 30 yrs
- Air quality 1/10 Low 0 unhealthy d/yr today · 0 by 30 yrs out
Nearby sold comps map
Loading sold comps map…
Walkable amenities ~0.75 mi
Loading nearby amenities…
Taxation est. · year 1
- Rental income
- $14,557
- − Mortgage interest
- −$6,442
- − Property taxes
- −$314
- − Insurance
- −$575
- − Repairs & maintenance
- −$1,165
- − Management
- −$1,165
- − Depreciation
- −$3,345
- Taxable income
- $1,552
- Est. tax owed @ 24.0%
- −$372
- After-tax cash flow
- $3,002/yr
For passive investors: Depreciation is non-cash, so a rental often shows a tax loss while cash-flowing — sheltering income. Rental losses are passive: they offset passive income freely, and up to $25,000/yr can offset ordinary (W-2) income if you actively participate and your MAGI is under $100k (phasing out to $0 by $150k); unused losses carry forward. On sale, claimed depreciation is recaptured at up to 25%, and gains may owe capital-gains tax (a 1031 exchange can defer both). Figures are a year-1 estimate at your 24.0% rate — not tax advice; consult a CPA.
Schools (NCES district)
- District
- Dallas County
- NCES district ID
- 0101110
- Math proficiency
- 2% ▼ -28.00%
- Reading proficiency
- 22% ▼ -7.00%
- Median HH income
- $32,660
- Composite
- 9.54/100
- National rank
- #9847
- State rank
- #115 of 129 in AL
Livability — Selmont-West Selmont
No livability data for this city. (Only ~50 U.S. cities are tracked.)
Census & demographics
- Population (ZIP)
- 22,358
Population outlook (Dallas County) Hauer SSP2
- Today (2025)
- 35,464 people
- By 2030
- 32,631 · -8.0%
- By 2040
- 27,246 · -23.2%
- By 2050
- 22,691 · -36.0%
- By 2075
- 14,867 · -58.1%
- By 2100
- 10,285 · -71.0%
Race, ethnicity, and origin ACS 2023
- Neighborhood character
- Predominantly Black (69%)
- Race & ethnicity
- Black 69% White 28% Hispanic / Latino 2%
- Common ancestry
- Serbian 1% Lithuanian 1% Slovak 1%
- Foreign-born
- 2% · Canada
- Languages at home
- 98% English-only · Spanish 1%
Political lean MEDSL · Dallas
- 2024 margin
- Solid D (+32.5) · D 65.9% · R 33.4%
- 2008→2024 swing
- -2.0pp toward R · 2008: 34.5pp · 2024: 32.5pp
- All cycles
- 2024: D+32.5 2020: D+37.5 2016: D+37.6 2012: D+39.7 2008: D+34.5
Not yet ingested
- Civics
- —
Market trends
- HPI YoY
- ▼ -11.98%
- Current HPI
- 176.6034
- Rent YoY
- —
- Metro
- —
- State GDP YoY
- ▲ 2.94%
- F500 in state
- 4
Industry mix (Fortune 500 HQ in AL)
| Industry | F500 HQs | Revenue |
|---|---|---|
| Financial Services | 1 | $8B |
|
||
| Healthcare | 1 | $5B |
|
||
Price history
1 event — show timeline
- 2026-04-29 Listed $115,000 MAAR
Property tax history
+4.9%/yrLatest (2023): $314 · +29.2% YoY. Source: county tax records.
Cash-flow waterfall
monthlySold comps — $/sqft
last 12 mo · ≤1 miLoading sold comps…