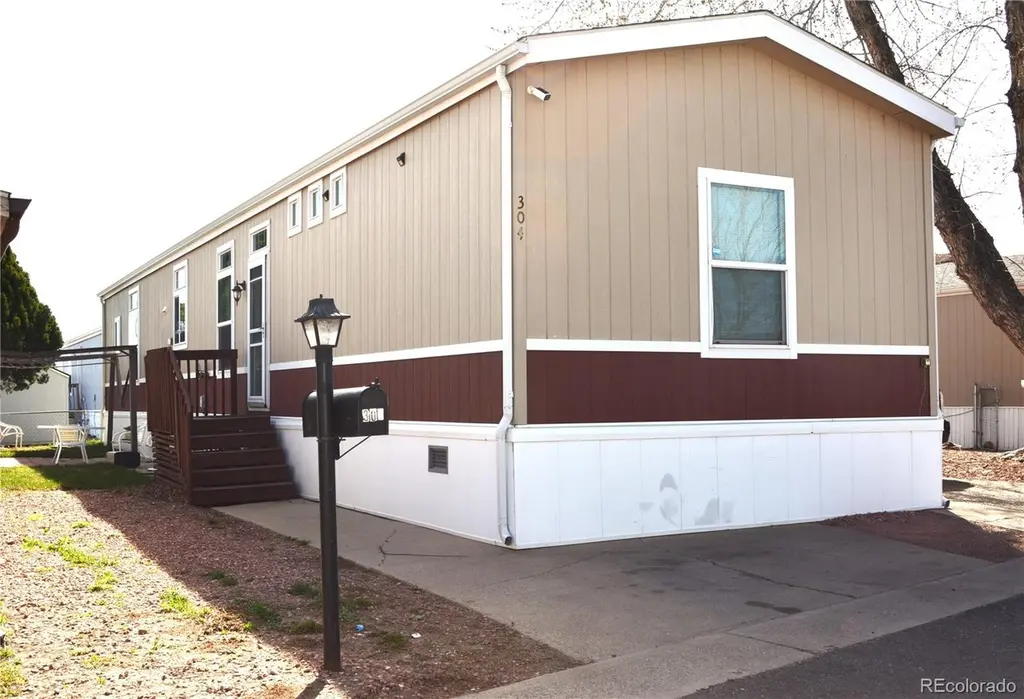
304 Barnard Ct · Longmont, CO
Flood risk 4/10 · Minor
- FEMA flood zone
- AE
- Chance of flooding over 30 yrs
- 0.22%
- Est. flood insurance / yr
- $1,737 – $8,500
Fire risk 2/10 · Minimal
- Est. fire insurance / yr
- $939 – $1,743
Heat risk 4/10 · Minor
- Hot days now (above 93°F)
- 7 days/yr
- Hot days in 30 yrs
- 19 days/yr
Wind risk 1/10 · Minimal
- Chance of severe wind over 30 yrs
- —
Air-quality risk 4/10 · Minor
- Unhealthy air days now
- 5 days/yr
- Unhealthy air days in 30 yrs
- 5 days/yr
Risk factors via First Street. Map © Google.
Why this score? — see what drove the B grade
The composite is a weighted blend of 9 inputs, each scored 0–100. Each bar is that input's sub-score; the figure is the points it added to the 100-point composite (weight × sub-score).
- Cash flow +30.0/30.0
- 1% rule +10.0/10.0
- DSCR +10.0/10.0
- ARV discount +7.9/15.0
- Livability +3.9/5.0
- Schools +3.8/10.0
- Condition / age +3.8/5.0
- Rent growth +2.7/5.0
- Appreciation +0.0/10.0
$105,000
🖨 Deal sheet (PDF) 📄 Offer letter ✓ Due diligence
Listing remarks
Charming 2015 manufactured home located in a well-maintained community on a leased lot. This 76x16 home offers comfortable single-level living with an open layout and functional floor plan. Great opportunity for affordable homeownership in Longmont! Conveniently located near shopping, dining, and major commuter routes. Buyer must be approved by the park prior to closing. Lot rent applies and covers community services (buyer to verify current amount and inclusions). Sold “ As is”! * Buyer must get approved by St Vrain Mobile Home Park.
Key facts
- Near dining
- Near shopping
- Open layout
Tags
Property features AI
Finance
- Financial info: Month-to-month lease term for land; Land lease amount $910.75 monthly; Land lease expires December 31, 2026
- HOA & community: Located in a senior community; Land lease in place (monthly land lease)
Exterior
- Parking: 3 off-street parking spaces (3 total parking spaces)
- Utilities: Public sewer
- Home design: Manufactured in park; Manufactured home; Individual ownership
- Construction: Vinyl siding
- Exterior features: Composition roof
Interior
- Kitchen: Oven; Self-cleaning oven; Microwave; Dishwasher; Refrigerator; Disposal
- Bedrooms: 3 bedrooms, all on the main level
- Bathrooms: 2 full bathrooms, both on the main level
- Heating & cooling: Forced air heating; Central air conditioning
- Interior features: Dishwasher; Disposal; Dryer; Microwave; Oven; Refrigerator; Self-cleaning oven; Washer
- Laundry & utility: Washer and Dryer included
Neighborhood map
What this means for you Summary
Snapshot
- This is a 3-bed/2.0-bath manufactured listed at $105k. Condition is rated good.
Deal economics
- At list price, monthly cash flow is $466 ($6k/yr) — positive.
- The deal already cash-flows at list — no discount required.
- Meets the 1% rule at list price ($2k rent vs $105k).
- Recommended offer: $99k (6.0% below list) — sets the bar for market timing.
- Cap rate 16.5% vs local median 2.6% in Longmont — top-decile yield for the area; either an underpriced asset or a hidden risk that comps aren't pricing in. Stress-test before assuming the spread holds.
Location & tenants
- Location reads 77/100 on livability (#24 in CO, #2,736 nationally) — a middle-class / working-renter tenant base. Strengths: amenities A+, employment A+, housing A+; Watch: crime F, cost of living F.
- St. Vrain Valley School District No. Re1J (suburban): math 32% / reading 51% proficiency, ranked #23 of 86 in CO (top 27%) — families likely to look elsewhere, expect single-tenant / working-renter base with shorter leases.
- Zoned schools: Central Elementary School (math 44% / reading 62%, grade C, #168 of 966 statewide, top 18%, 340 students, 26% FRL); Westview Middle School (math 36% / reading 52%, grade D, #63 of 270 statewide, top 23%, 652 students, 34% FRL); Longmont High School (math 30% / reading 58%, grade F, #149 of 381 statewide, top 39%, 1,262 students, 44% FRL).
- Market conditions: Rents flat; 174 active listings in the ZIP; 20 comparable units currently listed for rent nearby; rentals at typical pace (median 22d on market — plan ~3-4 weeks tenant-placement turnaround); solid renter incomes; 1,688 units permitted in Boulder County in 2024 (1,136 in 5+ unit buildings).
- This rent runs 30% of the median local income ($81k/yr) — at the standard rent-burdened threshold; future hikes will face affordability resistance.
Forward outlook
- Local home prices are declining (-3.0%/yr); year-one equity from $726 of loan paydown is wiped out by about $3k of value loss. Plan a longer hold.
- Boulder County population projected at +40% by 2050 — long-run rental-demand tailwind backs the buy-and-hold thesis.
- At projected returns (-3.0% appreciation + 0.6% rent growth), your $29k cash investment doubles in ~9 years — after that, you're playing with house money.
Negotiation context
- It's been on market 69 days — a 6% lower offer ($99k) is reasonable based on typical stale-listing flexibility.
- 2 sale attempts; this cycle's ask has dropped $20k (16%) from the opening price — seller is motivated, your offer sets the floor, not the list.
Risks & watch-outs
- Watch-outs: flood insurance adds $427/mo.
- Climate carrying-cost: in FEMA flood zone AE (mandatory federal flood insurance) — expect insurance premiums to compound above CPI over the hold.
Questions for the listing agent
- It's been on market 69 days. Have you received any prior offers? Is the seller open to a 6% concession, seller financing, or rate buy-down credit?
- What's the actual annual flood-insurance premium (NFIP or private), and is the property in a SFHA with mandatory coverage?
- Why hasn't it sold? Are there any deal-killer items the seller is aware of (foundation, flood, title, zoning, code violations)?
- Is there a deadline driving the sale (1031 exchange, divorce, estate, relocation)? That informs how much negotiation room exists.
- Crime grade is F in this area — have there been break-ins, vandalism, or insurance claims at this property in the last 3 years? What carrier currently insures it and at what premium?
- What's the average days-on-market for RENTAL listings here right now (not sales)? A rising rental-DOM trend means longer vacancies and softer asking-rent achievability than the comps imply.
- What's the recent tenant-quality profile in this submarket — average credit score on applications, eviction rate, late-payment / NSF rate, and stable-employment percentage? A property-management company in the area should have these aggregated.
- How much new for-sale + rental construction is in the pipeline within 1–3 miles? Heavy new supply typically softens prices + rents 12–24 months out; constrained supply supports both.
Investment metrics
- 1% rule
- 1.95% ✓
- Cap rate
- 16.49%
- Cash-on-cash
- 36.42%
- DSCR
- 2.62
- GRM
- 4.3
CMA / ARV
- ARV (on-the-fly)
- $105,984
- Comps found
- 2
Show comp detail 2 sales within ~0.75 mi
| Address | Dist | Beds/Ba | Sqft | Sold | Price | $/sf | Match |
|---|---|---|---|---|---|---|---|
| 307 Barnard Ct | 0.03mi | 3/2.0 | 1,088 (-6%) | 9mo | $100,000 | $92 | 82 |
| 323 Barnard Ct | 0.05mi | 3/2.0 | 1,088 (-6%) | 18mo | $81,000 | $74 | 73 |
Match score weights: distance 35% · size 25% · config 20% · recency 20%. Top-matched comps best support the ARV.
Projected returns pro-forma
-3.0% appreciation · 0.64% rent growth · sell at horizon
- IRR
- 7.4%
- Equity multiple
- 1.28×
- Total profit
- $8,188
- Equity at exit
- $15,656
- IRR
- 13.8%
- Equity multiple
- 1.95×
- Total profit
- $27,917
- Equity at exit
- $9,078
Cash invested: $29,400 (down + closing). Projections, not guarantees.
Landlord ↔ Tenant lean methodology
- Overall (STATE)
- 38 Tenant-Leaning
- State Colorado
- 38 Tenant-Leaning · D+4
- County
- — inherits STATE
- City
- — inherits STATE
ZIP-level market 80501
- Rents YoY
- 0.6%
- Active inventory
- 174
- Price-to-rent
- 4.3×
Monthly cashflow live
- Estimated rent
- $2,048 high interval (Pro) →
- Mortgage (P&I)
- −$551
- Tax est. 1.5%
- −$131 /mo · $1,575/yr
- Insurance
- −$44
- Flood insurance flood zone
- −$427 /mo · $5,118/yr
- HOA
- −$0
- Vacancy / Maint / Mgmt
- −$430
- Net cashflow
- $466
Break-even live
Sensitivity live
| Price | -10% $538 | -5% $502 | +0% $466 | +5% $429 | +10% $393 |
|---|---|---|---|---|---|
| Rent | -10% $304 | -5% $385 | +0% $466 | +5% $547 | +10% $627 |
| Rate | -1.0pp $519 | -0.5pp $492 | base $466 | +0.5pp $438 | +1.0pp $411 |
UW: 25.0% down · 7.5% · 30yr · 1.5% tax · 5.0% vac · 8.0% maint · 8.0% mgmt
Financing live
Cash to close
- Down payment
- $26,250
- Closing costs
- $3,150
- Reserves months
- —
- Total cash needed
- —
Loan-product check · same deal, 3 products live
Conventional
25% down · 7.5% · 30yr
- Down + closing
- —
- Monthly P&I
- —
- Monthly cashflow
- —
- DSCR
- —
- Eligible?
- —
Personal DTI + credit; lowest rate.
DSCR
20% down · 8.5% · 30yr
- Down + closing
- —
- Monthly P&I
- —
- Monthly cashflow
- —
- DSCR
- —
- Eligible?
- —
No personal income docs; deal must DSCR.
Hard money
10% down · 12.0% · 12mo
- Down + closing
- —
- Monthly P&I
- —
- Monthly cashflow
- —
- DSCR
- —
- Eligible?
- —
Short-term bridge; refi at stabilization.
Rent comps 20 comps
| Address | Beds | Baths | Sqft | Rent | $/sqft | DOM | Units | Dist |
|---|---|---|---|---|---|---|---|---|
| 104 Judson St Longmont, CO | 2.0 | 1.0 | 810 | $1,650 | $2.04 | 21d | 1 | 0.45mi |
| 221 Gay St Unit C Longmont, CO | 2.0 | 2.0 | 700 | $1,495 | $2.14 | 21d | 1 | 0.53mi |
| 808 Delaware Ave Unit D Longmont, CO | 2.0 | 1.0 | 700 | $1,300 | $1.86 | 21d | 1 | 0.55mi |
| 732 Delaware Ave Unit A Longmont, CO | 2.0 | 1.0 | 875 | $1,600 | $1.83 | 21d | 1 | 0.58mi |
| 720 Fairlane Ave Longmont, CO | 2.0 | 1.0 | 828 | $1,775 | $2.14 | 21d | 3 | 0.60mi |
| 485 2nd Ave Longmont, CO | 2.0 | 1.0–2.0 | 858 | $2,420 | $2.82 | 21d | 45 | 0.83mi |
| 210 Emery St Longmont, CO | 2.0–3.0 | 2.5 | 1492 | $2,975 | $1.99 | 14d | 3 | 0.94mi |
| 815 6th Ave Unit 1 Longmont, CO | 2.0 | 2.0 | 1000 | $1,675 | $1.68 | 21d | 1 | 0.97mi |
| 525 Dry Creek Dr Longmont, CO | 1.0–3.0 | 1.0–2.0 | 947 | $2,766 | $2.92 | 14d | 89 | 1.10mi |
| 1403 Lefthand Dr Longmont, CO | 2.0 | 1.0 | 810 | $1,645 | $2.03 | 14d | 1 | 1.13mi |
| 2430 Mountain Brook Dr Longmont, CO | 1.0–3.0 | 1.0–2.0 | 1029 | $3,005 | $2.92 | 14d | 56 | 1.19mi |
| 2735 Mountain Brook Dr Longmont, CO | 3.0 | 1.0–3.0 | 945 | $3,345 | $3.54 | 14d | 175 | 1.20mi |
| 1353 S Coffman St Longmont, CO | 2.0 | 1.0 | 804 | $1,925 | $2.39 | 14d | 1 | 1.20mi |
| 1344 S Coffman St Longmont, CO | 2.0 | 1.0 | 750 | $1,295 | $1.73 | 14d | 1 | 1.20mi |
| 1328 S Coffman St Unit 1 Longmont, CO | 3.0 | 1.0 | 966 | $1,745 | $1.81 | 21d | 1 | 1.21mi |
| 1328 S Coffman St Longmont, CO | 3.0 | 1.0 | 966 | $1,795 | $1.86 | 14d | 2 | 1.21mi |
| 1530 9th Ave Longmont, CO | 1.0–2.0 | 1.0 | 870 | $1,600 | $1.84 | 14d | 4 | 1.21mi |
| 911 Tulip St Longmont, CO | 2.0 | 2.0 | 1196 | $1,895 | $1.58 | 21d | 1 | 1.28mi |
| 946 Pratt St Unit B Longmont, CO | 2.0 | 1.0 | 791 | $1,800 | $2.28 | 21d | 1 | 1.37mi |
| 100 E 2nd Ave Longmont, CO | 3.0 | 1.0–2.0 | 965 | $3,325 | $3.44 | 14d | 93 | 1.39mi |
Listing history 18 events
-
2026-06-18days on market $105,000 Active 69 DOM
-
2026-06-17price $105,000 Active 68 DOM
-
2026-06-17days on market $115,000 Active 68 DOM
-
2026-06-16days on market $115,000 Active 67 DOM
-
2026-06-15days on market $115,000 Active 66 DOM
-
2026-06-14days on market $115,000 Active 64 DOM
-
2026-06-13days on market $115,000 Active 63 DOM
-
2026-06-09days on market $115,000 Active 60 DOM
-
2026-06-09days on market $115,000 Active 59 DOM
-
2026-06-07days on market $115,000 Active 58 DOM
-
2026-06-02days on market $115,000 Active 53 DOM
-
2026-06-01days on market $115,000 Active 52 DOM
-
2026-05-31days on market $115,000 Active 51 DOM
-
2026-05-30pricedays on market $115,000 Active 50 DOM
-
2026-05-13price $120,000
-
2026-04-27status Active
-
2026-04-11status Pending Accepting Backup Offers
-
2026-03-25$125,000 Active
ⓘ Source: listings_history table (triggers on properties + properties_extension) + one-shot
backfill from property_details.listing_events for pre-trigger history.
Climate risk First Street
- Flood 4/10 Moderate FEMA zone AE · 22% chance over 30 yrs
- Wildfire 2/10 Low
- Heat 4/10 Moderate 7 d/yr ≥93°F today · 19 d/yr by 30 yrs out
- Wind 1/10 Low
- Air quality 4/10 Moderate 5 unhealthy d/yr today · 5 by 30 yrs out
Nearby sold comps map
Loading sold comps map…
Walkable amenities ~0.75 mi
Loading nearby amenities…
Taxation est. · year 1
- Rental income
- $24,575
- − Mortgage interest
- −$5,882
- − Property taxes
- −$1,575
- − Insurance
- −$5,644
- − Repairs & maintenance
- −$1,966
- − Management
- −$1,966
- − Depreciation
- −$3,055
- Taxable income
- $4,488
- Est. tax owed @ 24.0%
- −$1,077
- After-tax cash flow
- $4,511/yr
For passive investors: Depreciation is non-cash, so a rental often shows a tax loss while cash-flowing — sheltering income. Rental losses are passive: they offset passive income freely, and up to $25,000/yr can offset ordinary (W-2) income if you actively participate and your MAGI is under $100k (phasing out to $0 by $150k); unused losses carry forward. On sale, claimed depreciation is recaptured at up to 25%, and gains may owe capital-gains tax (a 1031 exchange can defer both). Figures are a year-1 estimate at your 24.0% rate — not tax advice; consult a CPA.
Condition & rehab AI · 13 photos
This 2015 manufactured home in a well-maintained community is in good condition with minor repairs needed. It offers a good balance of updates and maintenance, making it a solid investment.
Repairs flagged
- Minor Paint touch-ups — Paint appears fresh, but touch-ups may be needed for minor imperfections
- Minor Landscaping — Could benefit from additional greenery to enhance curb appeal
Value-add opportunities
- Resale Paint touch-ups — Fresh paint enhances the home's appearance and can increase its resale value
- Rental Landscaping — Enhanced landscaping can attract more renters and increase rental value
Renovation cost estimate screening
| Repair item | Severity | Est. cost |
|---|---|---|
| Paint touch-ups · Paint appears fresh, but touch-ups may be needed for minor imperfections | Minor | $500–3,000 |
| Landscaping · Could benefit from additional greenery to enhance curb appeal | Minor | $500–3,000 |
| Total estimated repair cost · 2 items | $1,000–6,000 |
Value-add ROI direction
- Resale Paint touch-ups — Fresh paint enhances the home's appearance and can increase its resale value ↑
- Rental Landscaping — Enhanced landscaping can attract more renters and increase rental value ↑
ⓘ Cost ranges are severity-bucket heuristics (US national rule-of-thumb). Get contractor quotes + a written scope before underwriting a rehab budget.
Schools (NCES district)
- District
- St. Vrain Valley School District No. Re1J
- NCES district ID
- 0805370
- Math proficiency
- 32% ▼ -8.00%
- Reading proficiency
- 51% ▬ 0.00%
- Median HH income
- $71,571
- Composite
- 37.73/100
- National rank
- #4353
- State rank
- #23 of 86 in CO
Livability — Longmont
- Score
- 77/100
- State rank
- #24
- US rank
- #2736
Category grades
Schools grade is shown separately in the Schools card above.
Census & demographics
- Census place
- Longmont, CO
- County
- Boulder County · 271,666 people
- City population
- 143,444
- Metro
- Boulder, CO
- Population (ZIP)
- 44,147
- Household income
- $80,911
- Rent vs Own
- Severe rent burden
- 1958.0
Population outlook (Boulder County) Hauer SSP2
- Today (2025)
- 380,833 people
- By 2030
- 412,028 · +8.2%
- By 2040
- 472,764 · +24.1%
- By 2050
- 532,029 · +39.7%
- By 2075
- 679,723 · +78.5%
- By 2100
- 766,278 · +101.2%
Race, ethnicity, and origin ACS 2023
- Neighborhood character
- Majority White (62%)
- Race & ethnicity
- White 62% Hispanic / Latino 31% Two or more races 16% Asian 1% Black 1%
- Hispanic origin (detail)
- Mexican 25%
- Common ancestry
- Romanian 3% Lithuanian 2% Slovak 2%
- Foreign-born
- 12% · Canada, Jamaica
- Languages at home
- 77% English-only · Spanish 19% Other Indo-European 1% Russian/Polish/Slavic 1%
Political lean MEDSL · Boulder
- 2024 margin
- Solid D (+55.8) · D 76.5% · R 20.8% · Other 2.7%
- 2008→2024 swing
- +9.6pp toward D · 2008: 46.1pp · 2024: 55.8pp
- All cycles
- 2024: D+55.8 2020: D+56.6 2016: D+48.6 2012: D+41.5 2008: D+46.1
Not yet ingested
- Civics
- —
Market trends
- HPI YoY
- ▼ -567.24%
- Current HPI
- 268.454
- Rent YoY
- ▲ 0.64%
- Metro
- Boulder, CO
- State GDP YoY
- ▲ 1.95%
- F500 in state
- 14
Industry mix (Fortune 500 HQ in CO)
| Industry | F500 HQs | Revenue |
|---|---|---|
| Technology Distribution | 1 | $31B |
|
||
| Food / Agriculture | 1 | $18B |
|
||
| Packaging | 1 | $14B |
|
||
| Healthcare | 1 | $13B |
|
||
| Energy | 1 | $10B |
|
||
| Technology | 1 | $4B |
|
||
Price history
-4.0% since first listed4 events — show timeline
- 2026-05-13 Price Changed $120,000 REColorado as Distributed by MLS Grid
- 2026-04-27 Relisted — REColorado as Distributed by MLS Grid
- 2026-04-11 Pending — REColorado as Distributed by MLS Grid
- 2026-03-25 Listed $125,000 REColorado as Distributed by MLS Grid
Cash-flow waterfall
monthlySold comps — $/sqft
last 12 mo · ≤1 miLoading sold comps…