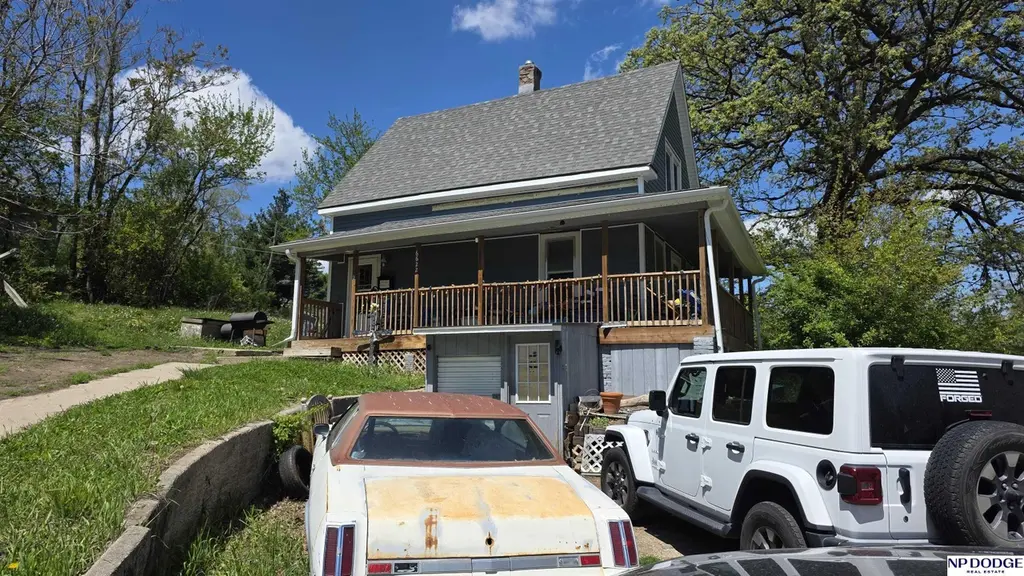
6622 N 36th St · Omaha, NE
Flood risk 1/10 · Minimal
- FEMA flood zone
- X (unshaded)
- Chance of flooding over 30 yrs
- 0.0%
- Est. flood insurance / yr
- $473 – $860
Fire risk 1/10 · Minimal
- Est. fire insurance / yr
- $1,161 – $2,155
Heat risk 3/10 · Minor
- Hot days now (above 104°F)
- 7 days/yr
- Hot days in 30 yrs
- 15 days/yr
Wind risk 2/10 · Minimal
- Chance of severe wind over 30 yrs
- —
Air-quality risk 2/10 · Minimal
- Unhealthy air days now
- 0 days/yr
- Unhealthy air days in 30 yrs
- 1 days/yr
Risk factors via First Street. Map © Google.
Why this score? — see what drove the B- grade
The composite is a weighted blend of 9 inputs, each scored 0–100. Each bar is that input's sub-score; the figure is the points it added to the 100-point composite (weight × sub-score).
- Cash flow +29.9/30.0
- DSCR +10.0/10.0
- 1% rule +8.7/10.0
- ARV discount +7.5/15.0
- Livability +4.2/5.0
- Rent growth +2.5/5.0
- Condition / age +2.5/5.0
- Schools +2.1/10.0
- Appreciation +0.0/10.0
$110,000
🖨 Deal sheet 📄 Offer letter ✓ Due diligence
Listing remarks MLS
Own this home for much less than rent & investors can cash flow right away with this move in ready home. Electric panel has been updated from fuses to breakers. The tile floors in both the kitchen & bath are a plus & the rest has new carpet & paint. There's a built on storage shed for you lawn mower & plenty of storage in this walkout basement.
Key facts
- 0.27 acre lot
- Built 1910
- Listed 20 days
Property features AI
Exterior
- Parking: No garage
- Utilities: Public water; Public sewer; Electricity available; Natural gas available
- Home design: Single-family residence; One-and-a-half story; Not new (built in 1910)
- Construction: Vinyl siding; Composition roof; Brick/mortar foundation; Original construction year 1910
- Exterior features: Porch; Corner city lot, approximately 0.27 acres (approx. 110 x 107)
Interior
- Kitchen: Range; Refrigerator
- Bedrooms: Master bedroom on the 2nd floor with luxury vinyl plank flooring (approx. 13 x 9.6); Second bedroom on the 2nd floor with luxury vinyl plank flooring (approx. 11.9 x 9.6); Third bedroom on the 2nd floor with luxury vinyl plank flooring (approx. 9.7 x 9.5)
- Flooring: Luxury vinyl plank
- Bathrooms: One full bathroom (main level)
- Heating & cooling: Natural gas forced-air heating; Central air conditioning
- Interior features: Luxury vinyl plank flooring throughout main living areas; No fireplaces
Neighborhood map
What this means for you Summary
Snapshot
- This is a 3-bed/1.0-bath other listed at $110k.
Deal economics
- At list price, monthly cash flow is $407 ($5k/yr) — positive.
- The deal already cash-flows at list — no discount required.
- Meets the 1% rule at list price ($2k rent vs $110k).
- Recommended offer: $108k (1.5% below list) — sets the bar for market timing.
- Cap rate 10.7% vs local median 3.6% in Omaha — top-decile yield for the area; either an underpriced asset or a hidden risk that comps aren't pricing in. Stress-test before assuming the spread holds.
Location & tenants
- Location reads 84/100 on livability (#7 in NE, #663 nationally) — a professional / high-income tenant draw. Strengths: amenities A+, commute A+, cost of living A+; Watch: crime F.
- Omaha Public Schools (urban): math 20% / reading 28% proficiency, ranked #110 of 111 in NE (top 99%) — low school quality limits family demand, transient renter base, plan for 1-2y turnover; 62% free/reduced lunch — lower-income household profile, screen leases tightly.
- Zoned schools: Belvedere Elementary School (math 2% / reading 12%, grade F, #497 of 502 statewide, top 99%, 366 students, 0% FRL); North High School (math 21% / reading 25%, grade F, #247 of 261 statewide, top 95%, 1,796 students, 0% FRL) — zoned schools average 0% FRL vs 62% district-wide (62 pts lower); this property's tenant base skews higher-income than the district average.
- Market conditions: 57 active listings in the ZIP; 12 comparable units currently listed for rent nearby; rentals at typical pace (median 24d on market — plan ~3-4 weeks tenant-placement turnaround); 4,539 units permitted in Douglas County in 2024 (2,583 in 5+ unit buildings).
- This rent runs 32% of the median local income ($56k/yr) — at the standard rent-burdened threshold; future hikes will face affordability resistance.
Forward outlook
- Local home prices are declining (-3.0%/yr); year-one equity from $761 of loan paydown is wiped out by about $3k of value loss. Plan a longer hold.
- Douglas County population projected at +28% by 2050 — long-run rental-demand tailwind backs the buy-and-hold thesis.
- At projected returns (-3.0% appreciation + 3.0% rent growth), your $31k cash investment doubles in ~8 years — after that, you're playing with house money.
Negotiation context
- It's been on market 20 days — a 2% lower offer ($108k) is reasonable based on typical stale-listing flexibility.
- 7 sale attempts since 19y ago with the ask held roughly flat each time — persistent listings suggest the price (not the market) is what's stuck; bring a comps-based counter.
- Current owner paid $27k; list at $110k implies a 307% gain — meaningful room to come down on a strong offer.
Risks & watch-outs
- Watch-outs: built in 1910 — expect roof / HVAC / electrical / plumbing capex.
Questions for the listing agent
- Built in 1910 — when were the roof, HVAC, electrical panel, plumbing, and water heater last replaced?
- Is there a deadline driving the sale (1031 exchange, divorce, estate, relocation)? That informs how much negotiation room exists.
- Crime grade is F in this area — have there been break-ins, vandalism, or insurance claims at this property in the last 3 years? What carrier currently insures it and at what premium?
- What's the average days-on-market for RENTAL listings here right now (not sales)? A rising rental-DOM trend means longer vacancies and softer asking-rent achievability than the comps imply.
- What's the recent tenant-quality profile in this submarket — average credit score on applications, eviction rate, late-payment / NSF rate, and stable-employment percentage? A property-management company in the area should have these aggregated.
- How much new for-sale + rental construction is in the pipeline within 1–3 miles? Heavy new supply typically softens prices + rents 12–24 months out; constrained supply supports both.
Investment metrics
- 1% rule
- 1.37% ✓
- Cap rate
- 10.73%
- Cash-on-cash
- 15.84%
- DSCR
- 1.70
- GRM
- 6.1
CMA / ARV
No comps found within radius.
Projected returns pro-forma
-3.0% appreciation · 3.0% rent growth · sell at horizon
- IRR
- 6.8%
- Equity multiple
- 1.26×
- Total profit
- $8,113
- Equity at exit
- $16,401
- IRR
- 16.1%
- Equity multiple
- 2.32×
- Total profit
- $40,575
- Equity at exit
- $9,511
Cash invested: $30,800 (down + closing). Projections, not guarantees.
Landlord ↔ Tenant lean methodology
- Overall (STATE)
- 83 Strongly Landlord-Friendly
- State Nebraska
- 83 Strongly Landlord-Friendly · R+13
- County
- — inherits STATE
- City
- — inherits STATE
ZIP-level market 68112
- Home prices YoY
- -29.4%
- Active inventory
- 57
- Price-to-rent
- 6.1×
Monthly cashflow live
- Estimated rent
- $1,512 high interval (Pro) →
- Mortgage (P&I)
- −$577
- Tax from tax record
- −$165 /mo · $1,985/yr
- Insurance
- −$46
- HOA
- −$0
- Vacancy / Maint / Mgmt
- −$318
- Net cashflow
- $407
Break-even live
UW: 25.0% down · 7.5% · 30yr · 1.5% tax · 5.0% vac · 8.0% maint · 8.0% mgmt
Financing live
Cash to close
- Down payment
- $27,500
- Closing costs
- $3,300
- Reserves months
- —
- Total cash needed
- —
Loan-product check · same deal, 3 products live
Conventional
25% down · 7.5% · 30yr
- Down + closing
- —
- Monthly P&I
- —
- Monthly cashflow
- —
- DSCR
- —
- Eligible?
- —
Personal DTI + credit; lowest rate.
DSCR
20% down · 8.5% · 30yr
- Down + closing
- —
- Monthly P&I
- —
- Monthly cashflow
- —
- DSCR
- —
- Eligible?
- —
No personal income docs; deal must DSCR.
Hard money
10% down · 12.0% · 12mo
- Down + closing
- —
- Monthly P&I
- —
- Monthly cashflow
- —
- DSCR
- —
- Eligible?
- —
Short-term bridge; refi at stabilization.
Rent comps 12 comps
| Address | Beds | Baths | Sqft | Rent | $/sqft | DOM | Units | Dist |
|---|---|---|---|---|---|---|---|---|
| 3164 Ida St Omaha, NE | 3.0 | 1.0 | 946 | $1,600 | $1.69 | 43d | 1 | 0.35mi |
| 3164 Ida St Omaha, NE | 3.0 | 1.0 | 946 | $1,600 | $1.69 | 10d | 1 | 0.35mi |
| 3164 Ida St Omaha, NE | 3.0 | 1.0 | 946 | $1,600 | $1.69 | 1d | 1 | 0.35mi |
| 4018 Bauman Ave Omaha, NE | 3.0 | 1.0 | 925 | $1,380 | $1.49 | 43d | 1 | 0.42mi |
| 3138 Weber Cir Omaha, NE | 2.0 | 1.0 | 750 | $1,200 | $1.60 | 43d | 1 | 0.58mi |
| 3941 Himebaugh Ave Omaha, NE | 2.0 | 1.0 | 720 | $1,350 | $1.88 | 23d | 1 | 0.65mi |
| 2873 Kansas Ave Omaha, NE | 3.0 | 2.0 | 1112 | $1,450 | $1.30 | 23d | 1 | 0.67mi |
| 2723 Newport Ave Omaha, NE | 2.0 | 1.0 | 1079 | $1,450 | $1.34 | 1d | 1 | 0.69mi |
| 5922 N 28th Ave Omaha, NE | 2.0 | 1.0 | 764 | $950 | $1.24 | 2d | 1 | 0.75mi |
| 4460 Redman Ave Omaha, NE | 3.0 | 1.0 | 750 | $950 | $1.27 | 43d | 1 | 0.94mi |
| 4470 Redman Ave Unit 4470A Omaha, NE | 2.0 | 1.5 | 980 | $1,050 | $1.07 | 10d | 1 | 0.97mi |
| 6327 N 51st Ave Omaha, NE | 3.0 | 1.0 | 860 | $1,450 | $1.69 | 23d | 1 | 1.44mi |
Listing history 13 events
-
2026-06-18days on market $110,000 Active 20 DOM
-
2026-06-17days on market $110,000 Active 19 DOM
-
2026-06-16days on market $110,000 Active 18 DOM
-
2026-06-15days on market $110,000 Active 17 DOM
-
2026-06-13days on market $110,000 Active 15 DOM
-
2026-06-10days on market $110,000 Active 12 DOM
-
2026-06-09days on market $110,000 Active 11 DOM
-
2026-06-08days on market $110,000 Active 10 DOM
-
2026-06-07days on market $110,000 Active 9 DOM
-
2026-06-03statusdays on market $110,000 Active 5 DOM
-
2026-06-03days on market $110,000 New 4 DOM
-
2026-06-01days on market $110,000 New 3 DOM
-
2026-06-01days on market $110,000 New 2 DOM
ⓘ Source: listings_history table (triggers on properties + properties_extension) + one-shot
backfill from property_details.listing_events for pre-trigger history.
Tax reassessment forecast NE · Resets to sale price
- Current annual tax
- $1,985 · $165/mo
- Projected year-2 tax
- $1,985 · $165/mo
- Expected delta
- $0/yr ($0/mo · 0.0%)
ⓘ Screening estimate from a state-policy table — verify with the county assessor before closing.
Climate risk First Street
- Flood 1/10 Low FEMA zone X (unshaded) · 0% chance over 30 yrs
- Wildfire 1/10 Low
- Heat 3/10 Moderate 7 d/yr ≥104°F today · 15 d/yr by 30 yrs out
- Wind 2/10 Low
- Air quality 2/10 Low 0 unhealthy d/yr today · 1 by 30 yrs out
Nearby sold comps map
Loading sold comps map…
Walkable amenities ~0.75 mi
Loading nearby amenities…
Taxation est. · year 1
- Rental income
- $18,147
- − Mortgage interest
- −$6,162
- − Property taxes
- −$1,985
- − Insurance
- −$550
- − Repairs & maintenance
- −$1,452
- − Management
- −$1,452
- − Depreciation
- −$3,200
- Taxable income
- $3,347
- Est. tax owed @ 24.0%
- −$803
- After-tax cash flow
- $4,076/yr
For passive investors: Depreciation is non-cash, so a rental often shows a tax loss while cash-flowing — sheltering income. Rental losses are passive: they offset passive income freely, and up to $25,000/yr can offset ordinary (W-2) income if you actively participate and your MAGI is under $100k (phasing out to $0 by $150k); unused losses carry forward. On sale, claimed depreciation is recaptured at up to 25%, and gains may owe capital-gains tax (a 1031 exchange can defer both). Figures are a year-1 estimate at your 24.0% rate — not tax advice; consult a CPA.
Schools (NCES district)
- District
- Omaha Public Schools
- NCES district ID
- 3174820
- Math proficiency
- 20% ▼ -10.00%
- Reading proficiency
- 28% ▼ -5.00%
- Median HH income
- $46,039
- Composite
- 20.83/100
- National rank
- #8502
- State rank
- #110 of 111 in NE
Livability — Omaha
- Score
- 84/100
- State rank
- #7
- US rank
- #663
Category grades
Schools grade is shown separately in the Schools card above.
Census & demographics
- Census place
- Omaha, NE
- County
- Douglas County · 538,646 people
- City population
- 552,986
- Metro
- Omaha-Council Bluffs, NE-IA
- Population (ZIP)
- 12,071
- Household income
- $56,159
- Rent vs Own
- Severe rent burden
- 385.0
Population outlook (Douglas County) Hauer SSP2
- Today (2025)
- 625,245 people
- By 2030
- 661,613 · +5.8%
- By 2040
- 732,395 · +17.1%
- By 2050
- 801,988 · +28.3%
- By 2075
- 968,637 · +54.9%
- By 2100
- 1,101,871 · +76.2%
Race, ethnicity, and origin ACS 2023
- Neighborhood character
- Diverse neighborhood (Simpson 0.59)
- Race & ethnicity
- White 59% Black 23% Two or more races 11% Hispanic / Latino 11%
- Hispanic origin (detail)
- Mexican 9%
- Common ancestry
- Romanian 5% Lithuanian 2% Portuguese 2%
- Foreign-born
- 5% · Canada
- Languages at home
- 89% English-only · Spanish 9% Other Asian/Pacific 1%
Political lean MEDSL · Douglas
- 2024 margin
- D (+10.2) · D 54.4% · R 44.2% · Other 1.4%
- 2008→2024 swing
- +5.5pp toward D · 2008: 4.6pp · 2024: 10.2pp
- All cycles
- 2024: D+10.2 2020: D+11.3 2016: D+1.4 2012: R+4.3 2008: D+4.6
Not yet ingested
- Civics
- —
Market trends
- HPI YoY
- ▼ -105.85%
- Current HPI
- 254.385
- Rent YoY
- —
- Metro
- Omaha-Council Bluffs, NE-IA
- State GDP YoY
- ▲ 0.68%
- F500 in state
- 2
Industry mix (Fortune 500 HQ in NE)
| Industry | F500 HQs | Revenue |
|---|---|---|
| Conglomerate | 1 | $371B |
|
||
Price history
+83.3% since first listed15 events — show timeline
- 2026-05-29 Listed $110,000 GPRMLS
- 2015-06-30 Sold (MLS) $27,000 GPRMLS
- 2015-06-15 Pending — GPRMLS
- 2015-05-14 Price Changed $30,000 GPRMLS
- 2015-03-25 Listed $32,000 GPRMLS
- 2015-03-25 Listing Removed — GPRMLS
- 2015-02-16 Relisted — GPRMLS
- 2015-02-07 Listing Removed — GPRMLS
- 2014-09-24 Listed $32,000 GPRMLS
- 2014-09-23 Listing Removed — GPRMLS
- 2014-04-30 Listed $35,000 GPRMLS
- 2007-09-19 Listing Removed — GPRMLS
- 2007-06-11 Listing Removed — GPRMLS
- 2007-06-11 Listed $60,000 GPRMLS
- 2007-05-14 Listed $60,000 GPRMLS
Property tax history
+19.4%/yrLatest (2025): $1,985 · +38.9% YoY. Source: county tax records.
Cash-flow waterfall
monthlySold comps — $/sqft
last 12 mo · ≤1 miLoading sold comps…