23501 Sandy Creek Ter · Estero, FL
Flood risk 3/10 · Minor
- FEMA flood zone
- X (unshaded)
- Chance of flooding over 30 yrs
- 0.12%
- Est. flood insurance / yr
- $507 – $1,088
Fire risk 2/10 · Minimal
- Est. fire insurance / yr
- $947 – $1,759
Heat risk 9/10 · Severe
- Hot days now (above 107°F)
- 6 days/yr
- Hot days in 30 yrs
- 25 days/yr
Wind risk 10/10 · Severe
- Chance of severe wind over 30 yrs
- 99.0%
Air-quality risk 3/10 · Minor
- Unhealthy air days now
- 2 days/yr
- Unhealthy air days in 30 yrs
- 2 days/yr
Risk factors via First Street. Map © Google.
Why this score? — see what drove the D grade
The composite is a weighted blend of 9 inputs, each scored 0–100. Each bar is that input's sub-score; the figure is the points it added to the 100-point composite (weight × sub-score).
- Cash flow +14.2/30.0
- ARV discount +7.5/15.0
- DSCR +4.3/10.0
- Schools +4.1/10.0
- Livability +4.0/5.0
- 1% rule +3.9/10.0
- Rent growth +2.3/5.0
- Condition / age +2.0/5.0
- Appreciation +0.0/10.0
$369,900
🖨 Deal sheet 📄 Offer letter ✓ Due diligence
Listing remarks
Condo, is in gated community. SpringRun Golf Club, checkout there website.
Key facts
- Gated community
- Springrun golf club
- Built 1998
Tags
Neighborhood map
What this means for you Summary
Snapshot
- This is a 2-bed/2.0-bath other listed at $370k. Condition is rated fair.
Deal economics
- At list price, monthly cash flow is $58 ($698/yr) — positive.
- The deal already cash-flows at list — no discount required.
- To meet the 1% rule (rent ≥ 1% of price), the offer needs to be $331k (10.5% below list).
- Recommended offer: $331k (10.5% below list) — sets the bar for 1% rule.
- Cap rate 6.5% vs local median 3.4% in Estero — top-decile yield for the area; either an underpriced asset or a hidden risk that comps aren't pricing in. Stress-test before assuming the spread holds.
Location & tenants
- Location reads 79/100 on livability (#149 in FL, #2,242 nationally) — a middle-class / working-renter tenant base. Strengths: crime A+, employment A+, housing A+; Watch: amenities F, commute F, cost of living D-.
- Lee (suburban): math 47% / reading 50% proficiency, ranked #42 of 73 in FL (top 58%) — families likely to look elsewhere, expect single-tenant / working-renter base with shorter leases.
- Market conditions: Rents soft (-0.6%/yr); 835 active listings in the ZIP; 40 comparable units currently listed for rent nearby; rentals at typical pace (median 24d on market — plan ~3-4 weeks tenant-placement turnaround); solid renter incomes; 15,411 units permitted in Lee County in 2024 (4,686 in 5+ unit buildings).
- This rent runs 43% of the median local income ($91k/yr) — at the standard rent-burdened threshold; future hikes will face affordability resistance.
Forward outlook
- Local home prices are declining (-3.0%/yr); year-one equity from $3k of loan paydown is wiped out by about $11k of value loss. Plan a longer hold.
- Lee County population projected at +44% by 2050 — long-run rental-demand tailwind backs the buy-and-hold thesis.
Negotiation context
- It's been on market 36 days — a 3% lower offer ($359k) is reasonable based on typical stale-listing flexibility.
Risks & watch-outs
- Climate carrying-cost: severe wind risk, 99% chance of damaging wind over 30y; extreme-heat days projected 6→25/yr by 2055 (HVAC capex compounding) — expect insurance premiums to compound above CPI over the hold.
Questions for the listing agent
- It's been on market 36 days. Have you received any prior offers? Is the seller open to a 11% concession, seller financing, or rate buy-down credit?
- Have any recent inspections been done? Can we get a copy of the seller's disclosures and any deferred-maintenance estimates?
- Is there a deadline driving the sale (1031 exchange, divorce, estate, relocation)? That informs how much negotiation room exists.
- Schools are A-rated — typically a magnet for longer-tenancy family renters. What's the average tenant stay here, and is there a school-zone premium baked into asking?
- The area grade is low — what's the realistic commute time and amenity access for the typical tenant pool here? Any planned neighborhood developments (good or bad) we should know about?
- What's the average days-on-market for RENTAL listings here right now (not sales)? A rising rental-DOM trend means longer vacancies and softer asking-rent achievability than the comps imply.
- What's the recent tenant-quality profile in this submarket — average credit score on applications, eviction rate, late-payment / NSF rate, and stable-employment percentage? A property-management company in the area should have these aggregated.
- How much new for-sale + rental construction is in the pipeline within 1–3 miles? Heavy new supply typically softens prices + rents 12–24 months out; constrained supply supports both.
Investment metrics
- 1% rule
- 0.89% ✗
- Cap rate
- 6.48%
- Cash-on-cash
- 0.67%
- DSCR
- 1.03
- GRM
- 9.3
CMA / ARV
No comps found within radius.
Projected returns pro-forma
-3.0% appreciation · 0.0% rent growth · sell at horizon
- IRR
- -18.6%
- Equity multiple
- 0.36×
- Total profit
- $-65,885
- Equity at exit
- $55,153
- IRR
- -18.6%
- Equity multiple
- 0.13×
- Total profit
- $-89,882
- Equity at exit
- $31,982
Cash invested: $103,572 (down + closing). Projections, not guarantees.
Landlord ↔ Tenant lean methodology
- Overall (STATE)
- 87 Strongly Landlord-Friendly
- State Florida
- 87 Strongly Landlord-Friendly · R+3
- County
- — inherits STATE
- City
- — inherits STATE
ZIP-level market 34135
- Rents YoY
- -0.6%
- Active inventory
- 835
- Price-to-rent
- 9.3×
Monthly cashflow live
- Estimated rent
- $3,309 high interval (Pro) →
- Mortgage (P&I)
- −$1,940
- Tax est. 1.5%
- −$462 /mo · $5,548/yr
- Insurance
- −$154
- HOA
- −$0
- Vacancy / Maint / Mgmt
- −$695
- Net cashflow
- $58
Break-even live
UW: 25.0% down · 7.5% · 30yr · 1.5% tax · 5.0% vac · 8.0% maint · 8.0% mgmt
Financing live
Cash to close
- Down payment
- $92,475
- Closing costs
- $11,097
- Reserves months
- —
- Total cash needed
- —
Loan-product check · same deal, 3 products live
Conventional
25% down · 7.5% · 30yr
- Down + closing
- —
- Monthly P&I
- —
- Monthly cashflow
- —
- DSCR
- —
- Eligible?
- —
Personal DTI + credit; lowest rate.
DSCR
20% down · 8.5% · 30yr
- Down + closing
- —
- Monthly P&I
- —
- Monthly cashflow
- —
- DSCR
- —
- Eligible?
- —
No personal income docs; deal must DSCR.
Hard money
10% down · 12.0% · 12mo
- Down + closing
- —
- Monthly P&I
- —
- Monthly cashflow
- —
- DSCR
- —
- Eligible?
- —
Short-term bridge; refi at stabilization.
Rent comps 40 comps
| Address | Beds | Baths | Sqft | Rent | $/sqft | DOM | Units | Dist |
|---|---|---|---|---|---|---|---|---|
| 23526 Sandycreek Ter #304 Estero, FL | 2.0 | 2.0 | 1368 | $6,500 | $4.75 | 23d | 1 | 0.07mi |
| 23541 Sandycreek Ter #806 Estero, FL | 2.0 | 2.0 | 1700 | $6,000 | $3.53 | 23d | 1 | 0.14mi |
| 23591 Sandycreek Ter #1006 Estero, FL | 2.0 | 2.0 | 1209 | $6,000 | $4.96 | 23d | 1 | 0.24mi |
| 9030 Spring Run Blvd #508 Estero, FL | 2.0 | 2.0 | 1333 | $6,500 | $4.88 | 23d | 1 | 0.32mi |
| 23601 Sandycreek Ter #903 Estero, FL | 2.0 | 2.0 | 1246 | $6,000 | $4.82 | 23d | 1 | 0.34mi |
| 23520 Alamanda Dr #203 Estero, FL | 2.0 | 2.0 | 1244 | $2,200 | $1.77 | 3d | 1 | 0.43mi |
| 23520 Alamanda Dr #202 Estero, FL | 3.0 | 2.0 | 1452 | $5,500 | $3.79 | 23d | 1 | 0.43mi |
| 8561 Evernia Ct #101 Estero, FL | 2.0 | 2.0 | 1068 | $2,000 | $1.87 | 23d | 1 | 0.45mi |
| 8561 Violeta St #202 Bonita Springs, FL | 3.0 | 2.0 | 1440 | $2,950 | $2.05 | 23d | 1 | 0.45mi |
| 8560 Violeta St #101 Estero, FL | 2.0 | 3.0 | 1261 | $2,200 | $1.74 | 23d | 1 | 0.45mi |
| 8560 Evernia Ct #204 Estero, FL | 3.0 | 2.0 | 1440 | $2,100 | $1.46 | 21d | 1 | 0.45mi |
| 8500 Violeta St #102 Estero, FL | 2.0 | 2.0 | 1468 | $5,200 | $3.54 | 1d | 1 | 0.45mi |
| 23550 Alamanda Dr #102 Estero, FL | 3.0 | 2.5 | 1616 | $5,200 | $3.22 | 23d | 1 | 0.46mi |
| 23550 Alamanda Dr #203 Estero, FL | 2.0 | 2.0 | 1152 | $5,000 | $4.34 | 23d | 1 | 0.46mi |
| 8510 Violeta St #201 Estero, FL | 2.0 | 2.0 | 1152 | $2,400 | $2.08 | 23d | 1 | 0.48mi |
| 8540 Violeta St #202 Estero, FL | 3.0 | 2.0 | 1440 | $2,495 | $1.73 | 23d | 1 | 0.48mi |
| 8000 Via Sardinia Way #5207 Estero, FL | 2.0 | 2.0 | 1380 | $5,500 | $3.99 | 23d | 1 | 0.56mi |
| 8000 Via Sardinia Way #5301 Estero, FL | 3.0 | 2.0 | 1351 | $2,500 | $1.85 | 3d | 1 | 0.56mi |
| 8010 Via Sardinia Way #4208 Estero, FL | 3.0 | 2.0 | 1351 | $3,800 | $2.81 | 23d | 1 | 0.59mi |
| 8010 Via Sardinia Way Estero, FL | 1.0–2.0 | 1.5–2.0 | 1202 | $2,300 | $1.91 | 23d | 2 | 0.59mi |
| 8010 Via Sardinia Way #4112 Estero, FL | 1.0 | 1.5 | 925 | $1,995 | $2.16 | 21d | 1 | 0.59mi |
| 8010 Via Sardinia St #202 Estero, FL | 2.0 | 2.0 | 1480 | $2,200 | $1.49 | 15d | 1 | 0.59mi |
| 8010 Via Sardinia Way #4112 Estero, FL | 1.0 | 1.5 | 925 | $2,200 | $2.38 | 23d | 1 | 0.59mi |
| 23159 Amgci Way #3314 Estero, FL | 2.0 | 2.0 | 1226 | $2,400 | $1.96 | 23d | 1 | 0.59mi |
| 8001 Via Monte Carlo Way Unit 103 Estero, FL | 3.0 | 2.0 | 1351 | $2,800 | $2.07 | 19d | 1 | 0.59mi |
| 23611 Alamanda Dr #202 Estero, FL | 3.0 | 2.0 | 1440 | $2,900 | $2.01 | 23d | 1 | 0.59mi |
| 23159 Amgci Way Estero, FL | 1.0–2.0 | 1.5–2.0 | 1164 | $4,500 | $3.87 | 21d | 2 | 0.59mi |
| 8011 Via Monte Carlo Way #2213 Estero, FL | 2.0 | 2.0 | 1226 | $2,450 | $2.00 | 11d | 1 | 0.60mi |
| 8011 Via Monte Carlo Way #2209 Estero, FL | 2.0 | 2.5 | 1857 | $2,800 | $1.51 | 19d | 1 | 0.60mi |
| 23161 Fashion Dr #7109 Estero, FL | 2.0 | 2.0 | 1444 | $4,000 | $2.77 | 23d | 1 | 0.62mi |
| 23785 Clear Spring Ct #2305 Estero, FL | 3.0 | 2.0 | 1811 | $7,500 | $4.14 | 23d | 1 | 0.70mi |
| 23500 Walden Center Dr Estero, FL | 1.0–2.0 | 1.0–2.0 | 803 | $2,800 | $3.48 | 15d | 3 | 0.87mi |
| 23710 Walden Center Dr #308 Estero, FL | 3.0 | 2.0 | 1355 | $3,000 | $2.21 | 23d | 1 | 0.88mi |
| 23520 Walden Center Dr #308 Estero, FL | 2.0 | 2.0 | 1239 | $2,000 | $1.61 | 23d | 1 | 0.89mi |
| 23520 Walden Center Dr #308 Estero, FL | 2.0 | 2.0 | 1239 | $2,000 | $1.61 | 3d | 1 | 0.89mi |
| 23680 Walden Center Dr #107 Estero, FL | 2.0 | 2.0 | 1052 | $1,900 | $1.81 | 3d | 1 | 0.92mi |
| 23640 Walden Center Dr #106 Estero, FL | 2.0 | 2.0 | 1052 | $1,850 | $1.76 | 1d | 1 | 0.92mi |
| 23036 Lone Oak Dr Estero, FL | 3.0 | 2.0 | 1524 | $4,500 | $2.95 | 23d | 1 | 1.09mi |
| 8641 Piazza del Lago Cir #203 Estero, FL | 2.0 | 2.0 | 1732 | $6,100 | $3.52 | 15d | 1 | 1.09mi |
| 23007 Lone Oak Dr Estero, FL | 2.0 | 2.0 | 1524 | $3,950 | $2.59 | 23d | 1 | 1.10mi |
Listing history 9 events
-
2026-06-17days on market $369,900 Active 36 DOM
-
2026-06-16days on market $369,900 Active 35 DOM
-
2026-06-16days on market $369,900 Active 34 DOM
-
2026-06-13days on market $369,900 Active 32 DOM
-
2026-06-09days on market $369,900 Active 28 DOM
-
2026-06-07days on market $369,900 Active 26 DOM
-
2026-06-01days on market $369,900 Active 20 DOM
-
2026-06-01days on market $369,900 Active 19 DOM
-
2026-05-12$369,900 Active
ⓘ Source: listings_history table (triggers on properties + properties_extension) + one-shot
backfill from property_details.listing_events for pre-trigger history.
Climate risk First Street
- Flood 3/10 Moderate FEMA zone X (unshaded) · 12% chance over 30 yrs
- Wildfire 2/10 Low
- Heat 9/10 Extreme 6 d/yr ≥107°F today · 25 d/yr by 30 yrs out
- Wind 10/10 Extreme 99% chance of damaging wind over 30 yrs
- Air quality 3/10 Moderate 2 unhealthy d/yr today · 2 by 30 yrs out
Nearby sold comps map
Loading sold comps map…
Walkable amenities ~0.75 mi
Loading nearby amenities…
Taxation est. · year 1
- Rental income
- $39,713
- − Mortgage interest
- −$20,720
- − Property taxes
- −$5,548
- − Insurance
- −$1,850
- − Repairs & maintenance
- −$3,177
- − Management
- −$3,177
- − Depreciation
- −$10,761
- Taxable loss
- −$5,520
- Est. tax savings @ 24.0%
- +$1,325
- After-tax cash flow
- $2,022/yr
For passive investors: Depreciation is non-cash, so a rental often shows a tax loss while cash-flowing — sheltering income. Rental losses are passive: they offset passive income freely, and up to $25,000/yr can offset ordinary (W-2) income if you actively participate and your MAGI is under $100k (phasing out to $0 by $150k); unused losses carry forward. On sale, claimed depreciation is recaptured at up to 25%, and gains may owe capital-gains tax (a 1031 exchange can defer both). Figures are a year-1 estimate at your 24.0% rate — not tax advice; consult a CPA.
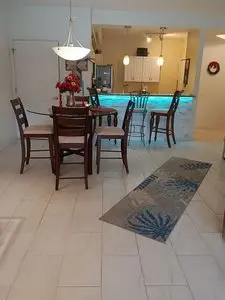
Condition & rehab AI · 1 photo
The home is in fair condition with cosmetic updates needed to enhance its resale and rental value.
Value-add opportunities
- Both Paint the interior walls — Fresh paint enhances curb appeal and interior aesthetics
- Both Replace the light fixture in the kitchen — Modern lighting can improve the home's appeal and functionality
- Both Install new window treatments — New curtains or blinds can improve the home's curb appeal and privacy
- Both Upgrade the flooring — New flooring can significantly improve the home's appearance and value
- Both Update the kitchen backsplash — A fresh backsplash can modernize the kitchen and add value
Renovation cost estimate screening
Value-add ROI direction
- Both Paint the interior walls — Fresh paint enhances curb appeal and interior aesthetics ↑
- Both Replace the light fixture in the kitchen — Modern lighting can improve the home's appeal and functionality ↑
- Both Install new window treatments — New curtains or blinds can improve the home's curb appeal and privacy ↑
- Both Upgrade the flooring — New flooring can significantly improve the home's appearance and value ↑
- Both Update the kitchen backsplash — A fresh backsplash can modernize the kitchen and add value ↑
ⓘ Cost ranges are severity-bucket heuristics (US national rule-of-thumb). Get contractor quotes + a written scope before underwriting a rehab budget.
Schools (NCES district)
- District
- Lee
- NCES district ID
- 1201080
- Math proficiency
- 47% ▼ -11.00%
- Reading proficiency
- 50% ▼ -4.00%
- Median HH income
- $49,518
- Composite
- 41.49/100
- National rank
- #3458
- State rank
- #42 of 73 in FL
Livability — Estero
- Score
- 79/100
- State rank
- #149
- US rank
- #2242
Category grades
Schools grade is shown separately in the Schools card above.
Census & demographics
- Census place
- Estero, FL
- County
- Lee County · 788,662 people
- City population
- 31,926
- Metro
- Cape Coral-Fort Myers, FL
- Population (ZIP)
- 48,252
- Household income
- $91,380
- Rent vs Own
- Severe rent burden
- 976.0
Population outlook (Lee County) Hauer SSP2
- Today (2025)
- 871,946 people
- By 2030
- 955,468 · +9.6%
- By 2040
- 1,113,587 · +27.7%
- By 2050
- 1,256,891 · +44.1%
- By 2075
- 1,560,270 · +78.9%
- By 2100
- 1,726,848 · +98.0%
Race, ethnicity, and origin ACS 2023
- Neighborhood character
- Predominantly White (69%)
- Race & ethnicity
- White 69% Hispanic / Latino 26% Two or more races 13% Native American 3% Black 2%
- Hispanic origin (detail)
- Mexican 8% Puerto Rican 4% Cuban 3%
- Common ancestry
- Romanian 5% Lithuanian 2% Slovak 2%
- Foreign-born
- 22% · Canada, Jamaica
- Languages at home
- 74% English-only · Spanish 21% French/Haitian/Cajun 1% Russian/Polish/Slavic 1%
Political lean MEDSL · Lee
- 2024 margin
- Strong R (+28.4) · D 35.5% · R 63.9%
- 2008→2024 swing
- -18.0pp toward R · 2008: -10.4pp · 2024: -28.4pp
- All cycles
- 2024: R+28.4 2020: R+19.2 2016: R+20.4 2012: R+16.6 2008: R+10.4
Not yet ingested
- Civics
- —
Market trends
- HPI YoY
- ▼ -188.86%
- Current HPI
- 243.4153
- Rent YoY
- ▼ -0.61%
- Metro
- Cape Coral-Fort Myers, FL
- State GDP YoY
- ▲ 3.28%
- F500 in state
- 36
Industry mix (Fortune 500 HQ in FL)
| Industry | F500 HQs | Revenue |
|---|---|---|
| Industrial Technology | 2 | $29B |
|
||
| Insurance | 2 | $17B |
|
||
| Retail | 1 | $60B |
|
||
| Technology Distribution | 1 | $58B |
|
||
| Homebuilding | 1 | $35B |
|
||
| Technology Manufacturing | 1 | $35B |
|
||
Price history
1 event — show timeline
- 2026-05-12 Listed $369,900 FSBO.com
Cash-flow waterfall
monthlySold comps — $/sqft
last 12 mo · ≤1 miLoading sold comps…