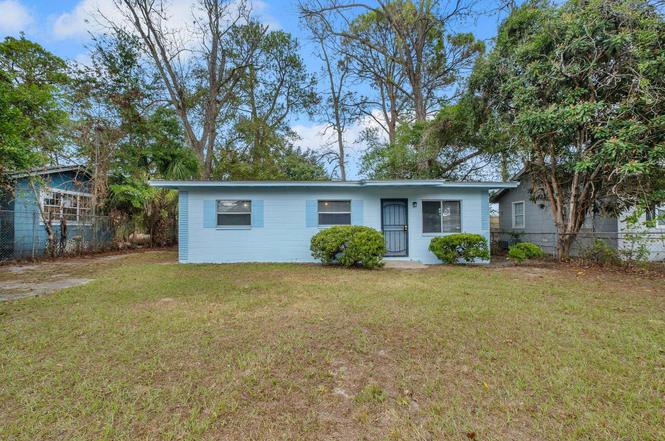
1312 Indiana St · Tallahassee, FL
Flood risk 1/10 · Minimal
- FEMA flood zone
- X (unshaded)
- Chance of flooding over 30 yrs
- 0.0%
- Est. flood insurance / yr
- $507 – $1,088
Fire risk 1/10 · Minimal
- Est. fire insurance / yr
- $947 – $1,759
Heat risk 8/10 · Major
- Hot days now (above 108°F)
- 7 days/yr
- Hot days in 30 yrs
- 20 days/yr
Wind risk 9/10 · Severe
- Chance of severe wind over 30 yrs
- 99.0%
Air-quality risk 5/10 · Moderate
- Unhealthy air days now
- 7 days/yr
- Unhealthy air days in 30 yrs
- 7 days/yr
Risk factors via First Street. Map © Google.
Why this score? — see what drove the C+ grade
The composite is a weighted blend of 9 inputs, each scored 0–100. Each bar is that input's sub-score; the figure is the points it added to the 100-point composite (weight × sub-score).
- Cash flow +23.2/30.0
- ARV discount +9.2/15.0
- DSCR +7.4/10.0
- 1% rule +5.6/10.0
- Schools +4.3/10.0
- Livability +4.3/5.0
- Rent growth +3.7/5.0
- Condition / age +2.5/5.0
- Appreciation +0.0/10.0
$130,000
🖨 Deal sheet (PDF) 📄 Offer letter ✓ Due diligence
Listing remarks
Discover charm, efficiency, and modern updates in this beautifully refreshed 828-square-foot concrete block home that is located close to downtown, schools/universities, and lots of amenities. Solidly built and thoughtfully improved, this property is perfect for first-time buyers, downsizers, students, or anyone seeking a low-maintenance home in a central Tallahassee location. Move-in ready, well-built, and full of character, this gem is the perfect blend of value, comfort, and location. Efficient layout with a bright living area and easy maintenance yard. Convenient to FAMU, FSU, parks, shopping, and downtown.
Key facts
- Efficient layout
- 5,227 sq ft lot
- Parking
Tags
Property features AI
Finance
- HOA & community: Sidewalks in the community
Exterior
- Parking: Driveway; Gated parking
- Utilities: Public sewer
- Home design: Single-story; Slab foundation; Block and concrete construction
- Construction: Block and concrete construction; Slab foundation
- Exterior features: Fully fenced yard; Public-maintained road access
Interior
- Kitchen: Oven; Range; Refrigerator; Kitchen (10x8)
- Bedrooms: Bedroom 2 (10x9); Bedroom 3 (9x11)
- Flooring: Carpet; Laminate
- Bathrooms: 1 full bathroom
- Heating & cooling: Central heating (electric); Central air conditioning (electric)
- Interior features: Carpet and laminate flooring; Living room; Family room; Dining room
Neighborhood map
What this means for you Summary
Snapshot
- This is a 3-bed/1.0-bath single-family listed at $130k.
Deal economics
- At list price, monthly cash flow is $235 ($3k/yr) — positive.
- The deal already cash-flows at list — no discount required.
- Meets the 1% rule at list price ($1k rent vs $130k).
- Recommended offer: $114k (12.0% below list) — sets the bar for market timing.
- Cap rate 8.5% vs local median 4.2% in Tallahassee — top-decile yield for the area; either an underpriced asset or a hidden risk that comps aren't pricing in. Stress-test before assuming the spread holds.
Location & tenants
- Location reads 86/100 on livability (#19 in FL, #429 nationally) — a professional / high-income tenant draw. Strengths: amenities A+, commute A+, health & safety A+; Watch: employment D.
- Leon (urban): math 48% / reading 53% proficiency, ranked #33 of 73 in FL (top 45%) — acceptable for families but not a draw, mixed tenant base, ~2y average lease.
- Zoned schools: John G Riley Elementary School (math 11% / reading 18%, grade F, #2,137 of 2,144 statewide, top 100%, 528 students, 81% FRL); Griffin Middle School (math 16% / reading 25%, grade F, #556 of 571 statewide, top 98%, 532 students, 77% FRL); Amos P. Godby High School (math 24% / reading 32%, grade F, #464 of 667 statewide, top 70%, 1,444 students, 63% FRL) — zoned schools average 74% FRL vs 45% district-wide (29 pts higher); higher-poverty schools than district average — tighter screening recommended.
- Zoned-school proficiency averages 21% at this address vs 50% district-wide (-30 pts) — the specific schools serving this property underperform the Leon average; the district grade overstates school quality for this exact location.
- Market conditions: Rents rising fast (+4.7%/yr); 142 active listings in the ZIP; 29 comparable units currently listed for rent nearby; rentals at typical pace (median 23d on market — plan ~3-4 weeks tenant-placement turnaround); lower-income renter base — watch delinquency; 1,765 units permitted in Leon County in 2024 (975 in 5+ unit buildings).
- At $1,382/mo this rent would consume 51% of the median local household income ($32k/yr) (locally 6995% of renters already pay >50% of income on rent) — very limited rent-growth headroom before tenants either downsize or default.
Forward outlook
- Local home prices are declining (-3.0%/yr); year-one equity from $899 of loan paydown is wiped out by about $4k of value loss. Plan a longer hold.
- Leon County population projected at +23% by 2050 — long-run rental-demand tailwind backs the buy-and-hold thesis.
Negotiation context
- It's been on market 179 days — a 12% lower offer ($114k) is reasonable based on typical stale-listing flexibility.
- 2 sale attempts with the ask held roughly flat each time — persistent listings suggest the price (not the market) is what's stuck; bring a comps-based counter.
- Current owner paid $14k; list at $130k implies a 863% gain — meaningful room to come down on a strong offer.
Risks & watch-outs
- Climate carrying-cost: severe wind risk, 99% chance of damaging wind over 30y; extreme-heat days projected 7→20/yr by 2055 (HVAC capex compounding) — expect insurance premiums to compound above CPI over the hold.
Questions for the listing agent
- It's been on market 179 days. Have you received any prior offers? Is the seller open to a 12% concession, seller financing, or rate buy-down credit?
- Built in 1962 — when were the roof, HVAC, electrical panel, plumbing, and water heater last replaced?
- Why hasn't it sold? Are there any deal-killer items the seller is aware of (foundation, flood, title, zoning, code violations)?
- Is there a deadline driving the sale (1031 exchange, divorce, estate, relocation)? That informs how much negotiation room exists.
- Schools are B-rated — typically a magnet for longer-tenancy family renters. What's the average tenant stay here, and is there a school-zone premium baked into asking?
- What's the average days-on-market for RENTAL listings here right now (not sales)? A rising rental-DOM trend means longer vacancies and softer asking-rent achievability than the comps imply.
- What's the recent tenant-quality profile in this submarket — average credit score on applications, eviction rate, late-payment / NSF rate, and stable-employment percentage? A property-management company in the area should have these aggregated.
- How much new for-sale + rental construction is in the pipeline within 1–3 miles? Heavy new supply typically softens prices + rents 12–24 months out; constrained supply supports both.
Investment metrics
- 1% rule
- 1.06% ✓
- Cap rate
- 8.46%
- Cash-on-cash
- 7.75%
- DSCR
- 1.34
- GRM
- 7.8
CMA / ARV
- ARV (on-the-fly)
- $134,964
- Comps found
- 6
Show comp detail 6 sales within ~0.75 mi
| Address | Dist | Beds/Ba | Sqft | Sold | Price | $/sf | Match |
|---|---|---|---|---|---|---|---|
| 1326 Volusia St | 0.08mi | 3/2.0 | 836 (+1%) | 17mo | $136,250 | $163 | 76 |
| 1233 Volusia St | 0.16mi | 3/2.0 | 868 (+5%) | 15mo | $125,000 | $144 | 68 |
| 1625 Old Bainbridge Rd | 0.49mi | 3/1.0 | 884 (+7%) | 5mo | $85,000 | $96 | 62 |
| 1124 Abraham St | 0.39mi | 2/1.0 (-1) | 758 (-8%) | 23mo | $141,000 | $186 | 44 |
| 721 Simmons St | 0.72mi | 3/1.0 | 892 (+8%) | 21mo | $185,000 | $207 | 36 |
| 734 W 7th Ave | 0.71mi | 3/1.0 | 936 (+13%) | 17mo | $50,250 | $54 | 31 |
Match score weights: distance 35% · size 25% · config 20% · recency 20%. Top-matched comps best support the ARV.
Projected returns pro-forma
-3.0% appreciation · 4.69% rent growth · sell at horizon
- IRR
- -2.7%
- Equity multiple
- 0.90×
- Total profit
- $-3,701
- Equity at exit
- $19,383
- IRR
- 8.8%
- Equity multiple
- 1.72×
- Total profit
- $26,199
- Equity at exit
- $11,240
Cash invested: $36,400 (down + closing). Projections, not guarantees.
Landlord ↔ Tenant lean methodology
- Overall (STATE)
- 87 Strongly Landlord-Friendly
- State Florida
- 87 Strongly Landlord-Friendly · R+3
- County
- — inherits STATE
- City
- — inherits STATE
ZIP-level market 32304
- Home prices YoY
- -21.2%
- Rents YoY
- 4.7%
- Active inventory
- 142
- Price-to-rent
- 7.8×
Monthly cashflow live
- Estimated rent
- $1,382 high interval (Pro) →
- Mortgage (P&I)
- −$682
- Tax from tax record
- −$121 /mo · $1,452/yr
- Insurance
- −$54
- HOA
- −$0
- Vacancy / Maint / Mgmt
- −$290
- Net cashflow
- $235
Break-even live
Sensitivity live
| Price | -10% $309 | -5% $272 | +0% $235 | +5% $198 | +10% $162 |
|---|---|---|---|---|---|
| Rent | -10% $126 | -5% $181 | +0% $235 | +5% $290 | +10% $344 |
| Rate | -1.0pp $301 | -0.5pp $268 | base $235 | +0.5pp $201 | +1.0pp $167 |
UW: 25.0% down · 7.5% · 30yr · 1.5% tax · 5.0% vac · 8.0% maint · 8.0% mgmt
Financing live
Cash to close
- Down payment
- $32,500
- Closing costs
- $3,900
- Reserves months
- —
- Total cash needed
- —
Loan-product check · same deal, 3 products live
Conventional
25% down · 7.5% · 30yr
- Down + closing
- —
- Monthly P&I
- —
- Monthly cashflow
- —
- DSCR
- —
- Eligible?
- —
Personal DTI + credit; lowest rate.
DSCR
20% down · 8.5% · 30yr
- Down + closing
- —
- Monthly P&I
- —
- Monthly cashflow
- —
- DSCR
- —
- Eligible?
- —
No personal income docs; deal must DSCR.
Hard money
10% down · 12.0% · 12mo
- Down + closing
- —
- Monthly P&I
- —
- Monthly cashflow
- —
- DSCR
- —
- Eligible?
- —
Short-term bridge; refi at stabilization.
Rent comps 29 comps
| Address | Beds | Baths | Sqft | Rent | $/sqft | DOM | Units | Dist |
|---|---|---|---|---|---|---|---|---|
| 1325 W Tharpe St Tallahassee, FL | 1.0–3.0 | 1.0–4.0 | 937 | $1,676 | $1.79 | 15d | 21 | 0.24mi |
| 1108 Greentree Ct Tallahassee, FL | 2.0 | 2.0 | 888 | $1,275 | $1.44 | 23d | 1 | 0.45mi |
| 1111 High Rd Tallahassee, FL | 2.0–3.0 | 2.0 | 1000 | $1,594 | $1.59 | 15d | 11 | 0.50mi |
| 1410 Nylic St Unit B Tallahassee, FL | 2.0 | 1.0 | 550 | $900 | $1.64 | 15d | 1 | 0.52mi |
| 916 N Woodward Ave #1 Tallahassee, FL | 2.0 | 1.0 | 794 | $1,000 | $1.26 | 15d | 1 | 0.60mi |
| 2020 Continental Ave Tallahassee, FL | 1.0–2.0 | 1.0–1.5 | 850 | $1,300 | $1.53 | 23d | 3 | 0.60mi |
| 2060 Continental Ave Tallahassee, FL | 1.0–3.0 | 1.0–2.5 | 1121 | $1,185 | $1.06 | 15d | 26 | 0.73mi |
| 1303 Ocala Rd Tallahassee, FL | 1.0–4.0 | 1.0–2.0 | 1121 | $1,445 | $1.29 | 15d | 48 | 0.75mi |
| 1360 Ocala Rd Tallahassee, FL | 2.0 | 1.0 | 800 | $1,000 | $1.25 | 23d | 1 | 0.80mi |
| 1001 Ocala Rd Tallahassee, FL | 4.0 | 1.0–2.0 | 899 | $642 | $0.71 | 23d | 6 | 0.82mi |
| 322 Conradi St Tallahassee, FL | 3.0 | 2.0 | 1100 | $1,950 | $1.77 | 23d | 4 | 0.94mi |
| 2301 Old Bainbridge Rd Tallahassee, FL | 2.0–3.0 | 1.0–2.0 | 1084 | $1,600 | $1.48 | 23d | 1 | 0.97mi |
| 1916 Nannette Dr Unit 1916 Tallahassee, FL | 2.0 | 1.0 | 1000 | $1,100 | $1.10 | 15d | 1 | 0.98mi |
| 2309 Old Bainbridge Rd Tallahassee, FL | 1.0–2.0 | 1.0–2.0 | 798 | $1,420 | $1.78 | 15d | 10 | 1.07mi |
| 1935 Dawsey St Unit 1935-2 Tallahassee, FL | 2.0 | 1.0 | 875 | $975 | $1.11 | 15d | 1 | 1.07mi |
| 1447 Stone Rd Tallahassee, FL | 1.0–3.0 | 1.0–2.0 | 890 | $1,545 | $1.74 | 23d | 1 | 1.16mi |
| 1210 Stone Rd Tallahassee, FL | 2.0 | 2.0 | 1008 | $1,200 | $1.19 | 23d | 1 | 1.20mi |
| 1818 Sylvan Ct Unit D Tallahassee, FL | 2.0 | 1.0 | 850 | $1,200 | $1.41 | 15d | 1 | 1.22mi |
| 412 W Brevard St Unit 412 Tallahassee, FL | 3.0 | 2.0 | 900 | $800 | $0.89 | 23d | 1 | 1.32mi |
| 718 N Bronough St Tallahassee, FL | 2.0 | 1.0 | 798 | $1,100 | $1.38 | 23d | 1 | 1.38mi |
| 2353 W Mission Rd Tallahassee, FL | 2.0–3.0 | 2.0–2.5 | 1012 | $1,450 | $1.43 | 15d | 11 | 1.39mi |
| 2350 Horne Ave Unit 2 Tallahassee, FL | 2.0 | 2.0 | 800 | $995 | $1.24 | 23d | 1 | 1.41mi |
| 220 Atkinson Dr Unit D Tallahassee, FL | 2.0 | 1.0 | 928 | $1,100 | $1.19 | 23d | 1 | 1.41mi |
| 2259 Parrot Ln Tallahassee, FL | 2.0 | 2.0 | 992 | $1,275 | $1.29 | 23d | 1 | 1.42mi |
| 2349 Horne Ave Unit C Tallahassee, FL | 2.0 | 1.0 | 680 | $1,100 | $1.62 | 15d | 1 | 1.42mi |
| 2350 Wanda Way Tallahassee, FL | 2.0–3.0 | 1.0 | 861 | $1,400 | $1.63 | 23d | 1 | 1.43mi |
| 2327 Parrot Ln Tallahassee, FL | 3.0 | 2.0 | 1088 | $1,300 | $1.19 | 23d | 1 | 1.46mi |
| 1600 Pullen Rd Tallahassee, FL | 1.0–2.0 | 1.0–2.0 | 875 | $1,345 | $1.54 | 15d | 1 | 1.47mi |
| 2401 Atlas Rd Unit B Tallahassee, FL | 2.0 | 1.0 | 900 | $1,100 | $1.22 | 23d | 1 | 1.47mi |
Listing history 24 events
-
2026-06-22days on market $130,000 Active 179 DOM
-
2026-06-18pricestatusdays on market $130,000 Active 176 DOM
-
2026-06-17days on market $137,000 Active Under Contract 175 DOM
-
2026-06-16days on market $137,000 Active Under Contract 174 DOM
-
2026-06-15days on market $137,000 Active Under Contract 173 DOM
-
2026-06-14days on market $137,000 Active Under Contract 171 DOM
-
2026-06-10days on market $137,000 Active Under Contract 168 DOM
-
2026-06-09days on market $137,000 Active Under Contract 167 DOM
-
2026-06-08days on market $137,000 Active Under Contract 166 DOM
-
2026-06-07days on market $137,000 Active Under Contract 165 DOM
-
2026-06-05days on market $137,000 Active Under Contract 162 DOM
-
2026-06-03days on market $137,000 Active Under Contract 161 DOM
-
2026-06-02days on market $137,000 Active Under Contract 160 DOM
-
2026-06-01days on market $137,000 Active Under Contract 159 DOM
-
2026-05-31days on market $137,000 Active Under Contract 158 DOM
-
2026-05-30days on market $137,000 Active Under Contract 157 DOM
-
2026-05-19historical Active Under Contract
-
2026-03-12status Active
-
2026-03-12price $137,000
-
2026-03-12price $135,500
-
2026-03-12price $137,000
-
2026-02-02historical Active Under Contract
-
2025-12-20$135,500 Active
-
1993-09-08soldstatus $13,500
ⓘ Source: listings_history table (triggers on properties + properties_extension) + one-shot
backfill from property_details.listing_events for pre-trigger history.
Tax reassessment forecast FL · Resets to sale price
- Current annual tax
- $1,452 · $121/mo
- Projected year-2 tax
- $1,452 · $121/mo
- Expected delta
- $0/yr ($0/mo · 0.0%)
ⓘ Screening estimate from a state-policy table — verify with the county assessor before closing.
Climate risk First Street
- Flood 1/10 Low FEMA zone X (unshaded) · 0% chance over 30 yrs
- Wildfire 1/10 Low
- Heat 8/10 Severe 7 d/yr ≥108°F today · 20 d/yr by 30 yrs out
- Wind 9/10 Extreme 99% chance of damaging wind over 30 yrs
- Air quality 5/10 Major 7 unhealthy d/yr today · 7 by 30 yrs out
Nearby sold comps map
Loading sold comps map…
Walkable amenities ~0.75 mi
Loading nearby amenities…
Taxation est. · year 1
- Rental income
- $16,589
- − Mortgage interest
- −$7,282
- − Property taxes
- −$1,452
- − Insurance
- −$650
- − Repairs & maintenance
- −$1,327
- − Management
- −$1,327
- − Depreciation
- −$3,782
- Taxable income
- $769
- Est. tax owed @ 24.0%
- −$184
- After-tax cash flow
- $2,638/yr
For passive investors: Depreciation is non-cash, so a rental often shows a tax loss while cash-flowing — sheltering income. Rental losses are passive: they offset passive income freely, and up to $25,000/yr can offset ordinary (W-2) income if you actively participate and your MAGI is under $100k (phasing out to $0 by $150k); unused losses carry forward. On sale, claimed depreciation is recaptured at up to 25%, and gains may owe capital-gains tax (a 1031 exchange can defer both). Figures are a year-1 estimate at your 24.0% rate — not tax advice; consult a CPA.
Schools (NCES district)
- District
- Leon
- NCES district ID
- 1201110
- Math proficiency
- 48% ▼ -13.00%
- Reading proficiency
- 53% ▼ -5.00%
- Median HH income
- $46,339
- Composite
- 42.84/100
- National rank
- #3131
- State rank
- #33 of 73 in FL
Livability — Tallahassee
- Score
- 86/100
- State rank
- #19
- US rank
- #429
Category grades
Schools grade is shown separately in the Schools card above.
Census & demographics
- Census place
- Tallahassee, FL
- County
- Leon County · 294,472 people
- City population
- 294,472
- Metro
- Tallahassee, FL
- Population (ZIP)
- 51,673
- Household income
- $32,348
- Rent vs Own
- Severe rent burden
- 6995.0
Population outlook (Leon County) Hauer SSP2
- Today (2025)
- 315,507 people
- By 2030
- 330,677 · +4.8%
- By 2040
- 358,465 · +13.6%
- By 2050
- 386,804 · +22.6%
- By 2075
- 465,480 · +47.5%
- By 2100
- 519,959 · +64.8%
Race, ethnicity, and origin ACS 2023
- Neighborhood character
- Diverse neighborhood (Simpson 0.65)
- Race & ethnicity
- White 45% Black 36% Hispanic / Latino 10% Two or more races 7% Asian 4%
- Hispanic origin (detail)
- Mexican 2% Puerto Rican 2% Cuban 2%
- Common ancestry
- Romanian 2% Lithuanian 1% Italian 1%
- Foreign-born
- 8% · Canada, China
- Languages at home
- 86% English-only · Spanish 7% Other Indo-European 2% French/Haitian/Cajun 1%
Political lean MEDSL · Leon
- 2024 margin
- Strong D (+21.8) · D 60.3% · R 38.5% · Other 1.2%
- 2008→2024 swing
- -2.5pp toward R · 2008: 24.3pp · 2024: 21.8pp
- All cycles
- 2024: D+21.8 2020: D+28.3 2016: D+25.1 2012: D+23.6 2008: D+24.3
Not yet ingested
- Civics
- —
Market trends
- HPI YoY
- ▼ -72.04%
- Current HPI
- 267.8426
- Rent YoY
- ▲ 4.69%
- Metro
- Tallahassee, FL
- State GDP YoY
- ▲ 3.28%
- F500 in state
- 36
Industry mix (Fortune 500 HQ in FL)
| Industry | F500 HQs | Revenue |
|---|---|---|
| Industrial Technology | 2 | $29B |
|
||
| Insurance | 2 | $17B |
|
||
| Retail | 1 | $60B |
|
||
| Technology Distribution | 1 | $58B |
|
||
| Homebuilding | 1 | $35B |
|
||
| Technology Manufacturing | 1 | $35B |
|
||
Price history
+914.8% since first listed8 events — show timeline
- 2026-05-19 Contingent — CATRS
- 2026-03-12 Relisted — CATRS
- 2026-03-12 Price Changed $137,000 CATRS
- 2026-03-12 Price Changed $135,500 CATRS
- 2026-03-12 Price Changed $137,000 CATRS
- 2026-02-02 Contingent — CATRS
- 2025-12-20 Listed $135,500 CATRS
- 1993-09-08 Sold (Public Records) $13,500 Public Records
Property tax history
+6.5%/yrLatest (2025): $1,452 · +11.6% YoY. Source: county tax records.
Cash-flow waterfall
monthlySold comps — $/sqft
last 12 mo · ≤1 miLoading sold comps…