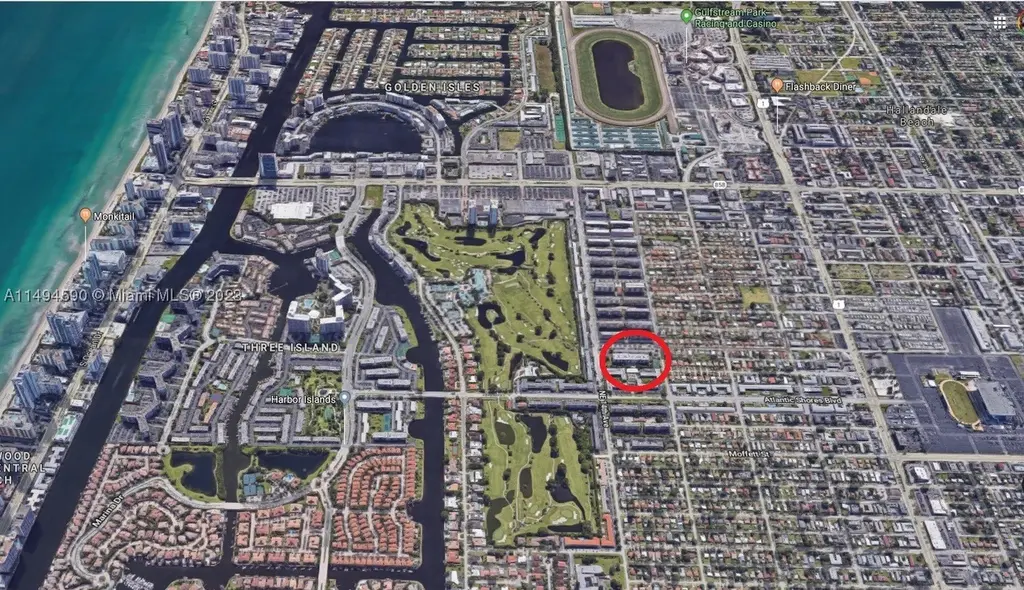
1300 Moffett St #302 · Hallandale Beach, FL
Flood risk No data
- FEMA flood zone
- —
- Chance of flooding over 30 yrs
- —
- Est. flood insurance / yr
- —
Fire risk No data
- Est. fire insurance / yr
- —
Heat risk No data
- Hot days now (above threshold)
- —
- Hot days in 30 yrs
- —
Wind risk No data
- Chance of severe wind over 30 yrs
- —
Air-quality risk No data
- Unhealthy air days now
- —
- Unhealthy air days in 30 yrs
- —
Risk factors via First Street. Map © Google.
Why this score? — see what drove the C- grade
The composite is a weighted blend of 9 inputs, each scored 0–100. Each bar is that input's sub-score; the figure is the points it added to the 100-point composite (weight × sub-score).
- Cash flow +17.8/30.0
- ARV discount +7.5/15.0
- 1% rule +6.7/10.0
- DSCR +5.6/10.0
- Schools +4.1/10.0
- Livability +4.0/5.0
- Rent growth +2.6/5.0
- Condition / age +2.5/5.0
- Appreciation +0.0/10.0
$239,500
🖨 Deal sheet 📄 Offer letter ✓ Due diligence
Listing remarks MLS
NOT A SHORT SALE! WALKING DISTANCE TO THE BEACHES, SHOPPING RESTAURANTS AND CASINOS. BEAUTIFUL 1 BEDROOM AND 2 BATHROOM CORNER UNIT. ALL IN GOOD WORKING CONDITION, FULLY FURNISHED, BRAND NEW KITCHEN WIT GRANITE COUNTER TOP, TILES THROUGHTOUT, 3RD FLOOR, VERY NICE POOL, QUIET AREA, OWNER MOVE TO NEW YORK. PLEASE MAKE OFFER.
Key facts
- $293 HOA
- Parking
- Community pool
Property features AI
Finance
- Financial info: Pets allowed with restrictions
- HOA & community: Monthly association fee; Association fee covers amenities, common areas, sewer, security, trash and water; Association amenities include elevator(s), laundry, playground, pool and trash
Exterior
- Parking: Carport (1 space); Assigned parking; Guest parking; One covered space
- Security: Closed-circuit cameras; Secured elevator
- Utilities: Central cooling
- Home design: Attached property; 3-story building; Entry on level 3
- Construction: Block construction; Resale property
- Exterior features: Barbecue area; Fruit trees; Association pool
Interior
- Kitchen: Dishwasher; Icemaker; Refrigerator
- Flooring: Tile
- Bathrooms: One full bathroom; One half bathroom
- Heating & cooling: Central air conditioning
- Interior features: Closet cabinetry; Entrance foyer; Other built-in features; Tile flooring
- Laundry & utility: Common area laundry
Neighborhood map
What this means for you Summary
Snapshot
- This is a 1-bed/2.0-bath condo listed at $240k.
Deal economics
- At list price, monthly cash flow is $198 ($2k/yr) — positive.
- The deal already cash-flows at list — no discount required.
- Meets the 1% rule at list price ($3k rent vs $240k).
- Recommended offer: $211k (12.0% below list) — sets the bar for market timing.
- Cap rate 7.3% vs local median 5.2% in Hallandale Beach — top-decile yield for the area; either an underpriced asset or a hidden risk that comps aren't pricing in. Stress-test before assuming the spread holds.
Location & tenants
- Location reads 81/100 on livability (#86 in FL, #1,400 nationally) — a professional / high-income tenant draw. Strengths: commute A+, health & safety A+, crime B+; Watch: schools C-, employment D-.
- Broward (suburban): math 42% / reading 53% proficiency, ranked #46 of 73 in FL (top 63%) — families likely to look elsewhere, expect single-tenant / working-renter base with shorter leases.
- Market conditions: Rents flat; 1373 active listings in the ZIP; 17 comparable units currently listed for rent nearby; rentals leasing fast (median 8d on market — plan ~1-2 weeks tenant-placement turnaround); 2,111 units permitted in Broward County in 2024 (1,265 in 5+ unit buildings).
- At $2,799/mo this rent would consume 64% of the median local household income ($52k/yr) (locally 3293% of renters already pay >50% of income on rent) — very limited rent-growth headroom before tenants either downsize or default.
Forward outlook
- Local home prices are declining (-3.0%/yr); year-one equity from $2k of loan paydown is wiped out by about $7k of value loss. Plan a longer hold.
- Broward County population projected at +34% by 2050 — long-run rental-demand tailwind backs the buy-and-hold thesis.
Negotiation context
- It's been on market 930 days — a 12% lower offer ($211k) is reasonable based on typical stale-listing flexibility.
- 3 sale attempts since 3y ago; this cycle's ask is 13213% above the opening price — seller raised mid-cycle; expect resistance to lowballs.
- Current owner paid $62k; list at $240k implies a 286% gain — meaningful room to come down on a strong offer.
Questions for the listing agent
- It's been on market 930 days. Have you received any prior offers? Is the seller open to a 12% concession, seller financing, or rate buy-down credit?
- Built in 1973 — when were the roof, HVAC, electrical panel, plumbing, and water heater last replaced?
- What does the HOA fee cover, when was the last increase, and are there any pending special assessments or reserve-fund shortfalls?
- Any open or pending special assessments — roof, HVAC, plumbing, elevator, façade? What's the per-unit balance and payoff schedule, and is the seller paying it off at close or rolling it to the buyer?
- Why hasn't it sold? Are there any deal-killer items the seller is aware of (foundation, flood, title, zoning, code violations)?
- Is there a deadline driving the sale (1031 exchange, divorce, estate, relocation)? That informs how much negotiation room exists.
- What's the average days-on-market for RENTAL listings here right now (not sales)? A rising rental-DOM trend means longer vacancies and softer asking-rent achievability than the comps imply.
- What's the recent tenant-quality profile in this submarket — average credit score on applications, eviction rate, late-payment / NSF rate, and stable-employment percentage? A property-management company in the area should have these aggregated.
- How much new apartment / multifamily construction is in the pipeline within 1–3 miles? Heavy new supply (>2% of stock underway) typically softens rents 12–24 months out; light construction supports rent growth.
Investment metrics
- 1% rule
- 1.17% ✓
- Cap rate
- 7.28%
- Cash-on-cash
- 3.53%
- DSCR
- 1.16
- GRM
- 7.1
CMA / ARV
No comps found within radius.
Projected returns pro-forma
-3.0% appreciation · 0.43% rent growth · sell at horizon
- IRR
- -14.1%
- Equity multiple
- 0.51×
- Total profit
- $-33,024
- Equity at exit
- $35,710
- IRR
- -11.2%
- Equity multiple
- 0.42×
- Total profit
- $-38,995
- Equity at exit
- $20,708
Cash invested: $67,060 (down + closing). Projections, not guarantees.
Landlord ↔ Tenant lean methodology
- Overall (STATE)
- 87 Strongly Landlord-Friendly
- State Florida
- 87 Strongly Landlord-Friendly · R+3
- County
- — inherits STATE
- City
- — inherits STATE
ZIP-level market 33009
- Rents YoY
- 0.4%
- Active inventory
- 1373
- Price-to-rent
- 7.1×
Monthly cashflow live
- Estimated rent
- $2,799 high interval (Pro) →
- Mortgage (P&I)
- −$1,256
- Tax from tax record
- −$365 /mo · $4,378/yr
- Insurance
- −$100
- HOA
- −$293
- Vacancy / Maint / Mgmt
- −$588
- Net cashflow
- $198
Break-even live
UW: 25.0% down · 7.5% · 30yr · 1.5% tax · 5.0% vac · 8.0% maint · 8.0% mgmt
Financing live
Cash to close
- Down payment
- $59,875
- Closing costs
- $7,185
- Reserves months
- —
- Total cash needed
- —
Loan-product check · same deal, 3 products live
Conventional
25% down · 7.5% · 30yr
- Down + closing
- —
- Monthly P&I
- —
- Monthly cashflow
- —
- DSCR
- —
- Eligible?
- —
Personal DTI + credit; lowest rate.
DSCR
20% down · 8.5% · 30yr
- Down + closing
- —
- Monthly P&I
- —
- Monthly cashflow
- —
- DSCR
- —
- Eligible?
- —
No personal income docs; deal must DSCR.
Hard money
10% down · 12.0% · 12mo
- Down + closing
- —
- Monthly P&I
- —
- Monthly cashflow
- —
- DSCR
- —
- Eligible?
- —
Short-term bridge; refi at stabilization.
Rent comps 17 comps
| Address | Beds | Baths | Sqft | Rent | $/sqft | DOM | Units | Dist |
|---|---|---|---|---|---|---|---|---|
| 401 N Federal Hwy Hallandale Beach, FL | 1.0–3.0 | 1.0–2.0 | 973 | $1,892 | $1.94 | 15d | 48 | 0.67mi |
| 200 E Pembroke Rd Hallandale Beach, FL | 3.0 | 1.0–2.0 | 1006 | $2,840 | $2.82 | 2d | 62 | 0.68mi |
| 1180 E Hallandale Beach Blvd Unit 1241877P Hallandale Beach, FL | 1.0–2.0 | 1.0–2.0 | 844 | $2,465 | $2.92 | 3d | 2 | 0.88mi |
| 320 S Federal Hwy Hollywood, FL | 2.0 | 1.0–2.0 | 742 | $2,758 | $3.72 | 24d | 9 | 0.93mi |
| 303 S Federal Hwy Hollywood, FL | 1.0–3.0 | 1.0–3.0 | 992 | $2,175 | $2.19 | 2d | 35 | 0.94mi |
| 1770 S Young Cir Hollywood, FL | 2.0 | 1.0–2.0 | 881 | $3,652 | $4.15 | 2d | 42 | 0.97mi |
| 2601 E Hallandale Beach Blvd Unit 1227344P Hallandale Beach, FL | 1.0–2.0 | 1.0–2.0 | 844 | $2,465 | $2.92 | 2d | 2 | 1.11mi |
| 2001 Van Buren St Hollywood, FL | 2.0 | 1.0–2.0 | 788 | $2,801 | $3.55 | 15d | 171 | 1.12mi |
| 2602 E Hallandale Beach Blvd Hallandale Beach, FL | 3.0 | 1.0–3.0 | 1011 | $3,862 | $3.82 | 2d | 5 | 1.12mi |
| 1818 Hollywood Blvd Hollywood, FL | 3.0 | 1.0–2.5 | 1089 | $2,764 | $2.54 | 2d | 17 | 1.12mi |
| 2501 S Ocean Dr Hollywood, FL | 1.0–2.0 | 1.0–2.0 | 971 | $4,000 | $4.12 | 8d | 7 | 1.15mi |
| 2501 S Ocean Dr Hollywood, FL | 1.0–2.0 | 1.0–2.0 | 971 | $4,400 | $4.53 | 10d | 6 | 1.15mi |
| 2501 S Ocean Dr Hollywood, FL | 1.0–2.0 | 1.0–2.0 | 971 | $3,800 | $3.91 | 19d | 8 | 1.15mi |
| 2501 S Ocean Dr Hollywood, FL | 1.0–2.0 | 1.0–2.0 | 971 | $4,200 | $4.32 | 14d | 7 | 1.15mi |
| 1776 Polk St Hollywood, FL | 1.0–2.0 | 1.0–2.0 | 954 | $2,843 | $2.98 | 15d | 25 | 1.19mi |
| 2165 Van Buren St Hollywood, FL | 3.0 | 1.0–3.0 | 1072 | $2,797 | $2.61 | 2d | 14 | 1.30mi |
| 2233 Hollywood Blvd Hollywood, FL | 1.0–2.0 | 1.0–2.0 | 913 | $2,540 | $2.78 | 15d | 94 | 1.42mi |
HOA detail condo
- Monthly dues
- $293 · $3,516/yr
- Likely covers
- pool
- Assessments
- None detected in remarks — confirm with the listing agent.
Listing history 37 events
-
2026-06-18days on market $239,500 Active 930 DOM
-
2026-06-17days on market $239,500 Active 929 DOM
-
2026-06-16days on market $239,500 Active 928 DOM
-
2026-06-15days on market $239,500 Active 927 DOM
-
2026-06-13days on market $239,500 Active 925 DOM
-
2026-06-09days on market $239,500 Active 921 DOM
-
2026-06-07days on market $239,500 Active 919 DOM
-
2026-06-04days on market $239,500 Active 916 DOM
-
2026-06-03days on market $239,500 Active 915 DOM
-
2026-06-02days on market $239,500 Active 914 DOM
-
2026-06-01days on market $239,500 Active 913 DOM
-
2026-05-31days on market $239,500 Active 912 DOM
-
2026-02-10historical $1,498
-
2026-02-03price $1,498
-
2026-02-02price $229,500
-
2025-12-24price $1,499
-
2025-12-23price $231,500
-
2025-11-29price $1,599
-
2025-11-18price $1,675
-
2025-10-21price $1,700
-
2025-10-02price $1,749
-
2025-08-26$1,799
-
2025-05-05price $232,500
-
2024-09-25historical $1,699
-
2024-09-04price $1,699
-
2024-08-16price $1,789
-
2024-08-07price $1,799
-
2024-07-14$1,850
-
2024-06-28price $233,500
-
2024-06-03price $234,500
-
2024-05-07price $237,000
-
2024-04-03price $244,591
-
2024-01-26price $249,591
-
2023-12-01$249,592 Active
-
2012-03-23soldstatus $62,000
-
2012-03-21soldstatus $62,000 325-char remark
Show marketing remark (325 chars)
NOT A SHORT SALE! WALKING DISTANCE TO THE BEACHES, SHOPPING RESTAURANTS AND CASINOS. BEAUTIFUL 1 BEDROOM AND 2 BATHROOM CORNER UNIT. ALL IN GOOD WORKING CONDITION, FULLY FURNISHED, BRAND NEW KITCHEN WIT GRANITE COUNTER TOP, TILES THROUGHTOUT, 3RD FLOOR, VERY NICE POOL, QUIET AREA, OWNER MOVE TO NEW YORK. PLEASE MAKE OFFER.
-
2009-04-30soldstatus $50,000 310-char remark
Show marketing remark (310 chars)
Bank-Owned property!. Special incentives include free credit report & appraisal if financed through Countrywide. Must have pre-approval letter from Countrywide to submit offer or proof of founds. Easy to show. See broker remarks for showing instructions, click on attachments on how to submit your offer.
ⓘ Source: listings_history table (triggers on properties + properties_extension) + one-shot
backfill from property_details.listing_events for pre-trigger history.
Tax reassessment forecast FL · Resets to sale price
- Current annual tax
- $4,378 · $365/mo
- Projected year-2 tax
- $4,378 · $365/mo
- Expected delta
- $0/yr ($0/mo · 0.0%)
ⓘ Screening estimate from a state-policy table — verify with the county assessor before closing.
Nearby sold comps map
Loading sold comps map…
Walkable amenities ~0.75 mi
Loading nearby amenities…
Taxation est. · year 1
- Rental income
- $33,586
- − Mortgage interest
- −$13,416
- − Property taxes
- −$4,378
- − Insurance
- −$1,198
- − Repairs & maintenance
- −$2,687
- − Management
- −$2,687
- − HOA
- −$3,516
- − Depreciation
- −$6,967
- Taxable loss
- −$1,262
- Est. tax savings @ 24.0%
- +$303
- After-tax cash flow
- $2,673/yr
For passive investors: Depreciation is non-cash, so a rental often shows a tax loss while cash-flowing — sheltering income. Rental losses are passive: they offset passive income freely, and up to $25,000/yr can offset ordinary (W-2) income if you actively participate and your MAGI is under $100k (phasing out to $0 by $150k); unused losses carry forward. On sale, claimed depreciation is recaptured at up to 25%, and gains may owe capital-gains tax (a 1031 exchange can defer both). Figures are a year-1 estimate at your 24.0% rate — not tax advice; consult a CPA.
Schools (NCES district)
- District
- Broward
- NCES district ID
- 1200180
- Math proficiency
- 42% ▼ -18.00%
- Reading proficiency
- 53% ▼ -5.00%
- Median HH income
- $52,139
- Composite
- 40.88/100
- National rank
- #3621
- State rank
- #46 of 73 in FL
Livability — Hallandale Beach
- Score
- 81/100
- State rank
- #86
- US rank
- #1400
Category grades
Schools grade is shown separately in the Schools card above.
Census & demographics
- Census place
- Hallandale Beach, FL
- County
- Broward County · 1,963,430 people
- City population
- 44,021
- Metro
- Miami-Fort Lauderdale-Pompano Beach, FL
- Population (ZIP)
- 44,502
- Household income
- $52,079
- Rent vs Own
- Severe rent burden
- 3293.0
Population outlook (Broward County) Hauer SSP2
- Today (2025)
- 2,207,033 people
- By 2030
- 2,360,704 · +7.0%
- By 2040
- 2,661,208 · +20.6%
- By 2050
- 2,946,698 · +33.5%
- By 2075
- 3,602,273 · +63.2%
- By 2100
- 3,970,984 · +79.9%
Race, ethnicity, and origin ACS 2023
- Neighborhood character
- Diverse neighborhood (Simpson 0.67)
- Race & ethnicity
- Hispanic / Latino 39% White 39% Two or more races 24% Black 17% Asian 1%
- Hispanic origin (detail)
- Mexican 2% Puerto Rican 3% Cuban 9% Dominican 3% Salvadoran 2%
- Common ancestry
- Scotch-Irish 5% Hispanic 5% Subsaharan African 3%
- Foreign-born
- 51% · Canada, Jamaica, Dominican Republic
- Languages at home
- 38% English-only · Spanish 36% Russian/Polish/Slavic 12% French/Haitian/Cajun 7%
Political lean MEDSL · Broward
- 2024 margin
- D (+17.0) · D 58.0% · R 41.0%
- 2008→2024 swing
- -17.8pp toward R · 2008: 34.7pp · 2024: 17.0pp
- All cycles
- 2024: D+17.0 2020: D+29.8 2016: D+35.0 2012: D+34.9 2008: D+34.7
Not yet ingested
- Civics
- —
Market trends
- HPI YoY
- ▼ -299.13%
- Current HPI
- 329.9081
- Rent YoY
- ▲ 0.43%
- Metro
- Miami-Fort Lauderdale-Pompano Beach, FL
- State GDP YoY
- ▲ 3.28%
- F500 in state
- 36
Industry mix (Fortune 500 HQ in FL)
| Industry | F500 HQs | Revenue |
|---|---|---|
| Industrial Technology | 2 | $29B |
|
||
| Insurance | 2 | $17B |
|
||
| Retail | 1 | $60B |
|
||
| Technology Distribution | 1 | $58B |
|
||
| Homebuilding | 1 | $35B |
|
||
| Technology Manufacturing | 1 | $35B |
|
||
Price history
-97.0% since first listed25 events — show timeline
- 2026-02-10 Rental Removed $1,498 MARMLS
- 2026-02-03 Price Changed $1,498 MARMLS
- 2026-02-02 Price Changed $229,500 MARMLS
- 2025-12-24 Price Changed $1,499 MARMLS
- 2025-12-23 Price Changed $231,500 MARMLS
- 2025-11-29 Price Changed $1,599 MARMLS
- 2025-11-18 Price Changed $1,675 MARMLS
- 2025-10-21 Price Changed $1,700 MARMLS
- 2025-10-02 Price Changed $1,749 MARMLS
- 2025-08-26 Listed for Rent $1,799 MARMLS
- 2025-05-05 Price Changed $232,500 MARMLS
- 2024-09-25 Rental Removed $1,699 MARMLS
- 2024-09-04 Price Changed $1,699 MARMLS
- 2024-08-16 Price Changed $1,789 MARMLS
- 2024-08-07 Price Changed $1,799 MARMLS
- 2024-07-14 Listed for Rent $1,850 MARMLS
- 2024-06-28 Price Changed $233,500 MARMLS
- 2024-06-03 Price Changed $234,500 MARMLS
- 2024-05-07 Price Changed $237,000 MARMLS
- 2024-04-03 Price Changed $244,591 MARMLS
- 2024-01-26 Price Changed $249,591 MARMLS
- 2023-12-01 Listed $249,592 MARMLS
- 2012-03-23 Sold (Public Records) $62,000 Public Records
- 2012-03-21 Sold (MLS) $62,000 MARMLS
- 2009-04-30 Sold (MLS) $50,000 MARMLS
Property tax history
+11.7%/yrLatest (2025): $4,378 · +6.8% YoY. Source: county tax records.
Cash-flow waterfall
monthlySold comps — $/sqft
last 12 mo · ≤1 miLoading sold comps…