97 Waverly Ave #3 · New York, NY
Flood risk 1/10 · Minimal
- FEMA flood zone
- X (unshaded)
- Chance of flooding over 30 yrs
- 0.0%
- Est. flood insurance / yr
- $507 – $1,088
Fire risk 1/10 · Minimal
- Est. fire insurance / yr
- $691 – $1,283
Heat risk 6/10 · Moderate
- Hot days now (above 99°F)
- 7 days/yr
- Hot days in 30 yrs
- 15 days/yr
Wind risk 6/10 · Moderate
- Chance of severe wind over 30 yrs
- 27.0%
Air-quality risk 4/10 · Minor
- Unhealthy air days now
- 5 days/yr
- Unhealthy air days in 30 yrs
- 7 days/yr
Risk factors via First Street. Map © Google.
Why this score? — see what drove the D- grade
The composite is a weighted blend of 9 inputs, each scored 0–100. Each bar is that input's sub-score; the figure is the points it added to the 100-point composite (weight × sub-score).
- Appreciation +10.0/10.0
- ARV discount +7.5/15.0
- Schools +5.0/10.0
- Rent growth +4.7/5.0
- Cash flow +4.4/30.0
- Livability +3.8/5.0
- Condition / age +2.5/5.0
- 1% rule +1.0/10.0
- DSCR +0.0/10.0
$790,000
🖨 Deal sheet (PDF) 📄 Offer letter ✓ Due diligence
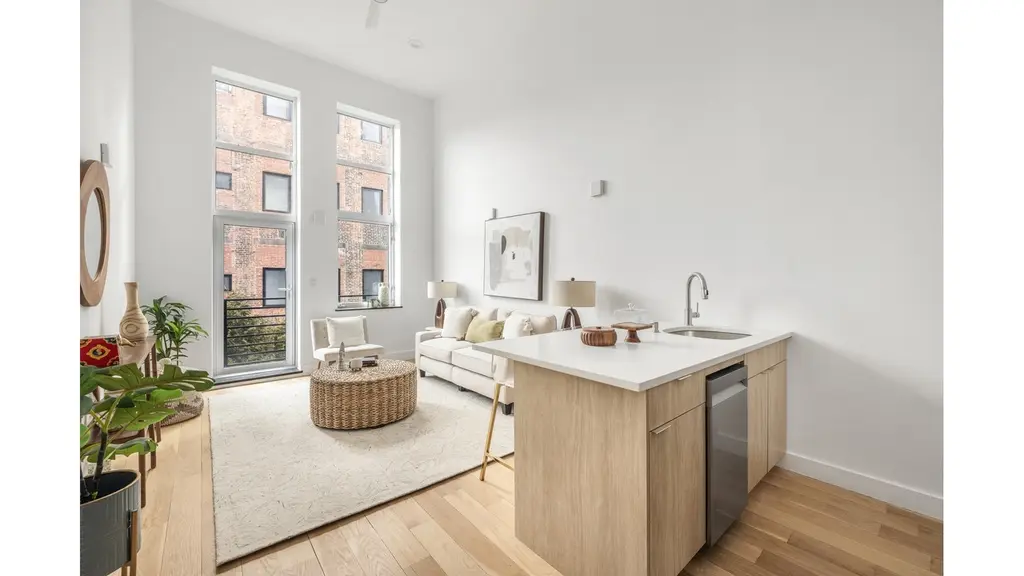
Listing remarks
OPEN HOUSE IS BY APPOINTMENT ONLY Massive 1BR + home office with double-height ceilings and exceptional light. This unique top-floor residence features two private balconies, a skylight, central air, and in-unit laundry. Oversized windows flood the space with natural light and offer open skyline views of Downtown Brooklyn. Entry is through a spacious home office or flex room overlooking Waverly, leading up to the main living area where both the living room and bedroom enjoy soaring ceilings and their own private balconies. A lofted upper level provides additional storage and houses the laundry and mechanicals. Quiet, bright, and unlike anything else on the market. The tax Perfectly locat
Key facts
- In-unit laundry
- Open skyline views
- Central air
Tags
Property features AI
Finance
- Other: Pets are not allowed in the building
- Financial info: Building contains 10 total units
- HOA & community: Monthly association fee of $339
Exterior
- Home design: 4-story building; Entry on 3rd level; Zoning: R6B
- Construction: Has a view
- Exterior features: No notable exterior features listed; North and South exposures
Interior
- Bathrooms: 1 full bathroom
- Interior features: Total of 4 rooms; Basement: Other; Unit has a view
- Laundry & utility: Washer hookup in unit; Building does not provide laundry
Neighborhood map
What this means for you Summary
Snapshot
- This is a 1-bed/1.0-bath condo listed at $790k.
Deal economics
- At list price, monthly cash flow is $-2k ($-25k/yr) — negative.
- To cash-flow at today's rent, offer at most $492k (37.8% below list).
- To meet the 1% rule (rent ≥ 1% of price), the offer needs to be $473k (40.1% below list).
- Recommended offer: $473k (40.1% below list) — sets the bar for 1% rule.
- Cap rate 3.2% vs local median 2.6% in New York — meaningfully above typical; check what's discounted (condition, days-on-market, listing class) to confirm the premium yield is real.
Location & tenants
- Location reads 75/100 on livability (#268 in NY, #4,188 nationally) — a middle-class / working-renter tenant base. Strengths: amenities A+, commute A+, health & safety A; Watch: crime F, cost of living F.
- Zoned schools: Elm Tree Elementary School (math 27% / reading 52%, grade F, #1,444 of 2,108 statewide, top 71%, 806 students, 94% FRL); Jhs 383 Philippa Schuyler (math 32% / reading 67%, grade C, #280 of 729 statewide, top 40%, 822 students, 85% FRL); Midwood High School (math 94% / reading 96%, grade A+, #83 of 1,100 statewide, top 8%, 4,062 students, 73% FRL).
- Market conditions: Rents rising fast (+8.6%/yr); 89 active listings in the ZIP; 25 comparable units currently listed for rent nearby; rentals leasing fast (median 4d on market — plan ~1-2 weeks tenant-placement turnaround); solid renter incomes; 10,063 units permitted in Kings County in 2024 (9,789 in 5+ unit buildings).
- At $4,731/mo this rent would consume 60% of the median local household income ($94k/yr) (locally 3544% of renters already pay >50% of income on rent) — very limited rent-growth headroom before tenants either downsize or default.
Forward outlook
- In year one you build about $84k of equity ($5k loan paydown + $79k appreciation (10.0% local appreciation)).
- Kings County population projected at +13% by 2050 — modest demand growth; plan on rents tracking national, not racing it.
- By year 2, paydown + projected appreciation supports a ~$136k cash-out refi (75% LTV) — recoverable capital for the next deal without selling this one.
Negotiation context
- It's been on market 48 days — a 3% lower offer ($766k) is reasonable based on typical stale-listing flexibility.
Risks & watch-outs
- Climate carrying-cost: major wind risk, 27% chance of damaging wind over 30y; extreme-heat days projected 7→15/yr by 2055 (HVAC capex compounding) — expect insurance premiums to compound above CPI over the hold.
Questions for the listing agent
- What do current leases actually rent for vs. the listed asking? Can we see a recent rent roll and the last 12 months of T-12 income?
- It's been on market 48 days. Have you received any prior offers? Is the seller open to a 40% concession, seller financing, or rate buy-down credit?
- What does the HOA fee cover, when was the last increase, and are there any pending special assessments or reserve-fund shortfalls?
- Any open or pending special assessments — roof, HVAC, plumbing, elevator, façade? What's the per-unit balance and payoff schedule, and is the seller paying it off at close or rolling it to the buyer?
- Is there a deadline driving the sale (1031 exchange, divorce, estate, relocation)? That informs how much negotiation room exists.
- Schools are B-rated — typically a magnet for longer-tenancy family renters. What's the average tenant stay here, and is there a school-zone premium baked into asking?
- Crime grade is F in this area — have there been break-ins, vandalism, or insurance claims at this property in the last 3 years? What carrier currently insures it and at what premium?
- The area grade is low — what's the realistic commute time and amenity access for the typical tenant pool here? Any planned neighborhood developments (good or bad) we should know about?
- What's the average days-on-market for RENTAL listings here right now (not sales)? A rising rental-DOM trend means longer vacancies and softer asking-rent achievability than the comps imply.
- What's the recent tenant-quality profile in this submarket — average credit score on applications, eviction rate, late-payment / NSF rate, and stable-employment percentage? A property-management company in the area should have these aggregated.
- How much new apartment / multifamily construction is in the pipeline within 1–3 miles? Heavy new supply (>2% of stock underway) typically softens rents 12–24 months out; light construction supports rent growth.
Investment metrics
- 1% rule
- 0.60% ✗
- Cap rate
- 3.16%
- Cash-on-cash
- -11.18%
- DSCR
- 0.50
- GRM
- 13.9
CMA / ARV
No comps found within radius.
Projected returns pro-forma
10.0% appreciation · 8.0% rent growth · sell at horizon
- IRR
- 17.7%
- Equity multiple
- 2.47×
- Total profit
- $324,269
- Equity at exit
- $711,695
- IRR
- 17.6%
- Equity multiple
- 6.07×
- Total profit
- $1,120,642
- Equity at exit
- $1,534,796
Cash invested: $221,200 (down + closing). Projections, not guarantees.
Landlord ↔ Tenant lean methodology
- Overall (CITY)
- 0 Strongly Tenant-Friendly
- State New York
- 15 Strongly Tenant-Friendly · D+10
- County
- — inherits STATE
- City New York
- 0 Strongly Tenant-Friendly · D+34
ZIP-level market 11205
- Home prices YoY
- 2.1%
- Rents YoY
- 8.6%
- Active inventory
- 89
- Price-to-rent
- 13.9×
Monthly cashflow live
- Estimated rent
- $4,731 high interval (Pro) →
- Mortgage (P&I)
- −$4,143
- Tax est. 1.5%
- −$988 /mo · $11,850/yr
- Insurance
- −$329
- HOA
- −$339
- Vacancy / Maint / Mgmt
- −$994
- Net cashflow
- $-2,061
Break-even live
Sensitivity live
| Price | -10% $-1,515 | -5% $-1,788 | +0% $-2,061 | +5% $-2,334 | +10% $-2,607 |
|---|---|---|---|---|---|
| Rent | -10% $-2,435 | -5% $-2,248 | +0% $-2,061 | +5% $-1,874 | +10% $-1,687 |
| Rate | -1.0pp $-1,663 | -0.5pp $-1,860 | base $-2,061 | +0.5pp $-2,266 | +1.0pp $-2,474 |
UW: 25.0% down · 7.5% · 30yr · 1.5% tax · 5.0% vac · 8.0% maint · 8.0% mgmt
Financing live
Cash to close
- Down payment
- $197,500
- Closing costs
- $23,700
- Reserves months
- —
- Total cash needed
- —
Loan-product check · same deal, 3 products live
Conventional
25% down · 7.5% · 30yr
- Down + closing
- —
- Monthly P&I
- —
- Monthly cashflow
- —
- DSCR
- —
- Eligible?
- —
Personal DTI + credit; lowest rate.
DSCR
20% down · 8.5% · 30yr
- Down + closing
- —
- Monthly P&I
- —
- Monthly cashflow
- —
- DSCR
- —
- Eligible?
- —
No personal income docs; deal must DSCR.
Hard money
10% down · 12.0% · 12mo
- Down + closing
- —
- Monthly P&I
- —
- Monthly cashflow
- —
- DSCR
- —
- Eligible?
- —
Short-term bridge; refi at stabilization.
Rent comps 25 comps
| Address | Beds | Baths | Sqft | Rent | $/sqft | DOM | Units | Dist |
|---|---|---|---|---|---|---|---|---|
| 196 Willoughby St Brooklyn, NY | 2.0 | 1.0–2.0 | 717 | $6,146 | $8.57 | 0d | 7 | 0.67mi |
| 343 Gold St Brooklyn, NY | 3.0 | 1.0–2.0 | 903 | $5,053 | $5.59 | 6d | 1 | 0.78mi |
| 151 S Elliott Pl Brooklyn, NY | 1.0–2.0 | 1.0–2.0 | 655 | $4,670 | $7.13 | 3d | 2 | 0.80mi |
| 475 Clermont Ave Brooklyn, NY | 2.0 | 1.0–2.0 | 807 | $5,144 | $6.37 | 0d | 6 | 0.81mi |
| 540 Fulton St #1729 Brooklyn, NY | 3.0 | 1.0–2.0 | 750 | $5,737 | $7.65 | 26d | 4 | 0.81mi |
| 61 Duffield St Unit 1 Brooklyn, NY | 2.0 | 1.0 | 1200 | $5,000 | $4.17 | 26d | 1 | 0.84mi |
| 482 Kent Ave Brooklyn, NY | 2.0 | 1.0–2.0 | 750 | $6,555 | $8.74 | 1d | 3 | 0.86mi |
| 478 Kent Ave Brooklyn, NY | 2.0 | 1.0–2.0 | 775 | $5,920 | $7.64 | 4d | 3 | 0.86mi |
| 333 Schermerhorn St Brooklyn, NY | 1.0 | 1.0 | 585 | $6,782 | $11.58 | 0d | 15 | 0.87mi |
| 545 Vanderbilt Ave Brooklyn, NY | 2.0 | 1.0 | 600 | $4,910 | $8.18 | 4d | 3 | 0.88mi |
| 214 Duffield St Brooklyn, NY | 3.0 | 1.0–2.0 | 956 | $5,049 | $5.28 | 0d | 1 | 0.89mi |
| 11 Wharf Way Brooklyn, NY | 1.0 | 1.0 | 610 | $4,870 | $7.98 | 1d | 2 | 0.90mi |
| 100 Willoughby St Brooklyn, NY | 3.0 | 1.0–2.0 | 892 | $5,232 | $5.87 | 9d | 1 | 0.91mi |
| 111 Lawrence St Brooklyn, NY | 3.0 | 1.0–2.0 | 950 | $4,385 | $4.61 | 0d | 22 | 0.96mi |
| 461 Dean St Brooklyn, NY | 1.0 | 1.0 | 781 | $5,320 | $6.81 | 6d | 5 | 0.97mi |
| 150 Lawrence St Brooklyn, NY | 1.0–2.0 | 1.0–2.0 | 700 | $4,130 | $5.90 | 1d | 2 | 1.00mi |
| 68 Gold St New York, NY | 1.0–2.0 | 1.0 | 700 | $3,610 | $5.16 | 26d | 2 | 1.01mi |
| 100 Jay St Unit 6B Brooklyn, NY | 1.0 | 1.0 | 800 | $4,600 | $5.75 | 26d | 1 | 1.11mi |
| 180 Montague St Brooklyn, NY | 3.0 | 1.0–2.0 | 901 | $5,353 | $5.94 | 1d | 12 | 1.26mi |
| 241 Atlantic Ave #879 Brooklyn, NY | 1.0–3.0 | 1.0–2.0 | 1098 | $5,490 | $5.00 | 1d | 3 | 1.27mi |
| 250 Union Ave #2119 Brooklyn, NY | 1.0–2.0 | 1.0 | 590 | $3,500 | $5.93 | 26d | 2 | 1.28mi |
| 141 Joralemon St #819 Brooklyn, NY | 1.0–3.0 | 1.0–2.0 | 750 | $5,010 | $6.68 | 1d | 3 | 1.35mi |
| 655 Union St #1846 Brooklyn, NY | 1.0–2.0 | 1.0–2.0 | 727 | $5,780 | $7.95 | 4d | 2 | 1.44mi |
| 755 Washington Ave Brooklyn, NY | 1.0 | 1.0 | 700 | $1,800 | $2.57 | 22d | 1 | 1.46mi |
| 107 Columbia Hts #1757 Brooklyn, NY | 1.0–2.0 | 1.0–2.0 | 708 | $5,650 | $7.98 | 1d | 2 | 1.47mi |
HOA detail condo
- Monthly dues
- $339 · $4,068/yr
- Assessments
- None detected in remarks — confirm with the listing agent.
Listing history 8 events
-
2026-06-10days on market $790,000 Active 48 DOM
-
2026-06-08days on market $790,000 Active 47 DOM
-
2026-06-08days on market $790,000 Active 46 DOM
-
2026-06-04days on market $790,000 Active 43 DOM
-
2026-06-03days on market $790,000 Active 42 DOM
-
2026-06-01days on market $790,000 Active 40 DOM
-
2026-05-31days on market $790,000 Active 39 DOM
-
2026-04-22$790,000 Active
ⓘ Source: listings_history table (triggers on properties + properties_extension) + one-shot
backfill from property_details.listing_events for pre-trigger history.
Climate risk First Street
- Flood 1/10 Low FEMA zone X (unshaded) · 0% chance over 30 yrs
- Wildfire 1/10 Low
- Heat 6/10 Major 7 d/yr ≥99°F today · 15 d/yr by 30 yrs out
- Wind 6/10 Major 27% chance of damaging wind over 30 yrs
- Air quality 4/10 Moderate 5 unhealthy d/yr today · 7 by 30 yrs out
Nearby sold comps map
Loading sold comps map…
Walkable amenities ~0.75 mi
Loading nearby amenities…
Taxation est. · year 1
- Rental income
- $56,772
- − Mortgage interest
- −$44,252
- − Property taxes
- −$11,850
- − Insurance
- −$3,950
- − Repairs & maintenance
- −$4,542
- − Management
- −$4,542
- − HOA
- −$4,068
- − Depreciation
- −$22,982
- Taxable loss
- −$39,414
- Est. tax savings @ 24.0%
- +$9,459
- After-tax cash flow
- $-15,273/yr
For passive investors: Depreciation is non-cash, so a rental often shows a tax loss while cash-flowing — sheltering income. Rental losses are passive: they offset passive income freely, and up to $25,000/yr can offset ordinary (W-2) income if you actively participate and your MAGI is under $100k (phasing out to $0 by $150k); unused losses carry forward. On sale, claimed depreciation is recaptured at up to 25%, and gains may owe capital-gains tax (a 1031 exchange can defer both). Figures are a year-1 estimate at your 24.0% rate — not tax advice; consult a CPA.
Schools (NCES district)
No district data.
Livability — New York
- Score
- 75/100
- State rank
- #268
- US rank
- #4188
Category grades
Schools grade is shown separately in the Schools card above.
Census & demographics
- Census place
- New York, NY
- County
- Kings County · 2,614,986 people
- City population
- 7,731,280
- Metro
- New York-Newark-Jersey City, NY-NJ-PA
- Population (ZIP)
- 51,676
- Household income
- $93,887
- Rent vs Own
- Severe rent burden
- 3544.0
Population outlook (Kings County) Hauer SSP2
- Today (2025)
- 2,847,441 people
- By 2030
- 2,937,006 · +3.1%
- By 2040
- 3,095,491 · +8.7%
- By 2050
- 3,228,968 · +13.4%
- By 2075
- 3,321,723 · +16.7%
- By 2100
- 3,111,387 · +9.3%
Race, ethnicity, and origin ACS 2023
- Neighborhood character
- Diverse neighborhood (Simpson 0.66)
- Race & ethnicity
- White 52% Black 20% Hispanic / Latino 15% Two or more races 10% Asian 7%
- Hispanic origin (detail)
- Mexican 3% Puerto Rican 5% Dominican 3%
- Common ancestry
- Italian 4% Scandinavian 3% Romanian 2%
- Foreign-born
- 16% · Canada, China, South Korea
- Languages at home
- 57% English-only · German/W. Germanic 21% Spanish 11% Chinese 4%
Political lean MEDSL · Kings
- 2024 margin
- Solid D (+44.0) · D 72.0% · R 28.0%
- 2008→2024 swing
- -15.5pp toward R · 2008: 59.4pp · 2024: 44.0pp
- All cycles
- 2024: D+44.0 2020: D+54.8 2016: D+61.8 2012: D+63.9 2008: D+59.4
Not yet ingested
- Civics
- —
Market trends
- HPI YoY
- ▲ 12.40%
- Current HPI
- 605.3512
- Rent YoY
- ▲ 8.61%
- Metro
- New York-Newark-Jersey City, NY-NJ-PA
- State GDP YoY
- ▲ 2.60%
- F500 in state
- 92
Industry mix (Fortune 500 HQ in NY)
| Industry | F500 HQs | Revenue |
|---|---|---|
| Financial Services | 10 | $950B |
|
||
| Consumer Goods | 9 | $162B |
|
||
| Insurance | 4 | $225B |
|
||
| Telecommunications | 2 | $144B |
|
||
| Pharmaceuticals | 2 | $112B |
|
||
| Media / Entertainment | 2 | $69B |
|
||
Price history
1 event — show timeline
- 2026-04-22 Listed $790,000 RLS at REBNY
Cash-flow waterfall
monthlySold comps — $/sqft
last 12 mo · ≤1 miLoading sold comps…