 🏷️ Likely Rental
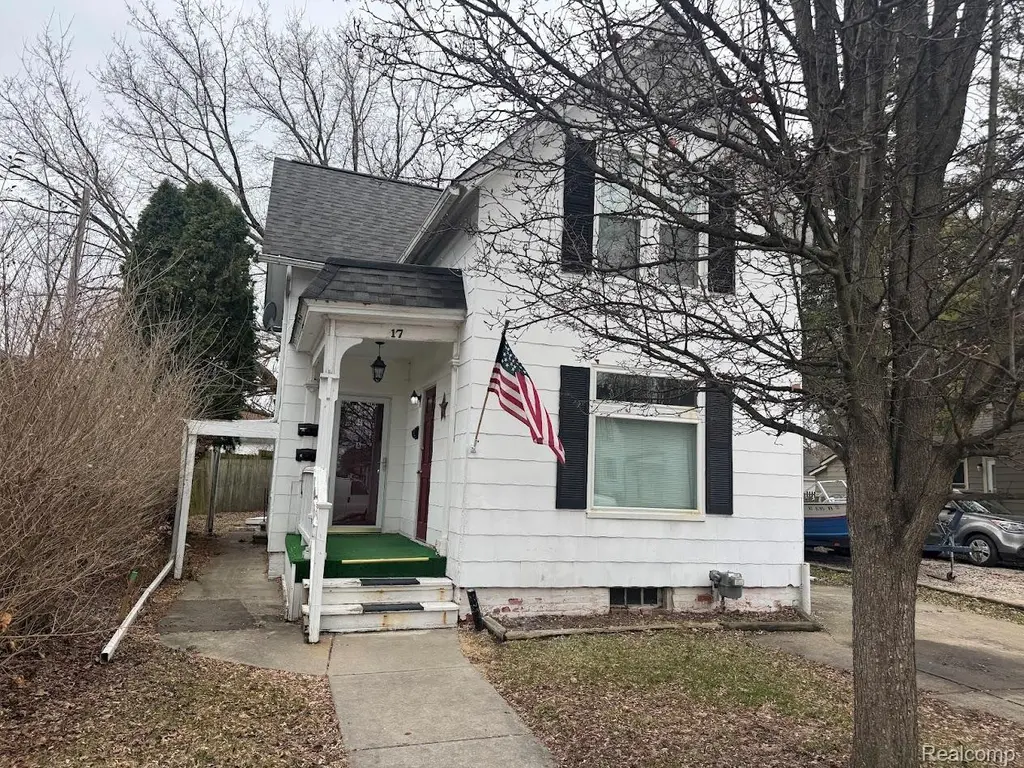
17 Stapleton St · Mount Clemens, MI
Flood risk 1/10 · Minimal
- FEMA flood zone
- X (unshaded)
- Chance of flooding over 30 yrs
- 0.0%
- Est. flood insurance / yr
- $473 – $860
Fire risk 1/10 · Minimal
- Est. fire insurance / yr
- $784 – $1,456
Heat risk 3/10 · Minor
- Hot days now (above 96°F)
- 7 days/yr
- Hot days in 30 yrs
- 15 days/yr
Wind risk 1/10 · Minimal
- Chance of severe wind over 30 yrs
- —
Air-quality risk 4/10 · Minor
- Unhealthy air days now
- 4 days/yr
- Unhealthy air days in 30 yrs
- 6 days/yr
Risk factors via First Street. Map © Google.
Why this score? — see what drove the C+ grade
The composite is a weighted blend of 9 inputs, each scored 0–100. Each bar is that input's sub-score; the figure is the points it added to the 100-point composite (weight × sub-score).
- Cash flow +21.2/30.0
- ARV discount +15.0/15.0
- 1% rule +7.6/10.0
- DSCR +6.8/10.0
- Rent growth +5.0/5.0
- Livability +3.9/5.0
- Condition / age +2.5/5.0
- Schools +0.6/10.0
- Appreciation +0.0/10.0
$150,000
🖨 Deal sheet (PDF) 📄 Offer letter ✓ Due diligence
Listing remarks MLS
Exceptional investment opportunity in Mount Clemens’ historic district. This three-unit multifamily property offers strong income potential with separate utilities, private entrances, and flexible occupancy options. The layout includes one 2-bedroom unit, one 1-bedroom unit, and one efficiency. Unit A – Ground Level (2 Bedroom, Vacant) • Freshly painted walls • New light fixtures • Includes refrigerator Unit B – Upper Level (1 Bedroom, Occupied) • Long-term tenant since 2022, pays on time • Month-to-month lease • Well-maintained and in good condition • Tenant willing to stay or vacate if needed Unit C – Ground Level (Efficiency, Vacant) • New flooring • New light fixtures • New backsplash • Freshly painted • Includes stove and refrigerator Additional highlights: • Rental certification in 2025 • Historic building in a charming, established neighborhood • Ideal for investors seeking cash flow or owner-occupants looking to live in one unit and rent the others This is a versatile, income-producing property with immediate upside—perfect for expanding or starting your rental portfolio.
Key facts
- Separate utilities
- Private entrances
- Historic district
Tags
Neighborhood map
What this means for you Summary
Snapshot
- This is a 4-bed/4.0-bath single-family listed at $150k.
Deal economics
- At list price, monthly cash flow is $216 ($3k/yr) — positive.
- The deal already cash-flows at list — no discount required.
- Meets the 1% rule at list price ($2k rent vs $150k).
- Recommended offer: $141k (6.0% below list) — sets the bar for market timing.
- Cap rate 8.0% vs local median 3.0% in Mount Clemens — top-decile yield for the area; either an underpriced asset or a hidden risk that comps aren't pricing in. Stress-test before assuming the spread holds.
Location & tenants
- Location reads 77/100 on livability (#120 in MI, #2,918 nationally) — a middle-class / working-renter tenant base. Strengths: commute A+, cost of living A+, housing A+; Watch: crime D+, amenities D+, employment D-.
- Mount Clemens Community School District (suburban): math 4% / reading 11% proficiency, ranked #532 of 540 in MI (top 98%) — low school quality limits family demand, transient renter base, plan for 1-2y turnover; 80% free/reduced lunch — lower-income household profile, screen leases tightly.
- Zoned schools: Seminole Academy (math 2% / reading 8%, grade F, #1,325 of 1,397 statewide, top 99%, 370 students, 94% FRL); Mount Clemens Middle School (math 2% / reading 12%, grade F, #481 of 493 statewide, top 98%, 151 students, 94% FRL); Mount Clemens High School (math 10% / reading 30%, grade F, #596 of 713 statewide, top 86%, 203 students, 90% FRL).
- Market conditions: Rents rising fast (+10.8%/yr); 69 active listings in the ZIP; 2 comparable units currently listed for rent nearby; 1,321 units permitted in Macomb County in 2024 (86 in 5+ unit buildings).
- This rent runs 44% of the median local income ($52k/yr) — at the standard rent-burdened threshold; future hikes will face affordability resistance.
Forward outlook
- Local home prices are declining (-3.0%/yr); year-one equity from $1k of loan paydown is wiped out by about $4k of value loss. Plan a longer hold.
- Macomb County population projected at +9% by 2050 — modest demand growth; plan on rents tracking national, not racing it.
- At projected returns (-3.0% appreciation + 8.0% rent growth), your $42k cash investment doubles in ~8 years — after that, you're playing with house money.
Negotiation context
- It's been on market 88 days — a 6% lower offer ($141k) is reasonable based on typical stale-listing flexibility.
- 7 sale attempts since 8y ago with the ask held roughly flat each time — persistent listings suggest the price (not the market) is what's stuck; bring a comps-based counter.
- Current owner paid $80k; list at $150k implies a 88% gain — meaningful room to come down on a strong offer.
Risks & watch-outs
- Watch-outs: property tax is 3.5% of price; built in 1900 — expect roof / HVAC / electrical / plumbing capex.
Questions for the listing agent
- It's been on market 88 days. Have you received any prior offers? Is the seller open to a 6% concession, seller financing, or rate buy-down credit?
- Built in 1900 — when were the roof, HVAC, electrical panel, plumbing, and water heater last replaced?
- Property tax is high relative to price — has the assessment been appealed recently, and will the sale trigger a re-assessment?
- Why hasn't it sold? Are there any deal-killer items the seller is aware of (foundation, flood, title, zoning, code violations)?
- Is there a deadline driving the sale (1031 exchange, divorce, estate, relocation)? That informs how much negotiation room exists.
- Schools are D-rated, which usually means shorter tenancies and higher turnover. Who's the typical renter profile here, and what's been the actual vacancy rate?
- Crime grade is D in this area — have there been break-ins, vandalism, or insurance claims at this property in the last 3 years? What carrier currently insures it and at what premium?
- What's the average days-on-market for RENTAL listings here right now (not sales)? A rising rental-DOM trend means longer vacancies and softer asking-rent achievability than the comps imply.
- What's the recent tenant-quality profile in this submarket — average credit score on applications, eviction rate, late-payment / NSF rate, and stable-employment percentage? A property-management company in the area should have these aggregated.
- How much new for-sale + rental construction is in the pipeline within 1–3 miles? Heavy new supply typically softens prices + rents 12–24 months out; constrained supply supports both.
Investment metrics
- 1% rule
- 1.26% ✓
- Cap rate
- 8.02%
- Cash-on-cash
- 6.18%
- DSCR
- 1.28
- GRM
- 6.6
CMA / ARV
- ARV (median comp)
- $245,642
- List price
- $150,000
- Delta
- -38.94%
- Verdict
- UNDERPRICED
- Comps
- 20 within 1.0 mi
Show comp detail 12 sales within ~0.75 mi
| Address | Dist | Beds/Ba | Sqft | Sold | Price | $/sf | Match |
|---|---|---|---|---|---|---|---|
| 146 North Ave | 0.10mi | 4/3.0 | 1,985 (-4%) | 1mo | $295,000 | $149 | 84 |
| 261 Jones St | 0.19mi | 4/2.0 | 2,198 (+6%) | 2mo | $310,500 | $141 | 71 |
| 219 N Walnut St | 0.37mi | 4/2.0 | 2,114 (+2%) | 7mo | $175,000 | $83 | 66 |
| 58 Kendrick St | 0.26mi | 3/1.5 (-1) | 2,139 (+3%) | 5mo | $255,000 | $119 | 63 |
| 225 Euclid St | 0.34mi | 4/2.5 | 1,949 (-6%) | 8mo | $285,000 | $146 | 62 |
| 245 N Walnut St | 0.44mi | 3/2.0 (-1) | 2,015 (-3%) | 3mo | $230,000 | $114 | 60 |
| 94 Kendrick St | 0.35mi | 4/2.5 | 2,370 (+14%) | 4mo | $315,000 | $133 | 50 |
| 95 High St | 0.43mi | 3/2.0 (-1) | 1,906 (-8%) | 7mo | $260,000 | $136 | 48 |
| 59 Canfield Dr | 0.64mi | 3/2.0 (-1) | 1,826 (-12%) | 2mo | $245,000 | $134 | 36 |
| 235 N Broadway St | 0.54mi | 3/1.0 (-1) | 2,300 (+11%) | 5mo | $145,000 | $63 | 36 |
| 43 Rathbone St S | 0.74mi | 4/2.0 | 1,800 (-13%) | 1mo | $266,000 | $148 | 35 |
| 38 Riverside Dr | 0.66mi | 3/3.0 (-1) | 1,800 (-13%) | 5mo | $300,000 | $167 | 34 |
Match score weights: distance 35% · size 25% · config 20% · recency 20%. Top-matched comps best support the ARV.
Projected returns pro-forma
-3.0% appreciation · 8.0% rent growth · sell at horizon
- IRR
- -0.2%
- Equity multiple
- 0.99×
- Total profit
- $-324
- Equity at exit
- $22,365
- IRR
- 14.8%
- Equity multiple
- 2.52×
- Total profit
- $63,807
- Equity at exit
- $12,969
Cash invested: $42,000 (down + closing). Projections, not guarantees.
Landlord ↔ Tenant lean methodology
- Overall (STATE)
- 62 Landlord-Friendly
- State Michigan
- 62 Landlord-Friendly · EVEN
- County
- — inherits STATE
- City
- — inherits STATE
ZIP-level market 48043
- Rents YoY
- 10.8%
- Active inventory
- 69
- Price-to-rent
- 6.6×
Monthly cashflow live
- Estimated rent
- $1,896 medium interval (Pro) →
- Mortgage (P&I)
- −$787
- Tax from tax record
- −$433 /mo · $5,192/yr
- Insurance
- −$62
- HOA
- −$0
- Vacancy / Maint / Mgmt
- −$398
- Net cashflow
- $216
Break-even live
Sensitivity live
| Price | -10% $301 | -5% $259 | +0% $216 | +5% $174 | +10% $131 |
|---|---|---|---|---|---|
| Rent | -10% $67 | -5% $141 | +0% $216 | +5% $291 | +10% $366 |
| Rate | -1.0pp $292 | -0.5pp $255 | base $216 | +0.5pp $178 | +1.0pp $138 |
UW: 25.0% down · 7.5% · 30yr · 1.5% tax · 5.0% vac · 8.0% maint · 8.0% mgmt
Financing live
Cash to close
- Down payment
- $37,500
- Closing costs
- $4,500
- Reserves months
- —
- Total cash needed
- —
Loan-product check · same deal, 3 products live
Conventional
25% down · 7.5% · 30yr
- Down + closing
- —
- Monthly P&I
- —
- Monthly cashflow
- —
- DSCR
- —
- Eligible?
- —
Personal DTI + credit; lowest rate.
DSCR
20% down · 8.5% · 30yr
- Down + closing
- —
- Monthly P&I
- —
- Monthly cashflow
- —
- DSCR
- —
- Eligible?
- —
No personal income docs; deal must DSCR.
Hard money
10% down · 12.0% · 12mo
- Down + closing
- —
- Monthly P&I
- —
- Monthly cashflow
- —
- DSCR
- —
- Eligible?
- —
Short-term bridge; refi at stabilization.
Rent comps 2 comps
| Address | Beds | Baths | Sqft | Rent | $/sqft | DOM | Units | Dist |
|---|---|---|---|---|---|---|---|---|
| 40 Ferrin Pl Mount Clemens, MI | 3.0 | 1.0 | 1400 | $1,700 | $1.21 | 0d | 1 | 0.25mi |
| 42510 Pinehurst Dr Clinton Twp, MI | 3.0 | 2.5 | 1845 | $2,600 | $1.41 | 6d | 1 | 1.36mi |
Listing history 30 events
-
2026-06-21days on market $150,000 Active 88 DOM
-
2026-06-18days on market $150,000 Active 85 DOM
-
2026-06-17days on market $150,000 Active 84 DOM
-
2026-06-16days on market $150,000 Active 83 DOM
-
2026-06-15days on market $150,000 Active 82 DOM
-
2026-06-13days on market $150,000 Active 80 DOM
-
2026-06-13days on market $150,000 Active 79 DOM
-
2026-06-09days on market $150,000 Active 76 DOM
-
2026-06-08days on market $150,000 Active 75 DOM
-
2026-06-07days on market $150,000 Active 74 DOM
-
2026-06-04days on market $150,000 Active 71 DOM
-
2026-06-03days on market $150,000 Active 70 DOM
-
2026-06-02days on market $150,000 Active 69 DOM
-
2026-06-01days on market $150,000 Active 68 DOM
-
2026-05-31days on market $150,000 Active 67 DOM
-
2026-03-25$150,000 Active 1201-char remark
Show marketing remark (1425 chars)
Exceptional investment opportunity in Mount Clemens' historic district. This three-unit multifamily property offers strong income potential with separate utilities, private entrances, and flexible occupancy options. The layout includes one 2-bedroom unit, one 1-bedroom unit, and one efficiency. Unit A – Ground Level (2 Bedroom, Vacant) • Freshly painted walls • New light fixtures • Includes refrigerator Unit B – Upper Level (1 Bedroom, Occupied) • Long-term tenant since 2022, pays on time • Month-to-month lease • Well-maintained and in good condition • Tenant willing to stay or vacate if needed Unit C – Ground Level (Efficiency, Vacant) • New flooring • New light fixtures • New backsplash • Freshly painted • Includes stove and refrigerator Additional highlights: • Rental certification in 2025 • Historic building in a charming, established neighborhood • Ideal for investors seeking cash flow or owner-occupants looking to live in one unit and rent the others This is a versatile, income-producing property with immediate upside - perfect for expanding or starting your rental portfolio.
-
2026-03-25$150,000 Active 1425-char remark
Show marketing remark (1425 chars)
Exceptional investment opportunity in Mount Clemens' historic district. This three-unit multifamily property offers strong income potential with separate utilities, private entrances, and flexible occupancy options. The layout includes one 2-bedroom unit, one 1-bedroom unit, and one efficiency. Unit A – Ground Level (2 Bedroom, Vacant) • Freshly painted walls • New light fixtures • Includes refrigerator Unit B – Upper Level (1 Bedroom, Occupied) • Long-term tenant since 2022, pays on time • Month-to-month lease • Well-maintained and in good condition • Tenant willing to stay or vacate if needed Unit C – Ground Level (Efficiency, Vacant) • New flooring • New light fixtures • New backsplash • Freshly painted • Includes stove and refrigerator Additional highlights: • Rental certification in 2025 • Historic building in a charming, established neighborhood • Ideal for investors seeking cash flow or owner-occupants looking to live in one unit and rent the others This is a versatile, income-producing property with immediate upside - perfect for expanding or starting your rental portfolio.
-
2019-03-12soldstatus $80,000
-
2019-03-06soldstatus $80,000 Closed
-
2019-03-06soldstatus $80,000
-
2019-01-22status Pending
-
2018-12-26$85,000 Active
-
2018-12-26$85,000
-
2018-12-26historical
-
2018-12-26historical
-
2018-10-05price $90,000
-
2018-10-04status Active
-
2018-09-25status Pending
-
2018-08-14$95,000 Active
-
2018-08-14$90,000
ⓘ Source: listings_history table (triggers on properties + properties_extension) + one-shot
backfill from property_details.listing_events for pre-trigger history.
Tax reassessment forecast MI · Partial reset (capped growth)
- Current annual tax
- $5,192 · $433/mo
- Projected year-2 tax
- $5,192 · $433/mo
- Expected delta
- $0/yr ($0/mo · 0.0%)
ⓘ Screening estimate from a state-policy table — verify with the county assessor before closing.
Climate risk First Street
- Flood 1/10 Low FEMA zone X (unshaded) · 0% chance over 30 yrs
- Wildfire 1/10 Low
- Heat 3/10 Moderate 7 d/yr ≥96°F today · 15 d/yr by 30 yrs out
- Wind 1/10 Low
- Air quality 4/10 Moderate 4 unhealthy d/yr today · 6 by 30 yrs out
Nearby sold comps map
Loading sold comps map…
Walkable amenities ~0.75 mi
Loading nearby amenities…
Taxation est. · year 1
- Rental income
- $22,757
- − Mortgage interest
- −$8,402
- − Property taxes
- −$5,192
- − Insurance
- −$750
- − Repairs & maintenance
- −$1,821
- − Management
- −$1,821
- − Depreciation
- −$4,364
- Taxable income
- $408
- Est. tax owed @ 24.0%
- −$98
- After-tax cash flow
- $2,499/yr
For passive investors: Depreciation is non-cash, so a rental often shows a tax loss while cash-flowing — sheltering income. Rental losses are passive: they offset passive income freely, and up to $25,000/yr can offset ordinary (W-2) income if you actively participate and your MAGI is under $100k (phasing out to $0 by $150k); unused losses carry forward. On sale, claimed depreciation is recaptured at up to 25%, and gains may owe capital-gains tax (a 1031 exchange can defer both). Figures are a year-1 estimate at your 24.0% rate — not tax advice; consult a CPA.
Schools (NCES district)
- District
- Mount Clemens Community School District
- NCES district ID
- 2624690
- Math proficiency
- 4% ▼ -9.00%
- Reading proficiency
- 11% ▼ -7.00%
- Median HH income
- $36,632
- Composite
- 6.25/100
- National rank
- #10005
- State rank
- #532 of 540 in MI
Livability — Mount Clemens
- Score
- 77/100
- State rank
- #120
- US rank
- #2918
Category grades
Schools grade is shown separately in the Schools card above.
Census & demographics
- Census place
- Mount Clemens, MI
- County
- Macomb County · 638,552 people
- City population
- 15,429
- Metro
- Detroit-Warren-Dearborn, MI
- Population (ZIP)
- 15,429
- Household income
- $52,161
- Rent vs Own
- Severe rent burden
- 610.0
Population outlook (Macomb County) Hauer SSP2
- Today (2025)
- 925,296 people
- By 2030
- 948,226 · +2.5%
- By 2040
- 983,961 · +6.3%
- By 2050
- 1,010,200 · +9.2%
- By 2075
- 1,076,222 · +16.3%
- By 2100
- 1,077,065 · +16.4%
Race, ethnicity, and origin ACS 2023
- Neighborhood character
- Majority White (65%)
- Race & ethnicity
- White 65% Black 22% Two or more races 10% Hispanic / Latino 4%
- Common ancestry
- Romanian 10% Lithuanian 4% Slovak 2%
- Foreign-born
- 2% · Canada
- Languages at home
- 96% English-only · Spanish 2% Russian/Polish/Slavic 1%
Political lean MEDSL · Macomb
- 2024 margin
- R (+13.7) · D 42.2% · R 55.9% · Other 1.9%
- 2008→2024 swing
- -22.3pp toward R · 2008: 8.6pp · 2024: -13.7pp
- All cycles
- 2024: R+13.7 2020: R+8.1 2016: R+11.6 2012: D+4.0 2008: D+8.6
Not yet ingested
- Civics
- —
Market trends
- HPI YoY
- ▼ -194.74%
- Current HPI
- 260.7139
- Rent YoY
- ▲ 10.82%
- Metro
- Detroit-Warren-Dearborn, MI
- State GDP YoY
- ▲ 1.37%
- F500 in state
- 28
Industry mix (Fortune 500 HQ in MI)
| Industry | F500 HQs | Revenue |
|---|---|---|
| Automotive Parts | 3 | $48B |
|
||
| Automotive | 2 | $372B |
|
||
| Chemicals | 1 | $45B |
|
||
| Automotive Retail | 1 | $29B |
|
||
| Healthcare / Medical Devices | 1 | $23B |
|
||
| Automotive Technology | 1 | $20B |
|
||
Price history
+57.9% since first listed15 events — show timeline
- 2026-03-25 Listed $150,000 MiRealSource-MiMLS
- 2026-03-25 Listed $150,000 REALCOMP
- 2019-03-12 Sold (Public Records) $80,000 Public Records
- 2019-03-06 Sold (MLS) $80,000 REALCOMP
- 2019-03-06 Sold (MLS) $80,000 MiRealSource-MiMLS
- 2019-01-22 Pending — MiRealSource-MiMLS
- 2018-12-26 Listing Removed — REALCOMP
- 2018-12-26 Listing Removed — MiRealSource-MiMLS
- 2018-12-26 Listed $85,000 REALCOMP
- 2018-12-26 Listed $85,000 MiRealSource-MiMLS
- 2018-10-05 Price Changed $90,000 MiRealSource-MiMLS
- 2018-10-04 Relisted — MiRealSource-MiMLS
- 2018-09-25 Pending — MiRealSource-MiMLS
- 2018-08-14 Listed $90,000 REALCOMP
- 2018-08-14 Listed $95,000 MiRealSource-MiMLS
Property tax history
+7.5%/yrLatest (2025): $5,192 · +0.9% YoY. Source: county tax records.
Cash-flow waterfall
monthlySold comps — $/sqft
last 12 mo · ≤1 miLoading sold comps…