 🏷️ Likely Rental
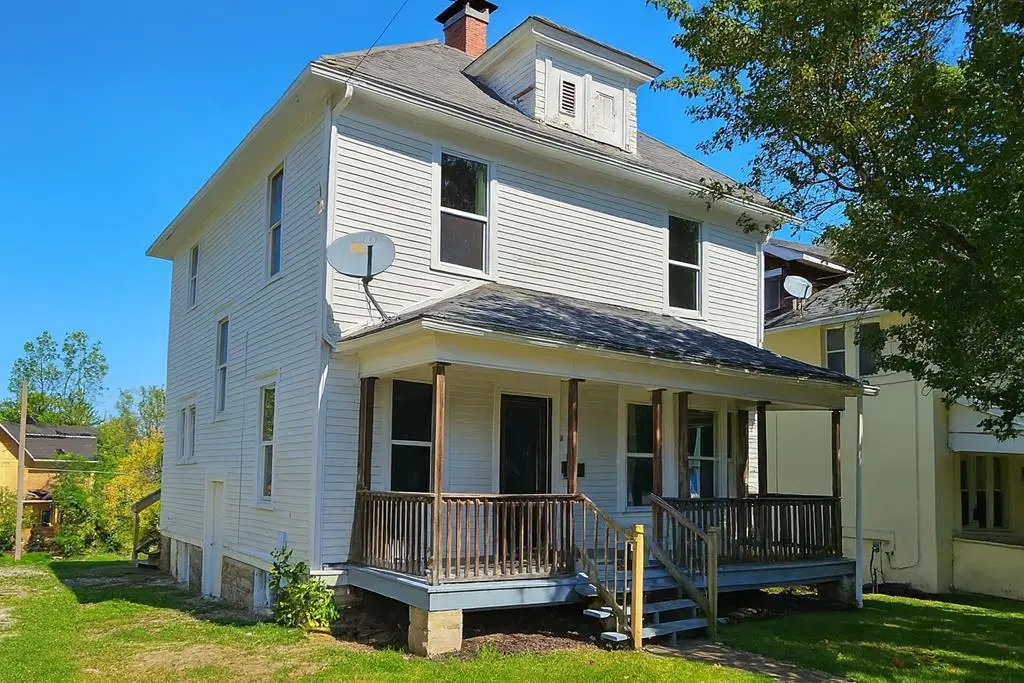
406 Sherman Pl · Mansfield, OH
Flood risk 1/10 · Minimal
- FEMA flood zone
- X (unshaded)
- Chance of flooding over 30 yrs
- 0.0%
- Est. flood insurance / yr
- $473 – $860
Fire risk 1/10 · Minimal
- Est. fire insurance / yr
- $713 – $1,323
Heat risk 3/10 · Minor
- Hot days now (above 96°F)
- 7 days/yr
- Hot days in 30 yrs
- 17 days/yr
Wind risk 2/10 · Minimal
- Chance of severe wind over 30 yrs
- —
Air-quality risk 2/10 · Minimal
- Unhealthy air days now
- 1 days/yr
- Unhealthy air days in 30 yrs
- 1 days/yr
Risk factors via First Street. Map © Google.
Why this score? — see what drove the C+ grade
The composite is a weighted blend of 9 inputs, each scored 0–100. Each bar is that input's sub-score; the figure is the points it added to the 100-point composite (weight × sub-score).
- Cash flow +24.4/30.0
- ARV discount +15.0/15.0
- DSCR +7.9/10.0
- 1% rule +5.7/10.0
- Livability +3.8/5.0
- Rent growth +2.5/5.0
- Condition / age +2.5/5.0
- Schools +2.3/10.0
- Appreciation +0.0/10.0
$100,000
🖨 Deal sheet 📄 Offer letter ✓ Due diligence
Listing remarks
Maintained rental property with 1,596 sq ft plus full basement with the potential to easily convert an additional finished space into a fourth bedroom to suit your needs. Gas log fireplace, double-pane windows, and new appliances added in 2025. Open deck and covered porch. Property is being made Metro-approved. Tenant in place at $1,125/mo great for immediate income. Clean , solid, and conveniently located. Due to a tenant being in place, we will be offering an open house in place of showings.
Key facts
- Covered porch
- Open deck
- Full basement
Tags
Property features AI
Exterior
- Utilities: Public water; Public sewer
- Home design: Single-family residence; Residential property
- Construction: Wood siding construction
- Exterior features: Composition roof
Interior
- Kitchen: Refrigerator; Oven; Range
- Bathrooms: 1 full bathroom
- Interior features: Gas log fireplace (one); Full basement
- Laundry & utility: Laundry in basement; Gas water heater
Neighborhood map
What this means for you Summary
Snapshot
- This is a 3-bed/1.0-bath single-family listed at $100k.
Deal economics
- At list price, monthly cash flow is $203 ($2k/yr) — positive.
- The deal already cash-flows at list — no discount required.
- Meets the 1% rule at list price ($1k rent vs $100k).
- Recommended offer: $98k (1.5% below list) — sets the bar for market timing.
- Cap rate 8.7% vs local median 4.2% in Mansfield — top-decile yield for the area; either an underpriced asset or a hidden risk that comps aren't pricing in. Stress-test before assuming the spread holds.
Location & tenants
- Location reads 76/100 on livability (#224 in OH, #3,525 nationally) — a middle-class / working-renter tenant base. Strengths: commute A+, cost of living A+, housing A+; Watch: schools C-, crime D-, amenities D-.
- Mansfield City (urban): math 24% / reading 33% proficiency, ranked #590 of 656 in OH (top 90%) — low school quality limits family demand, transient renter base, plan for 1-2y turnover; 80% free/reduced lunch — lower-income household profile, screen leases tightly.
- Market conditions: 122 active listings in the ZIP; 4 comparable units currently listed for rent nearby; rentals lingering (median 44d on market — plan ~5-8 weeks vacancy on turnover, expect pricing pressure); 100% of comp listings sitting > 30 days — soft ceiling on asking rent; 145 units permitted in Richland County in 2024 (0 in 5+ unit buildings).
Forward outlook
- Local home prices are declining (-3.0%/yr); year-one equity from $691 of loan paydown is wiped out by about $3k of value loss. Plan a longer hold.
- Richland County population projected at -18% by 2050 — secular population decline; favor cash flow + early exit over multi-decade hold.
Negotiation context
- It's been on market 30 days — a 2% lower offer ($98k) is reasonable based on typical stale-listing flexibility.
- 10 sale attempts since 22y ago; this cycle's ask has dropped $15k (13%) from the opening price — seller is motivated, your offer sets the floor, not the list.
- Current owner paid $8k; list at $100k implies a 1150% gain — meaningful room to come down on a strong offer.
Risks & watch-outs
- Watch-outs: built in 1915 — expect roof / HVAC / electrical / plumbing capex.
Questions for the listing agent
- Built in 1915 — when were the roof, HVAC, electrical panel, plumbing, and water heater last replaced?
- Is there a deadline driving the sale (1031 exchange, divorce, estate, relocation)? That informs how much negotiation room exists.
- Crime grade is D in this area — have there been break-ins, vandalism, or insurance claims at this property in the last 3 years? What carrier currently insures it and at what premium?
- What's the average days-on-market for RENTAL listings here right now (not sales)? A rising rental-DOM trend means longer vacancies and softer asking-rent achievability than the comps imply.
- What's the recent tenant-quality profile in this submarket — average credit score on applications, eviction rate, late-payment / NSF rate, and stable-employment percentage? A property-management company in the area should have these aggregated.
- How much new for-sale + rental construction is in the pipeline within 1–3 miles? Heavy new supply typically softens prices + rents 12–24 months out; constrained supply supports both.
Investment metrics
- 1% rule
- 1.07% ✓
- Cap rate
- 8.73%
- Cash-on-cash
- 8.71%
- DSCR
- 1.39
- GRM
- 7.8
CMA / ARV
- ARV (on-the-fly)
- $138,852
- Comps found
- 12
Show comp detail 12 sales within ~0.75 mi
| Address | Dist | Beds/Ba | Sqft | Sold | Price | $/sf | Match |
|---|---|---|---|---|---|---|---|
| 568 Garfield Pl | 0.31mi | 4/1.0 (+1) | 1,613 (+1%) | 1mo | $140,000 | $87 | 78 |
| 212 Penn Ave | 0.21mi | 4/2.0 (+1) | 1,655 (+4%) | 3mo | $121,000 | $73 | 73 |
| 220 Atcheson Ave | 0.24mi | 3/1.0 | 1,408 (-12%) | 1mo | $132,500 | $94 | 68 |
| 282 W 5th St | 0.29mi | 3/2.0 | 1,480 (-7%) | 5mo | $85,000 | $57 | 66 |
| 114 Vennum Ave | 0.41mi | 4/1.0 (+1) | 1,724 (+8%) | 4mo | $50,000 | $29 | 59 |
| 108 S Stewart Ave | 0.53mi | 3/1.0 | 1,404 (-12%) | 1mo | $85,000 | $61 | 55 |
| 31 Parkwood Blvd | 0.52mi | 3/1.0 | 1,387 (-13%) | 2mo | $170,000 | $123 | 52 |
| 78 Glenwood Blvd | 0.54mi | 4/1.5 (+1) | 1,756 (+10%) | 4mo | $224,900 | $128 | 48 |
| 189 Westwood Ave | 0.65mi | 3/2.0 | 1,752 (+10%) | 3mo | $169,000 | $96 | 47 |
| 175 Bennet St | 0.66mi | 3/1.0 | 1,425 (-11%) | 5mo | $119,900 | $84 | 47 |
| 487 Davey Ave | 0.67mi | 3/1.0 | 1,408 (-12%) | 4mo | $136,000 | $97 | 46 |
| 282 Vennum Ave | 0.73mi | 3/1.5 | 1,416 (-11%) | 3mo | $94,000 | $66 | 42 |
Match score weights: distance 35% · size 25% · config 20% · recency 20%. Top-matched comps best support the ARV.
Projected returns pro-forma
-3.0% appreciation · 3.0% rent growth · sell at horizon
- IRR
- -3.1%
- Equity multiple
- 0.88×
- Total profit
- $-3,277
- Equity at exit
- $14,910
- IRR
- 6.6%
- Equity multiple
- 1.49×
- Total profit
- $13,760
- Equity at exit
- $8,646
Cash invested: $28,000 (down + closing). Projections, not guarantees.
Landlord ↔ Tenant lean methodology
- Overall (STATE)
- 73 Landlord-Friendly
- State Ohio
- 73 Landlord-Friendly · R+6
- County
- — inherits STATE
- City
- — inherits STATE
ZIP-level market 44903
- Home prices YoY
- -27.7%
- Active inventory
- 122
- Price-to-rent
- 7.8×
Monthly cashflow live
- Estimated rent
- $1,074 medium interval (Pro) →
- Mortgage (P&I)
- −$524
- Tax from tax record
- −$79 /mo · $951/yr
- Insurance
- −$42
- HOA
- −$0
- Vacancy / Maint / Mgmt
- −$226
- Net cashflow
- $203
Break-even live
UW: 25.0% down · 7.5% · 30yr · 1.5% tax · 5.0% vac · 8.0% maint · 8.0% mgmt
Financing live
Cash to close
- Down payment
- $25,000
- Closing costs
- $3,000
- Reserves months
- —
- Total cash needed
- —
Loan-product check · same deal, 3 products live
Conventional
25% down · 7.5% · 30yr
- Down + closing
- —
- Monthly P&I
- —
- Monthly cashflow
- —
- DSCR
- —
- Eligible?
- —
Personal DTI + credit; lowest rate.
DSCR
20% down · 8.5% · 30yr
- Down + closing
- —
- Monthly P&I
- —
- Monthly cashflow
- —
- DSCR
- —
- Eligible?
- —
No personal income docs; deal must DSCR.
Hard money
10% down · 12.0% · 12mo
- Down + closing
- —
- Monthly P&I
- —
- Monthly cashflow
- —
- DSCR
- —
- Eligible?
- —
Short-term bridge; refi at stabilization.
Rent comps 4 comps
| Address | Beds | Baths | Sqft | Rent | $/sqft | DOM | Units | Dist |
|---|---|---|---|---|---|---|---|---|
| 243 W 1st St Mansfield, OH | 4.0 | 1.0 | 1470 | $1,195 | $0.81 | 43d | 1 | 0.48mi |
| 520 Lida St Mansfield, OH | 3.0 | 1.0 | 1300 | $850 | $0.65 | 43d | 1 | 0.91mi |
| 640 King St Mansfield, OH | 1.0–3.0 | 1.0 | 938 | $1,100 | $1.17 | 43d | 11 | 0.95mi |
| 147 Ford St Mansfield, OH | 3.0 | 1.5 | 1286 | $995 | $0.77 | 43d | 1 | 1.36mi |
Listing history 43 events
-
2026-06-19days on market $100,000 Active 30 DOM
-
2026-06-18days on market $100,000 Active 29 DOM
-
2026-06-17days on market $100,000 Active 28 DOM
-
2026-06-17remarks 498-char remark
-
2026-06-17price $100,000 Active 27 DOM
-
2026-06-16days on market $110,000 Active 27 DOM
-
2026-06-15days on market $110,000 Active 26 DOM
-
2026-06-14days on market $110,000 Active 24 DOM
-
2026-06-12days on market $110,000 Active 23 DOM
-
2026-06-09days on market $110,000 Active 20 DOM
-
2026-06-08days on market $110,000 Active 19 DOM
-
2026-06-07days on market $110,000 Active 18 DOM
-
2026-06-05days on market $110,000 Active 15 DOM
-
2026-06-03days on market $110,000 Active 14 DOM
-
2026-06-02days on market $110,000 Active 13 DOM
-
2026-06-01days on market $110,000 Active 12 DOM
-
2026-05-31days on market $110,000 Active 11 DOM
-
2026-05-30days on market $110,000 Active 10 DOM
-
2026-05-20$115,000 Active
-
2025-12-11historical $1,125
-
2025-10-25$1,125
-
2025-09-22price $84,900
-
2025-08-08price $70,000
-
2025-07-30price $72,000
-
2025-07-09price $76,000
-
2025-06-16price $79,900
-
2025-06-05$85,900 Active
-
2025-05-04historical $910
-
2025-04-12$910
-
2025-04-01status Active
-
2025-03-06status Pending
-
2025-03-01price $79,900
-
2025-02-05price $84,900
-
2024-12-20$90,000 Active
-
2023-09-06status Active
-
2023-08-10historical
-
2023-08-01$65,000 Active
-
2016-05-02soldstatus $8,000
-
2016-03-09$8,500
-
2006-01-19soldstatus $47,000
-
2004-12-01historical
-
2004-06-25$49,900
-
1992-04-30soldstatus $23,000
ⓘ Source: listings_history table (triggers on properties + properties_extension) + one-shot
backfill from property_details.listing_events for pre-trigger history.
Tax reassessment forecast OH · Partial reset (capped growth)
- Current annual tax
- $951 · $79/mo
- Projected year-2 tax
- $1,255 · $105/mo
- Expected delta
- +$305/yr (+$25/mo · 32.1%)
ⓘ Screening estimate from a state-policy table — verify with the county assessor before closing.
Climate risk First Street
- Flood 1/10 Low FEMA zone X (unshaded) · 0% chance over 30 yrs
- Wildfire 1/10 Low
- Heat 3/10 Moderate 7 d/yr ≥96°F today · 17 d/yr by 30 yrs out
- Wind 2/10 Low
- Air quality 2/10 Low 1 unhealthy d/yr today · 1 by 30 yrs out
Nearby sold comps map
Loading sold comps map…
Walkable amenities ~0.75 mi
Loading nearby amenities…
Taxation est. · year 1
- Rental income
- $12,888
- − Mortgage interest
- −$5,602
- − Property taxes
- −$951
- − Insurance
- −$500
- − Repairs & maintenance
- −$1,031
- − Management
- −$1,031
- − Depreciation
- −$2,909
- Taxable income
- $865
- Est. tax owed @ 24.0%
- −$208
- After-tax cash flow
- $2,230/yr
For passive investors: Depreciation is non-cash, so a rental often shows a tax loss while cash-flowing — sheltering income. Rental losses are passive: they offset passive income freely, and up to $25,000/yr can offset ordinary (W-2) income if you actively participate and your MAGI is under $100k (phasing out to $0 by $150k); unused losses carry forward. On sale, claimed depreciation is recaptured at up to 25%, and gains may owe capital-gains tax (a 1031 exchange can defer both). Figures are a year-1 estimate at your 24.0% rate — not tax advice; consult a CPA.
Schools (NCES district)
- District
- Mansfield City
- NCES district ID
- 3904429
- Math proficiency
- 24% ▼ -19.00%
- Reading proficiency
- 33% ▼ -12.00%
- Median HH income
- $32,435
- Composite
- 23.25/100
- National rank
- #7934
- State rank
- #590 of 656 in OH
Livability — Mansfield
- Score
- 76/100
- State rank
- #224
- US rank
- #3525
Category grades
Schools grade is shown separately in the Schools card above.
Census & demographics
- Census place
- Mansfield, OH
- County
- Richland · 128,966 people
- City population
- 16,349
- Metro
- Mansfield, OH
- Population (ZIP)
- 26,804
- Household income
- $65,421
- Rent vs Own
- Severe rent burden
- 9.5
Population outlook (Richland County) Hauer SSP2
- Today (2025)
- 115,577 people
- By 2030
- 111,669 · -3.4%
- By 2040
- 103,323 · -10.6%
- By 2050
- 95,135 · -17.7%
- By 2075
- 76,719 · -33.6%
- By 2100
- 57,188 · -50.5%
Race, ethnicity, and origin ACS 2023
- Neighborhood character
- Predominantly White (80%)
- Race & ethnicity
- White 80% Two or more races 9% Black 9% Hispanic / Latino 2% Asian 1%
- Common ancestry
- Slovak 2% Iranian 1% Romanian 1%
- Foreign-born
- 1%
- Languages at home
- 97% English-only · Spanish 1% Other Indo-European 1%
Political lean MEDSL · Richland
- 2024 margin
- Solid R (+42.3) · D 28.4% · R 70.8%
- 2008→2024 swing
- -28.8pp toward R · 2008: -13.6pp · 2024: -42.3pp
- All cycles
- 2024: R+42.3 2020: R+39.7 2016: R+37.5 2012: R+20.1 2008: R+13.6
Not yet ingested
- Civics
- —
Market trends
- HPI YoY
- ▼ -92.50%
- Current HPI
- 241.9342
- Rent YoY
- —
- Metro
- —
- State GDP YoY
- ▲ 1.98%
- F500 in state
- 48
Industry mix (Fortune 500 HQ in OH)
| Industry | F500 HQs | Revenue |
|---|---|---|
| Insurance | 3 | $145B |
|
||
| Industrial Machinery | 3 | $49B |
|
||
| Financial Services | 3 | $24B |
|
||
| Consumer Goods | 2 | $93B |
|
||
| Aerospace / Defense | 2 | $47B |
|
||
| Utilities | 2 | $33B |
|
||
Price history
+400.0% since first listed25 events — show timeline
- 2026-05-20 Listed $115,000 MARMLS
- 2025-12-11 Rental Removed $1,125 APPFOLIO
- 2025-10-25 Listed for Rent $1,125 APPFOLIO
- 2025-09-22 Price Changed $84,900 MARMLS
- 2025-08-08 Price Changed $70,000 MARMLS
- 2025-07-30 Price Changed $72,000 MARMLS
- 2025-07-09 Price Changed $76,000 MARMLS
- 2025-06-16 Price Changed $79,900 MARMLS
- 2025-06-05 Listed $85,900 MARMLS
- 2025-05-04 Rental Removed $910 APPFOLIO
- 2025-04-12 Listed for Rent $910 APPFOLIO
- 2025-04-01 Relisted — MARMLS
- 2025-03-06 Pending — MARMLS
- 2025-03-01 Price Changed $79,900 MARMLS
- 2025-02-05 Price Changed $84,900 MARMLS
- 2024-12-20 Listed $90,000 MARMLS
- 2023-09-06 Relisted — MARMLS
- 2023-08-10 Delisted — MARMLS
- 2023-08-01 Listed $65,000 MARMLS
- 2016-05-02 Sold (MLS) $8,000 MARMLS
- 2016-03-09 Listed $8,500 MARMLS
- 2006-01-19 Sold (Public Records) $47,000 Public Records
- 2004-12-01 Listing Removed — CBRMLS
- 2004-06-25 Listed $49,900 CBRMLS
- 1992-04-30 Sold (Public Records) $23,000 Public Records
Property tax history
+23.3%/yrLatest (2025): $951 · +0.0% YoY. Source: county tax records.
Cash-flow waterfall
monthlySold comps — $/sqft
last 12 mo · ≤1 miLoading sold comps…