2335 Mill Creek Rd · Morehead City, NC
Flood risk No data
- FEMA flood zone
- —
- Chance of flooding over 30 yrs
- —
- Est. flood insurance / yr
- —
Fire risk No data
- Est. fire insurance / yr
- —
Heat risk No data
- Hot days now (above threshold)
- —
- Hot days in 30 yrs
- —
Wind risk No data
- Chance of severe wind over 30 yrs
- —
Air-quality risk No data
- Unhealthy air days now
- —
- Unhealthy air days in 30 yrs
- —
Risk factors via First Street. Map © Google.
Why this score? — see what drove the D+ grade
The composite is a weighted blend of 9 inputs, each scored 0–100. Each bar is that input's sub-score; the figure is the points it added to the 100-point composite (weight × sub-score).
- Cash flow +15.0/30.0
- ARV discount +7.5/15.0
- Schools +5.1/10.0
- 1% rule +5.0/10.0
- DSCR +5.0/10.0
- Livability +3.2/5.0
- Rent growth +2.5/5.0
- Condition / age +2.5/5.0
- Appreciation +0.0/10.0
$240,000
🖨 Deal sheet (PDF) 📄 Offer letter ✓ Due diligence
Listing remarks
Brand new home offered exclusively to families who qualify through Crystal Coast Habitat for Humanity. Habitat will provide affordable no-interest financing tailored to the approved buyer's budget. Home appraised for $320,000. Listing price reflects the maximum affordability discount from Habitat. The approved buyer will receive a forgivable second mortgage equal to the amount of the discount. Listing agent is a board member of Crystal Coast Habitat for Humanity.
Key facts
- 0.71 acre lot
- Built 2025
- Listed 94 days
Property features AI
Exterior
- Parking: Off-street parking; No garage
- Security: Smoke detector(s)
- Utilities: No utilities listed
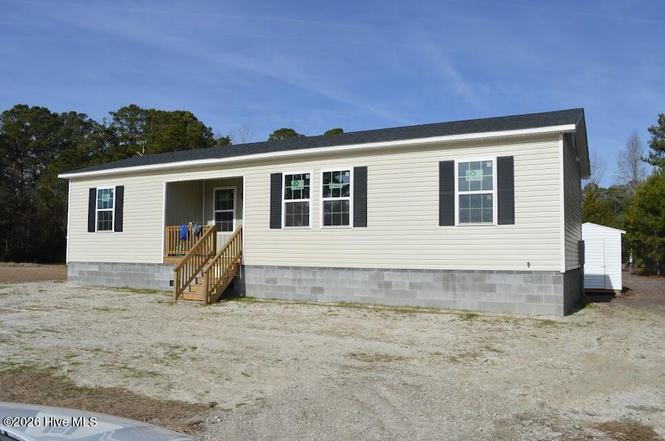
- Home design: Single-family residence; One level; New construction
- Construction: Vinyl siding and frame construction; Block foundation; Built as new construction
- Exterior features: Covered front porch; Shed(s); Shingle roof; Irregular lot; Road frontage on city street and state road; Has a view; Pets allowed
Interior
- Kitchen: Electric range, Dishwasher, Refrigerator
- Bedrooms: 5 total rooms (includes bedrooms and living spaces)
- Bathrooms: 2 full bathrooms
- Interior features: Washer, Dryer, Refrigerator, Dishwasher, Electric Range, Electric Water Heater; Smoke detector(s); Crawl space
- Laundry & utility: Washer hookup, Laundry closet, Washer and Dryer included
Neighborhood map
What this means for you Summary
Snapshot
- This is a 3-bed/2.0-bath single-family listed at $240k.
Deal economics
- At list price, monthly cash flow is $8k ($100k/yr) — positive.
- The deal already cash-flows at list — no discount required.
- Meets the 1% rule at list price ($13k rent vs $240k).
- Recommended offer: $218k (9.0% below list) — sets the bar for market timing.
- Cap rate 48.0% vs local median 2.0% in Morehead City — top-decile yield for the area; either an underpriced asset or a hidden risk that comps aren't pricing in. Stress-test before assuming the spread holds.
Location & tenants
- Location reads 63/100 on livability (#412 in NC) — a middle-class / working-renter tenant base. Strengths: cost of living A-, housing B; Watch: employment D+, crime D-, amenities F.
- Carteret County Public Schools (rural): math 59% / reading 61% proficiency, ranked #31 of 178 in NC (top 17%) — acceptable for families but not a draw, mixed tenant base, ~2y average lease.
- Zoned schools: Newport Elementary (math 48% / reading 45%, grade D-, #542 of 1,410 statewide, top 39%, 645 students, 100% FRL); Newport Middle (math 39% / reading 56%, grade C-, #140 of 475 statewide, top 30%, 378 students, 98% FRL); West Carteret High (math 82% / reading 71%, grade A-, #89 of 535 statewide, top 16%, 1,146 students, 40% FRL) — zoned schools average 79% FRL vs 39% district-wide (40 pts higher); higher-poverty schools than district average — tighter screening recommended.
- Market conditions: 217 active listings in the ZIP; 935 units permitted in Carteret County in 2024 (360 in 5+ unit buildings).
- At $12,651/mo this rent would consume 216% of the median local household income ($70k/yr) (locally 461% of renters already pay >50% of income on rent) — very limited rent-growth headroom before tenants either downsize or default.
Forward outlook
- Local home prices are declining (-3.0%/yr); year-one equity from $2k of loan paydown is wiped out by about $7k of value loss. Plan a longer hold.
- Carteret County population projected at +9% by 2050 — modest demand growth; plan on rents tracking national, not racing it.
- At projected returns (-3.0% appreciation + 3.0% rent growth), your $67k cash investment doubles in ~1 year — after that, you're playing with house money.
Negotiation context
- It's been on market 94 days — a 9% lower offer ($218k) is reasonable based on typical stale-listing flexibility.
Questions for the listing agent
- It's been on market 94 days. Have you received any prior offers? Is the seller open to a 9% concession, seller financing, or rate buy-down credit?
- Why hasn't it sold? Are there any deal-killer items the seller is aware of (foundation, flood, title, zoning, code violations)?
- Is there a deadline driving the sale (1031 exchange, divorce, estate, relocation)? That informs how much negotiation room exists.
- Crime grade is D in this area — have there been break-ins, vandalism, or insurance claims at this property in the last 3 years? What carrier currently insures it and at what premium?
- The area grade is low — what's the realistic commute time and amenity access for the typical tenant pool here? Any planned neighborhood developments (good or bad) we should know about?
- What's the average days-on-market for RENTAL listings here right now (not sales)? A rising rental-DOM trend means longer vacancies and softer asking-rent achievability than the comps imply.
- What's the recent tenant-quality profile in this submarket — average credit score on applications, eviction rate, late-payment / NSF rate, and stable-employment percentage? A property-management company in the area should have these aggregated.
- How much new for-sale + rental construction is in the pipeline within 1–3 miles? Heavy new supply typically softens prices + rents 12–24 months out; constrained supply supports both.
Investment metrics
- 1% rule
- 5.27% ✓
- Cap rate
- 47.97%
- Cash-on-cash
- 148.85%
- DSCR
- 7.62
- GRM
- 1.6
CMA / ARV
No comps found within radius.
Projected returns pro-forma
-3.0% appreciation · 3.0% rent growth · sell at horizon
- IRR
- —
- Equity multiple
- 8.32×
- Total profit
- $492,188
- Equity at exit
- $35,785
- IRR
- —
- Equity multiple
- 17.56×
- Total profit
- $1,112,966
- Equity at exit
- $20,751
Cash invested: $67,200 (down + closing). Projections, not guarantees.
Landlord ↔ Tenant lean methodology
- Overall (STATE)
- 85 Strongly Landlord-Friendly
- State North Carolina
- 85 Strongly Landlord-Friendly · R+3
- County
- — inherits STATE
- City
- — inherits STATE
ZIP-level market 28570
- Home prices YoY
- -16.2%
- Active inventory
- 217
- Price-to-rent
- 1.6×
Monthly cashflow live
- Estimated rent
- $12,651 medium interval (Pro) →
- Mortgage (P&I)
- −$1,259
- Tax est. 1.5%
- −$300 /mo · $3,600/yr
- Insurance
- −$100
- HOA
- −$0
- Lot rent
- −$0
- Vacancy / Maint / Mgmt
- −$2,657
- Net cashflow
- $8,335
Break-even live
Sensitivity live
| Price | -10% $8,501 | -5% $8,418 | +0% $8,335 | +5% $8,252 | +10% $8,170 |
|---|---|---|---|---|---|
| Rent | -10% $7,336 | -5% $7,836 | +0% $8,335 | +5% $8,835 | +10% $9,335 |
| Rate | -1.0pp $8,456 | -0.5pp $8,396 | base $8,335 | +0.5pp $8,273 | +1.0pp $8,210 |
UW: 25.0% down · 7.5% · 30yr · 1.5% tax · 5.0% vac · 8.0% maint · 8.0% mgmt
Financing live
Cash to close
- Down payment
- $60,000
- Closing costs
- $7,200
- Reserves months
- —
- Total cash needed
- —
Loan-product check · same deal, 3 products live
Conventional
25% down · 7.5% · 30yr
- Down + closing
- —
- Monthly P&I
- —
- Monthly cashflow
- —
- DSCR
- —
- Eligible?
- —
Personal DTI + credit; lowest rate.
DSCR
20% down · 8.5% · 30yr
- Down + closing
- —
- Monthly P&I
- —
- Monthly cashflow
- —
- DSCR
- —
- Eligible?
- —
No personal income docs; deal must DSCR.
Hard money
10% down · 12.0% · 12mo
- Down + closing
- —
- Monthly P&I
- —
- Monthly cashflow
- —
- DSCR
- —
- Eligible?
- —
Short-term bridge; refi at stabilization.
Listing history 1 events
-
2026-02-23$240,000 Active
ⓘ Source: listings_history table (triggers on properties + properties_extension) + one-shot
backfill from property_details.listing_events for pre-trigger history.
Nearby sold comps map
Loading sold comps map…
Walkable amenities ~0.75 mi
Loading nearby amenities…
Taxation est. · year 1
- Rental income
- $151,808
- − Mortgage interest
- −$13,444
- − Property taxes
- −$3,600
- − Insurance
- −$1,200
- − Repairs & maintenance
- −$12,145
- − Management
- −$12,145
- − Depreciation
- −$6,982
- Taxable income
- $102,293
- Est. tax owed @ 24.0%
- −$24,550
- After-tax cash flow
- $75,475/yr
For passive investors: Depreciation is non-cash, so a rental often shows a tax loss while cash-flowing — sheltering income. Rental losses are passive: they offset passive income freely, and up to $25,000/yr can offset ordinary (W-2) income if you actively participate and your MAGI is under $100k (phasing out to $0 by $150k); unused losses carry forward. On sale, claimed depreciation is recaptured at up to 25%, and gains may owe capital-gains tax (a 1031 exchange can defer both). Figures are a year-1 estimate at your 24.0% rate — not tax advice; consult a CPA.
Schools (NCES district)
- District
- Carteret County Public Schools
- NCES district ID
- 3700630
- Math proficiency
- 59% ▲ 5.00%
- Reading proficiency
- 61% ▲ 2.00%
- Median HH income
- $48,330
- Composite
- 50.92/100
- National rank
- #1786
- State rank
- #31 of 178 in NC
Livability — Morehead City
- Score
- 63/100
- State rank
- #412
- US rank
- #15497
Category grades
Schools grade is shown separately in the Schools card above.
Census & demographics
- County
- Carteret County · 52,389 people
- City population
- 15,253
- Metro
- Morehead City, NC
- Population (ZIP)
- 22,197
- Household income
- $70,229
- Rent vs Own
- Severe rent burden
- 461.0
Population outlook (Carteret County) Hauer SSP2
- Today (2025)
- 73,443 people
- By 2030
- 75,344 · +2.6%
- By 2040
- 78,142 · +6.4%
- By 2050
- 80,091 · +9.1%
- By 2075
- 86,120 · +17.3%
- By 2100
- 89,408 · +21.7%
Race, ethnicity, and origin ACS 2023
- Neighborhood character
- Predominantly White (82%)
- Race & ethnicity
- White 82% Hispanic / Latino 7% Two or more races 6% Black 3% Asian 1%
- Hispanic origin (detail)
- Mexican 4%
- Common ancestry
- Slovak 3% Romanian 3% Lithuanian 2%
- Foreign-born
- 5% · Canada, Dominican Republic
- Languages at home
- 92% English-only · Spanish 6% German/W. Germanic 1%
Political lean MEDSL · Carteret
- 2024 margin
- Solid R (+43.1) · D 28.0% · R 71.1%
- 2008→2024 swing
- -8.4pp toward R · 2008: -34.7pp · 2024: -43.1pp
- All cycles
- 2024: R+43.1 2020: R+42.0 2016: R+44.5 2012: R+41.0 2008: R+34.7
Not yet ingested
- Civics
- —
Market trends
- HPI YoY
- ▼ -53.54%
- Current HPI
- 276.6589
- Rent YoY
- —
- Metro
- Morehead City, NC
- State GDP YoY
- ▲ 3.28%
- F500 in state
- 26
Industry mix (Fortune 500 HQ in NC)
| Industry | F500 HQs | Revenue |
|---|---|---|
| Financial Services | 2 | $213B |
|
||
| Retail | 2 | $95B |
|
||
| Industrial Conglomerate | 1 | $38B |
|
||
| Metals / Steel | 1 | $35B |
|
||
| Utilities | 1 | $30B |
|
||
| Industrial Machinery | 1 | $19B |
|
||
Price history
1 event — show timeline
- 2026-02-23 Listed $240,000 Hive MLS
Cash-flow waterfall
monthlySold comps — $/sqft
last 12 mo · ≤1 miLoading sold comps…