 Fourplex
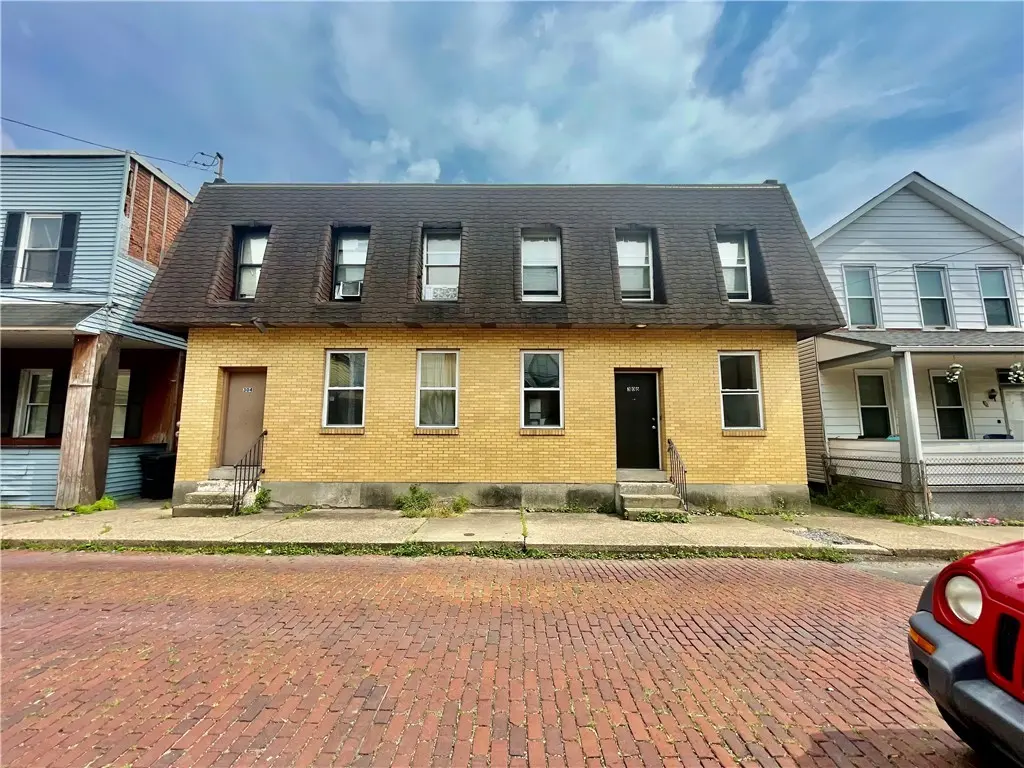
306 Campbell St · McKees Rocks, PA
Flood risk 10/10 · Severe
- FEMA flood zone
- X (shaded)
- Chance of flooding over 30 yrs
- 0.99%
- Est. flood insurance / yr
- $473 – $860
Fire risk 1/10 · Minimal
- Est. fire insurance / yr
- $511 – $949
Heat risk 4/10 · Minor
- Hot days now (above 98°F)
- 7 days/yr
- Hot days in 30 yrs
- 18 days/yr
Wind risk 2/10 · Minimal
- Chance of severe wind over 30 yrs
- —
Air-quality risk 3/10 · Minor
- Unhealthy air days now
- 3 days/yr
- Unhealthy air days in 30 yrs
- 3 days/yr
Risk factors via First Street. Map © Google.
Why this score? — see what drove the B grade
The composite is a weighted blend of 9 inputs, each scored 0–100. Each bar is that input's sub-score; the figure is the points it added to the 100-point composite (weight × sub-score).
- Cash flow +30.0/30.0
- 1% rule +10.0/10.0
- DSCR +10.0/10.0
- ARV discount +7.5/15.0
- Rent growth +5.0/5.0
- Livability +4.1/5.0
- Condition / age +3.8/5.0
- Schools +0.9/10.0
- Appreciation +0.0/10.0
$225,000
🖨 Deal sheet 📄 Offer letter ✓ Due diligence
Multi-family units
County records classify this as Multi-Family (5+ Unit). Listing-text estimate: 4 units. estimate disagrees with records
5+ unit building — per-unit beds/baths from public records are typically unavailable; the breakdown below (if shown) is an estimate from the listing text.
Listing remarks
Welcome to 306 Campbell Street—an excellent opportunity to own a fully updated 4-unit multifamily property in McKees Rocks. Whether you’re looking to expand your investment portfolio or live in one unit while the others help pay your mortgage, this property offers the flexibility and upside you’ve been looking for. Each of the four units has been recently updated, providing modern finishes that attract and retain quality tenants while minimizing immediate maintenance needs. The building is well-suited for strong rental performance, with multiple income streams already in place or ready to be leased. For an owner-occupant, this is a smart way to build equity while generatin
Key facts
- Recently updated
- Fully updated
- Modern finishes
Tags
Property features AI
Finance
- Financial info: Assessed value $35,000; Annual tax approximately $1,600
Exterior
- Home design: Property at 306 Campbell St, McKees Rocks, PA 15136
- Construction: Lot area approximately 0.1205 acres
- Exterior features: Zoned R-10
Interior
- Interior features: 4-unit building
Neighborhood map
What this means for you Summary
Snapshot
- This is a 4 × 1-bed/1-bath units multifamily listed at $225k. Condition is rated good.
Deal economics
- At list price, monthly cash flow is $1k ($17k/yr) — positive. Per door: $363/mo.
- The deal already cash-flows at list — no discount required.
- Meets the 1% rule at list price ($4k rent vs $225k).
- Recommended offer: $218k (3.0% below list) — sets the bar for market timing.
- Cap rate 14.3% vs local median 11.7% in McKees Rocks — meaningfully above typical; check what's discounted (condition, days-on-market, listing class) to confirm the premium yield is real.
Location & tenants
- Location reads 82/100 on livability (#143 in PA, #1,154 nationally) — a professional / high-income tenant draw. Strengths: amenities A+, commute A+, cost of living A+; Watch: schools F, employment F.
- Sto-Rox SD (suburban): math 4% / reading 18% proficiency, ranked #532 of 539 in PA (top 99%) — low school quality limits family demand, transient renter base, plan for 1-2y turnover; 77% free/reduced lunch — lower-income household profile, screen leases tightly.
- Market conditions: Rents rising fast (+13.1%/yr); 125 active listings in the ZIP; 40 comparable units currently listed for rent nearby; rentals at typical pace (median 24d on market — plan ~3-4 weeks tenant-placement turnaround); 2,996 units permitted in Allegheny County in 2024 (1,588 in 5+ unit buildings).
- At $3,875/mo this rent would consume 67% of the median local household income ($69k/yr) (locally 768% of renters already pay >50% of income on rent) — very limited rent-growth headroom before tenants either downsize or default.
Forward outlook
- Local home prices are declining (-3.0%/yr); year-one equity from $2k of loan paydown is wiped out by about $7k of value loss. Plan a longer hold.
- At projected returns (-3.0% appreciation + 8.0% rent growth), your $63k cash investment doubles in ~4 years — after that, you're playing with house money.
Negotiation context
- It's been on market 52 days — a 3% lower offer ($218k) is reasonable based on typical stale-listing flexibility.
- 2 sale attempts; this cycle's ask has dropped $25k (10%) from the opening price — seller is motivated, your offer sets the floor, not the list.
Risks & watch-outs
- Watch-outs: flood insurance adds $56/mo; built in 1920 — expect roof / HVAC / electrical / plumbing capex.
- Climate carrying-cost: severe flood risk — expect insurance premiums to compound above CPI over the hold.
Questions for the listing agent
- It's been on market 52 days. Have you received any prior offers? Is the seller open to a 3% concession, seller financing, or rate buy-down credit?
- Can we see the unit-by-unit rent roll, current vacancy, and any below-market leases? What's the average tenancy length?
- What capital expenditures (roof, boiler, parking lot, exteriors) have been made in the last 5 years, and what's planned in the next 2?
- Built in 1920 — when were the roof, HVAC, electrical panel, plumbing, and water heater last replaced?
- What's the actual annual flood-insurance premium (NFIP or private), and is the property in a SFHA with mandatory coverage?
- Is there a deadline driving the sale (1031 exchange, divorce, estate, relocation)? That informs how much negotiation room exists.
- Schools are F-rated, which usually means shorter tenancies and higher turnover. Who's the typical renter profile here, and what's been the actual vacancy rate?
- What's the average days-on-market for RENTAL listings here right now (not sales)? A rising rental-DOM trend means longer vacancies and softer asking-rent achievability than the comps imply.
- What's the recent tenant-quality profile in this submarket — average credit score on applications, eviction rate, late-payment / NSF rate, and stable-employment percentage? A property-management company in the area should have these aggregated.
- How much new apartment / multifamily construction is in the pipeline within 1–3 miles? Heavy new supply (>2% of stock underway) typically softens rents 12–24 months out; light construction supports rent growth.
Investment metrics
- 1% rule
- 1.72% ✓
- Cap rate
- 14.33%
- Cash-on-cash
- 28.69%
- DSCR
- 2.28
- GRM
- 4.8
CMA / ARV
- ARV (median comp)
- $113,241
- List price
- $225,000
- Delta
- 98.69%
- Verdict
- OVERPRICED
- Comps
- 6 within 2.0 mi
Show comp detail 12 sales within ~0.75 mi
| Address | Dist | Beds/Ba | Sqft | Sold | Price | $/sf | Match |
|---|---|---|---|---|---|---|---|
| 16-22 Helen St | 0.09mi | 14/7.0 | — | 9mo | $425,000 | — | 76 |
| 109 Ella St | 0.13mi | 6/4.0 | — | 8mo | $170,000 | — | 75 |
| 103 Ella St | 0.14mi | 4/2.0 | — | 12mo | $108,000 | — | 70 |
| 317 Hamilton St | 0.13mi | 8/8.0 | — | 19mo | $292,000 | — | 66 |
| 733-735 Mary St | 0.64mi | 8/4.0 | — | 6mo | $70,000 | — | 53 |
| 22 Harlem Ave | 0.64mi | 4/2.0 | — | 6mo | $94,000 | — | 52 |
| 922 Island Ave | 0.50mi | 4/2.0 | — | 18mo | $125,000 | — | 49 |
| 919-921 Robinson St | 0.46mi | 5/2.0 | — | 21mo | $60,000 | — | 49 |
| 742 Chartiers Ave | 0.69mi | 3/3.0 | — | 9mo | $120,000 | — | 48 |
| 900 2nd St | 0.70mi | 4/2.0 | — | 11mo | $147,500 | — | 46 |
| 732-734 Chartiers Ave | 0.68mi | 8/4.0 | — | 12mo | $276,500 | — | 46 |
| 765 Frederick St | 0.53mi | 4/2.0 | — | 22mo | $112,500 | — | 44 |
Match score weights: distance 35% · size 25% · config 20% · recency 20%. Top-matched comps best support the ARV.
Projected returns pro-forma
-3.0% appreciation · 8.0% rent growth · sell at horizon
- IRR
- 27.4%
- Equity multiple
- 2.21×
- Total profit
- $76,513
- Equity at exit
- $33,548
- IRR
- 37.8%
- Equity multiple
- 5.43×
- Total profit
- $279,189
- Equity at exit
- $19,454
Cash invested: $63,000 (down + closing). Projections, not guarantees.
Landlord ↔ Tenant lean methodology
- Overall (STATE)
- 62 Landlord-Friendly
- State Pennsylvania
- 62 Landlord-Friendly · EVEN
- County
- — inherits STATE
- City
- — inherits STATE
ZIP-level market 15136
- Home prices YoY
- -30.4%
- Rents YoY
- 13.1%
- Active inventory
- 125
- Price-to-rent
- 19.4×
Monthly cashflow live
- Estimated rent
- $3,875 high interval (Pro) →
- Mortgage (P&I)
- −$1,180
- Tax est. 1.5%
- −$281 /mo · $3,375/yr
- Insurance
- −$94
- Flood insurance flood zone
- −$56 /mo · $666/yr
- HOA
- −$0
- Vacancy / Maint / Mgmt
- −$814
- Net cashflow
- $1,451
Break-even live
4-unit breakdown (identical units grouped — click to expand)
| Units | Beds | Baths | Est. rent |
|---|---|---|---|
| 4× units | 1 | 1 | $3,876 |
| #1 | 1 | 1 | $969 |
| #2 | 1 | 1 | $969 |
| #3 | 1 | 1 | $969 |
| #4 | 1 | 1 | $969 |
| Total (4 units) | $3,875 | ||
UW: 25.0% down · 7.5% · 30yr · 1.5% tax · 5.0% vac · 8.0% maint · 8.0% mgmt
Financing live
Cash to close
- Down payment
- $56,250
- Closing costs
- $6,750
- Reserves months
- —
- Total cash needed
- —
Loan-product check · same deal, 3 products live
Conventional
25% down · 7.5% · 30yr
- Down + closing
- —
- Monthly P&I
- —
- Monthly cashflow
- —
- DSCR
- —
- Eligible?
- —
Personal DTI + credit; lowest rate.
DSCR
20% down · 8.5% · 30yr
- Down + closing
- —
- Monthly P&I
- —
- Monthly cashflow
- —
- DSCR
- —
- Eligible?
- —
No personal income docs; deal must DSCR.
Hard money
10% down · 12.0% · 12mo
- Down + closing
- —
- Monthly P&I
- —
- Monthly cashflow
- —
- DSCR
- —
- Eligible?
- —
Short-term bridge; refi at stabilization.
Rent comps 40 comps
| Address | Beds | Baths | Sqft | Rent | $/sqft | DOM | Units | Dist |
|---|---|---|---|---|---|---|---|---|
| 321 Ella St Unit 12 McKees Rocks, PA | 1.0 | 1.0 | — | $1,200 | — | 43d | 1 | 0.07mi |
| 325 Ella St Unit 6 McKees Rocks, PA | 1.0 | 1.0 | — | $750 | — | 23d | 1 | 0.07mi |
| 340 Gardner St McKees Rocks, PA | 2.0 | 2.0 | — | $995 | — | 43d | 1 | 0.10mi |
| 104 Munson Ave Mc Kees Rocks, PA | 2.0 | 1.0 | — | $925 | — | 43d | 1 | 0.19mi |
| 723 Fruit Way Unit MC McKees Rocks, PA | 3.0 | 2.0 | — | $1,250 | — | 23d | 1 | 0.45mi |
| 27 Highland Ave Mc Kees Rocks, PA | 3.0 | 1.0 | 1488 | $1,425 | $0.96 | 23d | 1 | 0.61mi |
| 214 Erwin Pl Mc Kees Rocks, PA | 3.0 | 1.0 | 1026 | $1,685 | $1.64 | 43d | 1 | 0.62mi |
| 853 Railroad St Mc Kees Rocks, PA | 3.0 | 1.0 | — | $1,495 | — | 23d | 1 | 0.64mi |
| 22 Harlem Ave #1 McKees Rocks, PA | 2.0 | 1.0 | 1944 | $745 | $0.38 | 21d | 1 | 0.66mi |
| 732 Chartiers Ave McKees Rocks, PA | 1.0 | 1.0 | — | $1,100 | — | 23d | 1 | 0.70mi |
| 71 McKinnie Ave Mc Kees Rocks, PA | 2.0 | 1.0 | 1176 | $1,100 | $0.94 | 23d | 1 | 0.72mi |
| 306 Broadway Ave Apt 3 McKees Rocks, PA | 1.0 | 1.0 | — | $700 | — | 20d | 1 | 0.76mi |
| 406 Broadway Ave McKees Rocks, PA | 1.0 | 1.0 | — | $825 | — | 23d | 1 | 0.80mi |
| 600 Federal St Mc Kees Rocks, PA | 2.0 | 1.0 | — | $1,205 | — | 2d | 1 | 0.82mi |
| 907 Chartiers Ave Unit 2 McKees Rocks, PA | 2.0 | 1.0 | 900 | $1,100 | $1.22 | 23d | 1 | 0.82mi |
| 135 Dunn St Mc Kees Rocks, PA | 3.0 | 2.0 | 1600 | $1,599 | $1.00 | 19d | 1 | 0.83mi |
| 505 Broadway Ave Unit 3 McKees Rocks, PA | 1.0 | 1.0 | — | $750 | — | 43d | 1 | 0.85mi |
| 505 Broadway Ave Unit MC McKees Rocks, PA | 1.0 | 1.0 | — | $750 | — | 23d | 1 | 0.85mi |
| 33 Greenough Ave Pittsburgh, PA | 2.0 | 1.0 | 900 | $1,300 | $1.44 | 43d | 1 | 0.85mi |
| 809 Lamont St Mc Kees Rocks, PA | 3.0 | 1.0 | — | $1,525 | — | 43d | 1 | 0.85mi |
| 614 Woodward Ave McKees Rocks, PA | 2.0 | 1.0 | 1000 | $950 | $0.95 | 7d | 1 | 0.86mi |
| 618 Broadway Ave Unit MC McKees Rocks, PA | 1.0 | 1.0 | — | $750 | — | 23d | 1 | 0.90mi |
| 618 Broadway Ave Unit 1A McKees Rocks, PA | 1.0 | 1.0 | — | $750 | — | 43d | 1 | 0.90mi |
| 802 7th St Unit MC McKees Rocks, PA | 3.0 | 1.0 | — | $900 | — | 23d | 1 | 0.91mi |
| 500 Marwood Ave Mc Kees Rocks, PA | 3.0 | 2.0 | 2040 | $1,600 | $0.78 | 23d | 1 | 0.96mi |
| 500 Marwood Ave Unit NA McKees Rocks, PA | 3.0 | 2.0 | 2040 | $1,500 | $0.74 | 23d | 1 | 0.96mi |
| 519 Marwood Ave McKees Rocks, PA | 2.0 | 1.0 | — | $895 | — | 7d | 1 | 0.98mi |
| 117 Crawford Ave Unit 2 Pittsburgh, PA | 1.0 | 1.0 | 700 | $900 | $1.29 | 43d | 1 | 1.01mi |
| 219 Woodlawn Ave Pittsburgh, PA | 2.0 | 1.0 | 925 | $1,075 | $1.16 | 43d | 1 | 1.01mi |
| 197 Shiloh Ave Unit 205 Pittsburgh, PA | 1.0 | 1.0 | — | $899 | — | 17d | 1 | 1.03mi |
| 705 Russellwood Ave Apt 1 McKees Rocks, PA | 2.0 | 1.0 | 800 | $1,549 | $1.94 | 23d | 1 | 1.03mi |
| 200-222 Laurel Ave Unit 207 Pittsburgh, PA | 3.0 | 1.0 | — | $1,295 | — | 7d | 1 | 1.03mi |
| 37 Washington Ave Pittsburgh, PA | 1.0 | 1.0 | — | $929 | — | 43d | 1 | 1.06mi |
| 214 Wright St Unit Na McKees Rocks, PA | 2.0 | 1.0 | 954 | $1,175 | $1.23 | 14d | 1 | 1.07mi |
| 141 S Bryant Ave Unit 3 Pittsburgh, PA | 1.0 | 1.0 | — | $890 | — | 17d | 1 | 1.08mi |
| 908 Benwood Ave Mc Kees Rocks, PA | 3.0 | 1.0 | — | $1,450 | — | 43d | 1 | 1.08mi |
| 1124a Dohrman St McKees Rocks, PA | 3.0 | 1.0 | 1150 | $1,250 | $1.09 | 23d | 1 | 1.09mi |
| 1126 Dohrman St Unit MC McKees Rocks, PA | 2.0 | 1.0 | 1200 | $1,250 | $1.04 | 43d | 1 | 1.09mi |
| 149 S Euclid Ave Unit 1 Pittsburgh, PA | 1.0 | 1.0 | 800 | $1,200 | $1.50 | 17d | 1 | 1.10mi |
| 250 Laurel Ave Unit 303 Pittsburgh, PA | 1.0 | 1.0 | — | $895 | — | 17d | 1 | 1.11mi |
Listing history 17 events
-
2026-06-18days on market $225,000 Active 52 DOM
-
2026-06-17price $225,000 Active 51 DOM
-
2026-06-17days on market $250,000 Active 51 DOM
-
2026-06-16days on market $250,000 Active 50 DOM
-
2026-06-15days on market $250,000 Active 49 DOM
-
2026-06-13days on market $250,000 Active 47 DOM
-
2026-06-09days on market $250,000 Active 43 DOM
-
2026-06-08days on market $250,000 Active 42 DOM
-
2026-06-07days on market $250,000 Active 41 DOM
-
2026-06-05days on market $250,000 Active 38 DOM
-
2026-06-03days on market $250,000 Active 37 DOM
-
2026-06-02days on market $250,000 Active 36 DOM
-
2026-06-01days on market $250,000 Active 35 DOM
-
2026-05-31days on market $250,000 Active 34 DOM
-
2026-04-27$250,000 Active 1147-char remark
-
2025-10-19historical $750
-
2025-09-25$750
ⓘ Source: listings_history table (triggers on properties + properties_extension) + one-shot
backfill from property_details.listing_events for pre-trigger history.
Climate risk First Street
- Flood 10/10 Extreme FEMA zone X (shaded) · 99% chance over 30 yrs
- Wildfire 1/10 Low
- Heat 4/10 Moderate 7 d/yr ≥98°F today · 18 d/yr by 30 yrs out
- Wind 2/10 Low
- Air quality 3/10 Moderate 3 unhealthy d/yr today · 3 by 30 yrs out
Nearby sold comps map
Loading sold comps map…
Walkable amenities ~0.75 mi
Loading nearby amenities…
Taxation est. · year 1
- Rental income
- $46,500
- − Mortgage interest
- −$12,603
- − Property taxes
- −$3,375
- − Insurance
- −$1,792
- − Repairs & maintenance
- −$3,720
- − Management
- −$3,720
- − Depreciation
- −$6,545
- Taxable income
- $14,745
- Est. tax owed @ 24.0%
- −$3,539
- After-tax cash flow
- $13,871/yr
For passive investors: Depreciation is non-cash, so a rental often shows a tax loss while cash-flowing — sheltering income. Rental losses are passive: they offset passive income freely, and up to $25,000/yr can offset ordinary (W-2) income if you actively participate and your MAGI is under $100k (phasing out to $0 by $150k); unused losses carry forward. On sale, claimed depreciation is recaptured at up to 25%, and gains may owe capital-gains tax (a 1031 exchange can defer both). Figures are a year-1 estimate at your 24.0% rate — not tax advice; consult a CPA.
Condition & rehab AI · 12 photos
This fully updated 4-unit multifamily property in McKees Rocks is in good condition with minimal maintenance needs. It offers a great opportunity for investment with potential for further value enhancement through updates.
Value-add opportunities
- Both Painting and updating appliances in the kitchen. — Fresh paint and updated appliances would enhance the home's curb appeal and attract tenants.
- Both Upgrading the HVAC system. — A new HVAC system would improve comfort and energy efficiency, benefiting both resale and rental value.
- Both Landscaping improvements. — Enhanced landscaping would improve curb appeal and attract potential buyers or tenants.
- Both Adding smart home features. — Smart home features would appeal to modern buyers and tenants, enhancing both resale and rental value.
- Both Upgrading the kitchen cabinets. — Modern, updated cabinets would improve the kitchen's appearance and functionality, benefiting both resale and rental value.
Renovation cost estimate screening
Value-add ROI direction
- Both Painting and updating appliances in the kitchen. — Fresh paint and updated appliances would enhance the home's curb appeal and attract tenants. ↑
- Both Upgrading the HVAC system. — A new HVAC system would improve comfort and energy efficiency, benefiting both resale and rental value. ↑
- Both Landscaping improvements. — Enhanced landscaping would improve curb appeal and attract potential buyers or tenants. ↑
- Both Adding smart home features. — Smart home features would appeal to modern buyers and tenants, enhancing both resale and rental value. ↑
- Both Upgrading the kitchen cabinets. — Modern, updated cabinets would improve the kitchen's appearance and functionality, benefiting both resale and rental value. ↑
ⓘ Cost ranges are severity-bucket heuristics (US national rule-of-thumb). Get contractor quotes + a written scope before underwriting a rehab budget.
Schools (NCES district)
- District
- Sto-Rox SD
- NCES district ID
- 4222830
- Math proficiency
- 4% ▼ -5.00%
- Reading proficiency
- 18% ▼ -4.00%
- Median HH income
- $30,268
- Composite
- 8.51/100
- National rank
- #9904
- State rank
- #532 of 539 in PA
Livability — McKees Rocks
- Score
- 82/100
- State rank
- #143
- US rank
- #1154
Category grades
Schools grade is shown separately in the Schools card above.
Census & demographics
- Census place
- McKees Rocks, PA
- County
- Allegheny County · 1,022,028 people
- City population
- 22,623
- Metro
- Pittsburgh, PA
- Population (ZIP)
- 22,623
- Household income
- $69,099
- Rent vs Own
- Severe rent burden
- 768.0
Population outlook (Allegheny County) Hauer SSP2
- Today (2025)
- 1,250,282 people
- By 2030
- 1,256,482 · +0.5%
- By 2040
- 1,256,318 · +0.5%
- By 2050
- 1,244,169 · -0.5%
- By 2075
- 1,197,693 · -4.2%
- By 2100
- 1,093,187 · -12.6%
Race, ethnicity, and origin ACS 2023
- Neighborhood character
- Predominantly White (75%)
- Race & ethnicity
- White 75% Black 18% Two or more races 4% Hispanic / Latino 2%
- Common ancestry
- Romanian 10% Subsaharan African 3% Scotch-Irish 2%
- Foreign-born
- 3% · Canada
- Languages at home
- 96% English-only · Spanish 1% Other Indo-European 1%
Political lean MEDSL · Allegheny
- 2024 margin
- Strong D (+20.3) · D 59.7% · R 39.4%
- 2008→2024 swing
- +4.8pp toward D · 2008: 15.5pp · 2024: 20.3pp
- All cycles
- 2024: D+20.3 2020: D+20.4 2016: D+16.4 2012: D+14.4 2008: D+15.5
Not yet ingested
- Civics
- —
Market trends
- HPI YoY
- ▼ -107.07%
- Current HPI
- 244.6934
- Rent YoY
- ▲ 13.12%
- Metro
- Pittsburgh, PA
- State GDP YoY
- ▲ 1.68%
- F500 in state
- 34
Industry mix (Fortune 500 HQ in PA)
| Industry | F500 HQs | Revenue |
|---|---|---|
| Healthcare | 2 | $309B |
|
||
| Insurance | 2 | $27B |
|
||
| Telecommunications / Media | 1 | $124B |
|
||
| Industrial Distribution | 1 | $22B |
|
||
| Financial Services | 1 | $20B |
|
||
| Chemicals / Materials | 1 | $18B |
|
||
Price history
-10.0% since first listed4 events — show timeline
- 2026-06-17 Price Changed $225,000 West Penn MLS
- 2026-04-27 Listed $250,000 West Penn MLS
- 2025-10-19 Rental Removed $750 TENANTTURNER2
- 2025-09-25 Listed for Rent $750 TENANTTURNER2
Cash-flow waterfall
monthlySold comps — $/sqft
last 12 mo · ≤1 miLoading sold comps…