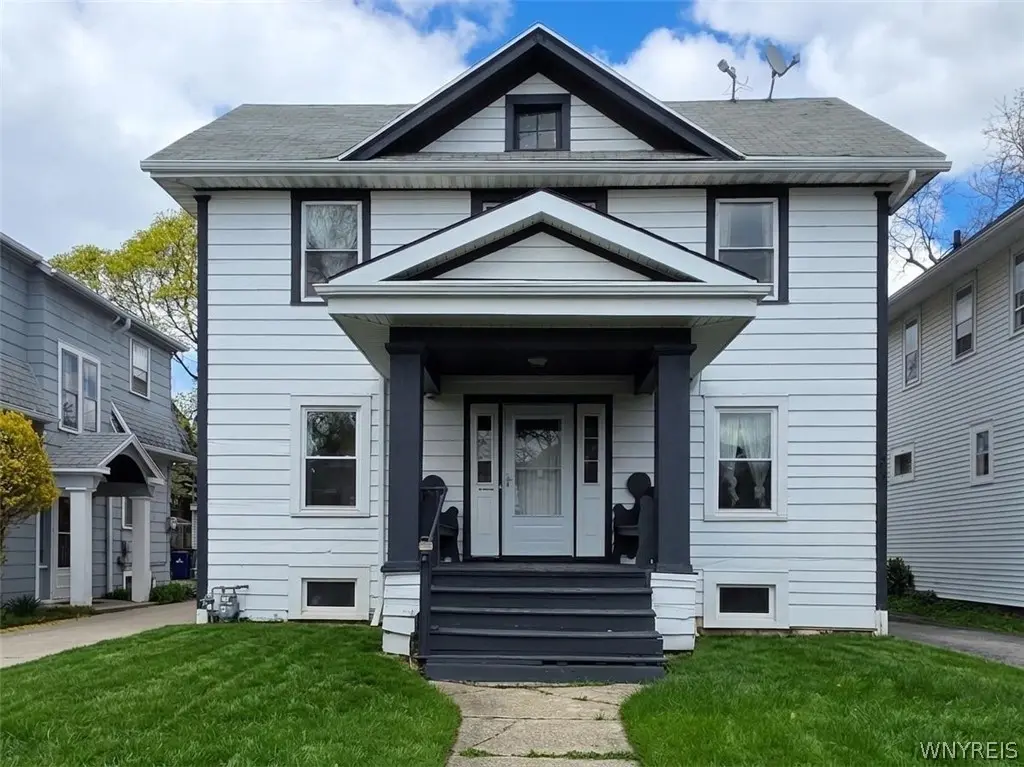
228 Highgate Ave · Buffalo, NY
Flood risk 1/10 · Minimal
- FEMA flood zone
- X (unshaded)
- Chance of flooding over 30 yrs
- 0.0%
- Est. flood insurance / yr
- $473 – $860
Fire risk 1/10 · Minimal
- Est. fire insurance / yr
- $691 – $1,283
Heat risk 3/10 · Minor
- Hot days now (above 92°F)
- 7 days/yr
- Hot days in 30 yrs
- 15 days/yr
Wind risk 1/10 · Minimal
- Chance of severe wind over 30 yrs
- —
Air-quality risk 3/10 · Minor
- Unhealthy air days now
- 2 days/yr
- Unhealthy air days in 30 yrs
- 3 days/yr
Risk factors via First Street. Map © Google.
Why this score? — see what drove the D+ grade
The composite is a weighted blend of 9 inputs, each scored 0–100. Each bar is that input's sub-score; the figure is the points it added to the 100-point composite (weight × sub-score).
- Cash flow +14.3/30.0
- ARV discount +11.5/15.0
- DSCR +4.3/10.0
- Livability +3.9/5.0
- Schools +3.3/10.0
- 1% rule +2.7/10.0
- Rent growth +2.7/5.0
- Condition / age +2.5/5.0
- Appreciation +0.0/10.0
$229,900
🖨 Deal sheet (PDF) 📄 Offer letter ✓ Due diligence
Listing remarks
Seller will consider offers starting at $229,900. Welcome to 228 Highgate Ave in Buffalo’s University District, ideally located just minutes from UB South Campus, Main Street shopping and dining, and the Metro Rail for easy access to downtown. This home blends original charm with thoughtful updates. Features include gleaming wood moldings, baseboards and newer vinyl windows throughout. Oversized foyer with coat closet, spacious living room with wood-burning fireplace, mantel, and built-ins. Newly renovated 1st floor full bath. Formal dining room offers abundant natural light, eat-in kitchen provides ample cabinet space. Upstairs, you’ll find newly finished original hardwood floo
Key facts
- Oversized foyer
- Updated full bath
- Ample cabinet space
Tags
Property features AI
Exterior
- Parking: Detached garage; 2-car garage
- Utilities: Electricity connected (circuit breakers); Public water connected; Sewer connected; Cable available; High-speed internet available
- Home design: 3 stories; Existing (established property); Asphalt roof; Wood siding; City street frontage; Rectangular residential lot; Near public transit
- Construction: Wood siding construction; Asphalt roof
- Exterior features: Concrete driveway; Partial fence; Covered porch
Interior
- Kitchen: Electric oven; Electric range; Refrigerator
- Bedrooms: Bedroom 1 (Second level); Bedroom 2 (Second level); Bedroom 3 (Second level); Bedroom 4 (Second level)
- Flooring: Hardwood; Ceramic tile; Varied flooring
- Bathrooms: 3 full bathrooms; 1 main-level bathroom
- Heating & cooling: Gas heating; Radiator heating
- Interior features: Separate/formal living room; Separate/formal dining room; Entrance foyer; Eat-in kitchen; Home office; Bathroom rough-in; Storage; Natural woodwork; See remarks
- Laundry & utility: Washer; Dryer; Laundry in basement; Gas water heater
Neighborhood map
What this means for you Summary
Snapshot
- This is a 4-bed/1.0-bath single-family listed at $230k.
Deal economics
- At list price, monthly cash flow is $40 ($486/yr) — positive.
- The deal already cash-flows at list — no discount required.
- To meet the 1% rule (rent ≥ 1% of price), the offer needs to be $177k (23.0% below list).
- Recommended offer: $177k (23.0% below list) — sets the bar for 1% rule.
Location & tenants
- Location reads 77/100 on livability (#195 in NY, #3,011 nationally) — a middle-class / working-renter tenant base. Strengths: commute A+, housing A+, health & safety A+; Watch: crime F, employment D-.
- Buffalo City School District (urban): math 41% / reading 40% proficiency, ranked #535 of 590 in NY (top 91%) — families likely to look elsewhere, expect single-tenant / working-renter base with shorter leases; 75% free/reduced lunch — lower-income household profile, screen leases tightly.
- Zoned schools: International School (math 8% / reading 17%, grade F, #2,048 of 2,108 statewide, top 97%, 981 students, 92% FRL); Hutchinson Central Technical High School (math 96% / reading 32%, grade B-, #807 of 1,100 statewide, top 73%, 1,175 students, 78% FRL).
- Market conditions: Rents flat; 239 active listings in the ZIP; 21 comparable units currently listed for rent nearby; rentals at typical pace (median 16d on market — plan ~3-4 weeks tenant-placement turnaround); lower-income renter base — watch delinquency; 1,244 units permitted in Erie County in 2024 (563 in 5+ unit buildings).
- At $1,770/mo this rent would consume 47% of the median local household income ($45k/yr) (locally 2873% of renters already pay >50% of income on rent) — very limited rent-growth headroom before tenants either downsize or default.
Forward outlook
- Local home prices are declining (-3.0%/yr); year-one equity from $2k of loan paydown is wiped out by about $7k of value loss. Plan a longer hold.
Negotiation context
- It's been on market 61 days — a 6% lower offer ($216k) is reasonable based on typical stale-listing flexibility.
- 6 sale attempts since 7y ago; this cycle's ask has dropped $20k (8%) from the opening price — seller is motivated, your offer sets the floor, not the list.
- Current owner paid $112k; list at $230k implies a 105% gain — meaningful room to come down on a strong offer.
Risks & watch-outs
- Watch-outs: built in 1927 — expect roof / HVAC / electrical / plumbing capex.
Questions for the listing agent
- It's been on market 61 days. Have you received any prior offers? Is the seller open to a 23% concession, seller financing, or rate buy-down credit?
- Built in 1927 — when were the roof, HVAC, electrical panel, plumbing, and water heater last replaced?
- Why hasn't it sold? Are there any deal-killer items the seller is aware of (foundation, flood, title, zoning, code violations)?
- Is there a deadline driving the sale (1031 exchange, divorce, estate, relocation)? That informs how much negotiation room exists.
- Crime grade is F in this area — have there been break-ins, vandalism, or insurance claims at this property in the last 3 years? What carrier currently insures it and at what premium?
- The area grade is low — what's the realistic commute time and amenity access for the typical tenant pool here? Any planned neighborhood developments (good or bad) we should know about?
- What's the average days-on-market for RENTAL listings here right now (not sales)? A rising rental-DOM trend means longer vacancies and softer asking-rent achievability than the comps imply.
- What's the recent tenant-quality profile in this submarket — average credit score on applications, eviction rate, late-payment / NSF rate, and stable-employment percentage? A property-management company in the area should have these aggregated.
- How much new for-sale + rental construction is in the pipeline within 1–3 miles? Heavy new supply typically softens prices + rents 12–24 months out; constrained supply supports both.
Investment metrics
- 1% rule
- 0.77% ✗
- Cap rate
- 6.50%
- Cash-on-cash
- 0.75%
- DSCR
- 1.03
- GRM
- 10.8
CMA / ARV
- ARV (median comp)
- $252,131
- List price
- $229,900
- Delta
- -8.82%
- Verdict
- FAIR
- Comps
- 20 within 1.0 mi
Show comp detail 12 sales within ~0.75 mi
| Address | Dist | Beds/Ba | Sqft | Sold | Price | $/sf | Match |
|---|---|---|---|---|---|---|---|
| 253 Winspear Ave | 0.12mi | 4/2.0 | 1,584 (+6%) | 6mo | $315,100 | $199 | 76 |
| 347 Lisbon Ave | 0.21mi | 3/1.5 (-1) | 1,558 (+4%) | 3mo | $180,000 | $116 | 74 |
| 176 Lasalle Ave | 0.28mi | 4/2.0 | 1,601 (+7%) | 2mo | $270,000 | $169 | 70 |
| 84 Elmer Ave | 0.71mi | 3/1.0 (-1) | 1,510 (+1%) | 1mo | $125,000 | $83 | 60 |
| 142 Englewood Ave | 0.65mi | 5/1.5 (+1) | 1,504 (+0%) | 4mo | $215,000 | $143 | 59 |
| 14 Thornton Ave | 0.63mi | 4/2.0 | 1,445 (-4%) | 4mo | $239,900 | $166 | 57 |
| 148 Rounds Ave | 0.58mi | 4/1.0 | 1,389 (-7%) | 5mo | $155,000 | $112 | 57 |
| 71 Merrimac St | 0.51mi | 3/1.0 (-1) | 1,404 (-6%) | 5mo | $129,999 | $93 | 56 |
| 243 Berkshire Ave | 0.55mi | 4/2.0 | 1,617 (+8%) | 1mo | $220,000 | $136 | 56 |
| 307 Berkshire Ave | 0.59mi | 4/1.0 | 1,623 (+8%) | 4mo | $182,000 | $112 | 55 |
| 461 Stockbridge Ave | 0.62mi | 3/1.0 (-1) | 1,336 (-11%) | 4mo | $96,500 | $72 | 45 |
| 687 Lasalle Ave | 0.70mi | 5/2.0 (+1) | 1,721 (+15%) | 6mo | $135,000 | $78 | 29 |
Match score weights: distance 35% · size 25% · config 20% · recency 20%. Top-matched comps best support the ARV.
Projected returns pro-forma
-3.0% appreciation · 0.67% rent growth · sell at horizon
- IRR
- -17.4%
- Equity multiple
- 0.40×
- Total profit
- $-38,845
- Equity at exit
- $34,279
- IRR
- -13.8%
- Equity multiple
- 0.27×
- Total profit
- $-46,852
- Equity at exit
- $19,878
Cash invested: $64,372 (down + closing). Projections, not guarantees.
Landlord ↔ Tenant lean methodology
- Overall (STATE)
- 15 Strongly Tenant-Friendly
- State New York
- 15 Strongly Tenant-Friendly · D+10
- County
- — inherits STATE
- City
- — inherits STATE
ZIP-level market 14215
- Home prices YoY
- -30.0%
- Rents YoY
- 0.7%
- Active inventory
- 239
- Price-to-rent
- 10.8×
Monthly cashflow live
- Estimated rent
- $1,770 high interval (Pro) →
- Mortgage (P&I)
- −$1,206
- Tax from tax record
- −$56 /mo · $674/yr
- Insurance
- −$96
- HOA
- −$0
- Vacancy / Maint / Mgmt
- −$372
- Net cashflow
- $40
Break-even live
Sensitivity live
| Price | -10% $171 | -5% $106 | +0% $40 | +5% $-25 | +10% $-90 |
|---|---|---|---|---|---|
| Rent | -10% $-99 | -5% $-29 | +0% $40 | +5% $110 | +10% $180 |
| Rate | -1.0pp $156 | -0.5pp $99 | base $40 | +0.5pp $-19 | +1.0pp $-80 |
UW: 25.0% down · 7.5% · 30yr · 1.5% tax · 5.0% vac · 8.0% maint · 8.0% mgmt
Financing live
Cash to close
- Down payment
- $57,475
- Closing costs
- $6,897
- Reserves months
- —
- Total cash needed
- —
Loan-product check · same deal, 3 products live
Conventional
25% down · 7.5% · 30yr
- Down + closing
- —
- Monthly P&I
- —
- Monthly cashflow
- —
- DSCR
- —
- Eligible?
- —
Personal DTI + credit; lowest rate.
DSCR
20% down · 8.5% · 30yr
- Down + closing
- —
- Monthly P&I
- —
- Monthly cashflow
- —
- DSCR
- —
- Eligible?
- —
No personal income docs; deal must DSCR.
Hard money
10% down · 12.0% · 12mo
- Down + closing
- —
- Monthly P&I
- —
- Monthly cashflow
- —
- DSCR
- —
- Eligible?
- —
Short-term bridge; refi at stabilization.
Rent comps 21 comps
| Address | Beds | Baths | Sqft | Rent | $/sqft | DOM | Units | Dist |
|---|---|---|---|---|---|---|---|---|
| 265 Lisbon Ave Unit 2 Buffalo, NY | 3.0 | 1.0 | 1200 | $1,400 | $1.17 | 45d | 1 | 0.06mi |
| 222 Lisbon Ave Buffalo, NY | 4.0 | 1.0 | 1300 | $1,400 | $1.08 | 25d | 1 | 0.07mi |
| 222 Lisbon Ave Unit Upper Buffalo, NY | 3.0 | 1.0 | 1400 | $1,400 | $1.00 | 45d | 1 | 0.07mi |
| 263 Minnesota Ave Unit Upper Buffalo, NY | 3.0 | 1.0 | 1242 | $1,500 | $1.21 | 16d | 1 | 0.13mi |
| 175 Lisbon Ave Buffalo, NY | 5.0 | 2.0 | 2000 | $2,500 | $1.25 | 16d | 1 | 0.17mi |
| 65 Northrup Pl Buffalo, NY | 5.0 | 2.0 | 1467 | $2,500 | $1.70 | 16d | 1 | 0.28mi |
| 85 Highgate Ave Buffalo, NY | 5.0 | 2.0 | 2193 | $3,750 | $1.71 | 16d | 1 | 0.29mi |
| 89 Lasalle Ave Buffalo, NY | 1.0–4.0 | 1.0–4.0 | 1024 | $2,997 | $2.93 | 3d | 10 | 0.48mi |
| 60 Englewood Ave Buffalo, NY | 4.0 | 1.0 | 1400 | $1,650 | $1.18 | 3d | 1 | 0.54mi |
| 63 Montrose Ave Buffalo, NY | 4.0 | 1.0 | 2240 | $2,000 | $0.89 | 3d | 1 | 0.68mi |
| 189 Westminster Ave Buffalo, NY | 4.0 | 1.5 | 1065 | $1,595 | $1.50 | 12d | 1 | 0.75mi |
| 25 Parkridge Ave Buffalo, NY | 3.0 | 1.0 | 1914 | $1,350 | $0.71 | 16d | 1 | 0.87mi |
| 91 Springville Ave Buffalo, NY | 4.0 | 2.0 | 1660 | $2,350 | $1.42 | 25d | 1 | 0.93mi |
| 163 Carmel Rd Buffalo, NY | 3.0 | 1.0 | 1400 | $1,800 | $1.29 | 4d | 1 | 0.98mi |
| 33 Tillotson Pl Buffalo, NY | 3.0 | 1.0 | 1143 | $2,095 | $1.83 | 16d | 1 | 1.15mi |
| 348 Capen Blvd Buffalo, NY | 3.0 | 1.5 | 1424 | $2,200 | $1.54 | 3d | 1 | 1.24mi |
| 4098 Bailey Ave Buffalo, NY | 5.0 | 2.5 | 2108 | $2,200 | $1.04 | 45d | 1 | 1.31mi |
| 76 Vernon Pl Unit Upper Buffalo, NY | 3.0 | 1.0 | 1190 | $1,595 | $1.34 | 16d | 1 | 1.32mi |
| 76 Vernon Pl Unit Lower Buffalo, NY | 3.0 | 1.0 | 1190 | $1,445 | $1.21 | 16d | 1 | 1.32mi |
| 524 University Ave Buffalo, NY | 3.0 | 1.0 | 1840 | $1,600 | $0.87 | 3d | 1 | 1.36mi |
| 74 Dorris Ave Buffalo, NY | 3.0 | 1.0 | 1200 | $1,450 | $1.21 | 45d | 1 | 1.50mi |
Listing history 29 events
-
2026-06-21days on market $229,900 Active 61 DOM
-
2026-06-18days on market $229,900 Active 58 DOM
-
2026-06-17days on market $229,900 Active 57 DOM
-
2026-06-16days on market $229,900 Active 56 DOM
-
2026-06-15days on market $229,900 Active 55 DOM
-
2026-06-13days on market $229,900 Active 53 DOM
-
2026-06-13days on market $229,900 Active 52 DOM
-
2026-06-10days on market $229,900 Active 50 DOM
-
2026-06-09days on market $229,900 Active 49 DOM
-
2026-06-08days on market $229,900 Active 48 DOM
-
2026-06-07days on market $229,900 Active 47 DOM
-
2026-06-03days on market $229,900 Active 43 DOM
-
2026-06-02days on market $229,900 Active 42 DOM
-
2026-06-01days on market $229,900 Active 41 DOM
-
2026-05-31days on market $229,900 Active 40 DOM
-
2026-05-16price $229,900 1183-char remark
-
2026-04-21$249,900 Active 1183-char remark
-
2026-01-11historical $2,100
-
2025-11-13$2,100
-
2025-11-12$239,900 Active
-
2025-11-11historical $2,100
-
2025-11-10historical
-
2025-08-26$2,100
-
2025-06-10$239,900 Active
-
2019-12-05soldstatus $112,000
-
2019-12-04soldstatus $111,500 Closed Sale or Rented
-
2019-08-14status Under Contract- Do Not Show
-
2019-07-24price $124,900
-
2019-07-03$129,500 Active
ⓘ Source: listings_history table (triggers on properties + properties_extension) + one-shot
backfill from property_details.listing_events for pre-trigger history.
Tax reassessment forecast NY · Partial reset (capped growth)
- Current annual tax
- $674 · $56/mo
- Projected year-2 tax
- $2,279 · $190/mo
- Expected delta
- +$1,606/yr (+$134/mo · 238.4%)
ⓘ Screening estimate from a state-policy table — verify with the county assessor before closing.
Climate risk First Street
- Flood 1/10 Low FEMA zone X (unshaded) · 0% chance over 30 yrs
- Wildfire 1/10 Low
- Heat 3/10 Moderate 7 d/yr ≥92°F today · 15 d/yr by 30 yrs out
- Wind 1/10 Low
- Air quality 3/10 Moderate 2 unhealthy d/yr today · 3 by 30 yrs out
Nearby sold comps map
Loading sold comps map…
Walkable amenities ~0.75 mi
Loading nearby amenities…
Taxation est. · year 1
- Rental income
- $21,236
- − Mortgage interest
- −$12,878
- − Property taxes
- −$674
- − Insurance
- −$1,150
- − Repairs & maintenance
- −$1,699
- − Management
- −$1,699
- − Depreciation
- −$6,688
- Taxable loss
- −$3,551
- Est. tax savings @ 24.0%
- +$852
- After-tax cash flow
- $1,338/yr
For passive investors: Depreciation is non-cash, so a rental often shows a tax loss while cash-flowing — sheltering income. Rental losses are passive: they offset passive income freely, and up to $25,000/yr can offset ordinary (W-2) income if you actively participate and your MAGI is under $100k (phasing out to $0 by $150k); unused losses carry forward. On sale, claimed depreciation is recaptured at up to 25%, and gains may owe capital-gains tax (a 1031 exchange can defer both). Figures are a year-1 estimate at your 24.0% rate — not tax advice; consult a CPA.
Schools (NCES district)
- District
- Buffalo City School District
- NCES district ID
- 3605850
- Math proficiency
- 41% ▲ 11.00%
- Reading proficiency
- 40% ▲ 7.00%
- Median HH income
- $31,665
- Composite
- 33.17/100
- National rank
- #5544
- State rank
- #535 of 590 in NY
Livability — Buffalo
- Score
- 77/100
- State rank
- #195
- US rank
- #3011
Category grades
Schools grade is shown separately in the Schools card above.
Census & demographics
- Census place
- Buffalo, NY
- County
- Erie County · 714,559 people
- City population
- 440,021
- Metro
- Buffalo-Cheektowaga, NY
- Population (ZIP)
- 42,524
- Household income
- $44,955
- Rent vs Own
- Severe rent burden
- 2873.0
Population outlook (Erie County) Hauer SSP2
- Today (2025)
- 933,037 people
- By 2030
- 935,181 · +0.2%
- By 2040
- 928,531 · -0.5%
- By 2050
- 905,725 · -2.9%
- By 2075
- 834,037 · -10.6%
- By 2100
- 708,033 · -24.1%
Race, ethnicity, and origin ACS 2023
- Neighborhood character
- Predominantly Black (67%)
- Race & ethnicity
- Black 67% White 15% Asian 7% Hispanic / Latino 6% Two or more races 6%
- Hispanic origin (detail)
- Puerto Rican 4%
- Common ancestry
- Romanian 4% Lithuanian 1% Italian 1%
- Foreign-born
- 9% · Canada, China
- Languages at home
- 88% English-only · Other Indo-European 4% Spanish 4% Chinese 1%
Political lean MEDSL · Erie
- 2024 margin
- Lean D (+9.7) · D 54.8% · R 45.2%
- 2008→2024 swing
- -7.9pp toward R · 2008: 17.5pp · 2024: 9.7pp
- All cycles
- 2024: D+9.7 2020: D+14.7 2016: D+4.8 2012: D+15.6 2008: D+17.5
Not yet ingested
- Civics
- —
Market trends
- HPI YoY
- ▼ -126.29%
- Current HPI
- 295.2966
- Rent YoY
- ▲ 0.67%
- Metro
- Buffalo-Cheektowaga, NY
- State GDP YoY
- ▲ 2.60%
- F500 in state
- 92
Industry mix (Fortune 500 HQ in NY)
| Industry | F500 HQs | Revenue |
|---|---|---|
| Financial Services | 10 | $950B |
|
||
| Consumer Goods | 9 | $162B |
|
||
| Insurance | 4 | $225B |
|
||
| Telecommunications | 2 | $144B |
|
||
| Pharmaceuticals | 2 | $112B |
|
||
| Media / Entertainment | 2 | $69B |
|
||
Price history
+77.5% since first listed14 events — show timeline
- 2026-05-16 Price Changed $229,900 WNYREIS
- 2026-04-21 Listed $249,900 WNYREIS
- 2026-01-11 Rental Removed $2,100 WNYREIS
- 2025-11-13 Listed for Rent $2,100 WNYREIS
- 2025-11-12 Listed $239,900 WNYREIS
- 2025-11-11 Rental Removed $2,100 WNYREIS
- 2025-11-10 Listing Removed — WNYREIS
- 2025-08-26 Listed for Rent $2,100 WNYREIS
- 2025-06-10 Listed $239,900 WNYREIS
- 2019-12-05 Sold (Public Records) $112,000 Public Records
- 2019-12-04 Sold (MLS) $111,500 WNYREIS
- 2019-08-14 Pending — WNYREIS
- 2019-07-24 Price Changed $124,900 WNYREIS
- 2019-07-03 Listed $129,500 WNYREIS
Property tax history
+5.0%/yrLatest (2025): $674 · +14.5% YoY. Source: county tax records.
Cash-flow waterfall
monthlySold comps — $/sqft
last 12 mo · ≤1 miLoading sold comps…