9510 Doris Deno Ave · D'Iberville, MS
Flood risk 8/10 · Major
- FEMA flood zone
- AE
- Chance of flooding over 30 yrs
- 0.96%
- Est. flood insurance / yr
- $1,737 – $8,500
Fire risk 1/10 · Minimal
- Est. fire insurance / yr
- $1,241 – $2,305
Heat risk 10/10 · Severe
- Hot days now (above 106°F)
- 7 days/yr
- Hot days in 30 yrs
- 21 days/yr
Wind risk 9/10 · Severe
- Chance of severe wind over 30 yrs
- 99.0%
Air-quality risk 2/10 · Minimal
- Unhealthy air days now
- 1 days/yr
- Unhealthy air days in 30 yrs
- 2 days/yr
Risk factors via First Street. Map © Google.
Why this score? — see what drove the D+ grade
The composite is a weighted blend of 9 inputs, each scored 0–100. Each bar is that input's sub-score; the figure is the points it added to the 100-point composite (weight × sub-score).
- Cash flow +17.6/30.0
- ARV discount +7.5/15.0
- DSCR +5.5/10.0
- Schools +4.2/10.0
- 1% rule +3.5/10.0
- Rent growth +2.5/5.0
- Livability +2.5/5.0
- Condition / age +2.5/5.0
- Appreciation +0.0/10.0
$150,000
🖨 Deal sheet 📄 Offer letter ✓ Due diligence
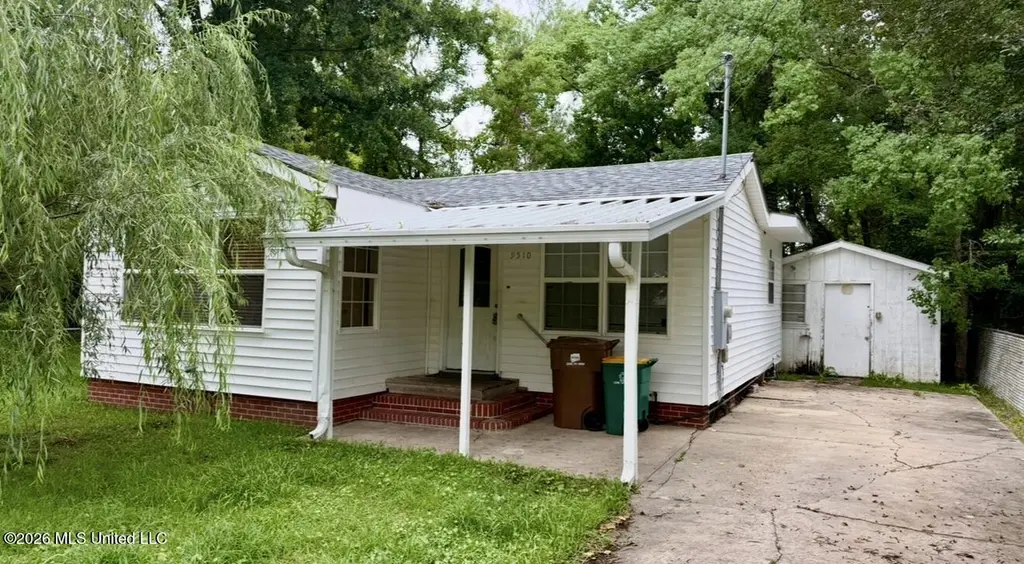
Listing remarks
Downtown D'Iberville Cottage with Short-Term Rental & Investment Potential! Rare opportunity to own a charming cottage in the heart of Downtown D'Iberville on the beautiful Mississippi Gulf Coast. This versatile property offers endless possibilities and can be used as a primary residence, vacation home, Airbnb, short-term rental, long-term rental, or even a potential business location (buyer to verify permitted uses). Located in D'Iberville's growing casino district, you'll love being within walking distance of the Scarlet Pearl Casino Resort, local restaurants, shopping, entertainment, and just minutes from Biloxi beaches, casinos, Keesler Air Force Base, and all the attractions that
Key facts
- Open concept kitchen
- Near biloxi beaches
- 3,484 sq ft lot
Tags
Property features AI
Finance
- Other: Lot dimensions approximately 49 x 78 x 51 x 78; Lot size about 0.08 acre
- Financial info: Not specified
- HOA & community: Not specified
Exterior
- Parking: 1-car garage; Driveway; On-street parking; Concrete surfaces
- Security: Not specified
- Utilities: Public water; Public sewer; Electricity connected; Sewer connected; Water connected
- Home design: Single family residence; One story; Approximately 1,000 building area; Siding construction
- Construction: Shingle roof; Siding exterior; Year built from public records
- Exterior features: Front porch; Patio/porch awning(s); Cabana; Outbuilding; Shed(s); Storage; Workshop; Back yard fencing; City lot
Interior
- Kitchen: Electric range; Free-standing refrigerator
- Bedrooms: Not specified
- Flooring: Laminate
- Bathrooms: 2 full bathrooms
- Heating & cooling: Electric heating; Central air; Ceiling fan(s)
- Interior features: Move-in ready condition; Awning(s); Rain gutters
- Laundry & utility: Laundry inside on the main level
Neighborhood map
What this means for you Summary
Snapshot
- This is a 2-bed/2.0-bath single-family listed at $150k.
Deal economics
- At list price, monthly cash flow is $-307 ($-4k/yr) — negative.
- To cash-flow at today's rent, offer at most $96k (36.2% below list).
- To meet the 1% rule (rent ≥ 1% of price), the offer needs to be $128k (14.6% below list).
- Recommended offer: $96k (36.2% below list) — sets the bar for cash-flow.
- Cap rate 7.2% vs local median 5.4% in D'Iberville — top-decile yield for the area; either an underpriced asset or a hidden risk that comps aren't pricing in. Stress-test before assuming the spread holds.
Location & tenants
- Location reads: area grade D — affects rentability + tenant quality, not the cash-flow math above.
- Harrison County School District (rural): math 52% / reading 46% proficiency, ranked #14 of 130 in MS (top 11%) — families likely to look elsewhere, expect single-tenant / working-renter base with shorter leases; 62% free/reduced lunch — lower-income household profile, screen leases tightly.
- Market conditions: 89 active listings in the ZIP; 2 comparable units currently listed for rent nearby; 2,194 units permitted in Harrison County in 2024 (0 in 5+ unit buildings).
Forward outlook
- Local home prices are declining (-3.0%/yr); year-one equity from $1k of loan paydown is wiped out by about $4k of value loss. Plan a longer hold.
- Harrison County population projected at +27% by 2050 — long-run rental-demand tailwind backs the buy-and-hold thesis.
Negotiation context
- It's been on market 15 days — a 2% lower offer ($148k) is reasonable based on typical stale-listing flexibility.
Risks & watch-outs
- Watch-outs: flood insurance adds $427/mo; built in 1945 — expect roof / HVAC / electrical / plumbing capex.
- Climate carrying-cost: in FEMA flood zone AE (mandatory federal flood insurance); severe wind risk, 99% chance of damaging wind over 30y; extreme-heat days projected 7→21/yr by 2055 (HVAC capex compounding) — expect insurance premiums to compound above CPI over the hold.
Questions for the listing agent
- What do current leases actually rent for vs. the listed asking? Can we see a recent rent roll and the last 12 months of T-12 income?
- Built in 1945 — when were the roof, HVAC, electrical panel, plumbing, and water heater last replaced?
- What's the actual annual flood-insurance premium (NFIP or private), and is the property in a SFHA with mandatory coverage?
- Is there a deadline driving the sale (1031 exchange, divorce, estate, relocation)? That informs how much negotiation room exists.
- The area grade is low — what's the realistic commute time and amenity access for the typical tenant pool here? Any planned neighborhood developments (good or bad) we should know about?
- What's the average days-on-market for RENTAL listings here right now (not sales)? A rising rental-DOM trend means longer vacancies and softer asking-rent achievability than the comps imply.
- What's the recent tenant-quality profile in this submarket — average credit score on applications, eviction rate, late-payment / NSF rate, and stable-employment percentage? A property-management company in the area should have these aggregated.
- How much new for-sale + rental construction is in the pipeline within 1–3 miles? Heavy new supply typically softens prices + rents 12–24 months out; constrained supply supports both.
Investment metrics
- 1% rule
- 0.85% ✗
- Cap rate
- 7.25%
- Cash-on-cash
- 3.40%
- DSCR
- 1.15
- GRM
- 9.8
CMA / ARV
- ARV (on-the-fly)
- $96,492
- Comps found
- 1
Show comp detail 1 sale within ~0.75 mi
| Address | Dist | Beds/Ba | Sqft | Sold | Price | $/sf | Match |
|---|---|---|---|---|---|---|---|
| 10103 Fournier Ave | 0.36mi | 2/1.0 | 660 (-12%) | 23mo | $85,000 | $129 | 40 |
Match score weights: distance 35% · size 25% · config 20% · recency 20%. Top-matched comps best support the ARV.
Projected returns pro-forma
-3.0% appreciation · 3.0% rent growth · sell at horizon
- IRR
- -31.6%
- Equity multiple
- -0.04×
- Total profit
- $-43,696
- Equity at exit
- $22,365
- IRR
- -34.7%
- Equity multiple
- -0.49×
- Total profit
- $-62,480
- Equity at exit
- $12,969
Cash invested: $42,000 (down + closing). Projections, not guarantees.
Landlord ↔ Tenant lean methodology
- Overall (STATE)
- 90 Strongly Landlord-Friendly
- State Mississippi
- 90 Strongly Landlord-Friendly · R+11
- County
- — inherits STATE
- City
- — inherits STATE
ZIP-level market 39540
- Home prices YoY
- -30.9%
- Active inventory
- 89
- Price-to-rent
- 9.8×
Monthly cashflow live
- Estimated rent
- $1,282 medium interval (Pro) →
- Mortgage (P&I)
- −$787
- Tax from tax record
- −$44 /mo · $532/yr
- Insurance
- −$62
- Flood insurance flood zone
- −$427 /mo · $5,118/yr
- HOA
- −$0
- Vacancy / Maint / Mgmt
- −$269
- Net cashflow
- $-307
Break-even live
UW: 25.0% down · 7.5% · 30yr · 1.5% tax · 5.0% vac · 8.0% maint · 8.0% mgmt
Financing live
Cash to close
- Down payment
- $37,500
- Closing costs
- $4,500
- Reserves months
- —
- Total cash needed
- —
Loan-product check · same deal, 3 products live
Conventional
25% down · 7.5% · 30yr
- Down + closing
- —
- Monthly P&I
- —
- Monthly cashflow
- —
- DSCR
- —
- Eligible?
- —
Personal DTI + credit; lowest rate.
DSCR
20% down · 8.5% · 30yr
- Down + closing
- —
- Monthly P&I
- —
- Monthly cashflow
- —
- DSCR
- —
- Eligible?
- —
No personal income docs; deal must DSCR.
Hard money
10% down · 12.0% · 12mo
- Down + closing
- —
- Monthly P&I
- —
- Monthly cashflow
- —
- DSCR
- —
- Eligible?
- —
Short-term bridge; refi at stabilization.
Rent comps 2 comps
| Address | Beds | Baths | Sqft | Rent | $/sqft | DOM | Units | Dist |
|---|---|---|---|---|---|---|---|---|
| 508 Tasha Dr Diberville, MS | 1.0 | 1.0 | 500 | $1,800 | $3.60 | 44d | 1 | 0.87mi |
| 10687 Auto Mall Pkwy D'Iberville, MS | 1.0 | 1.0 | 715 | $787 | $1.10 | 13d | 1 | 1.18mi |
Listing history 11 events
-
2026-06-18days on market $150,000 Active 15 DOM
-
2026-06-17days on market $150,000 Active 14 DOM
-
2026-06-16days on market $150,000 Active 13 DOM
-
2026-06-15days on market $150,000 Active 12 DOM
-
2026-06-14days on market $150,000 Active 10 DOM
-
2026-06-13days on market $150,000 Active 9 DOM
-
2026-06-10days on market $150,000 Active 7 DOM
-
2026-06-09days on market $150,000 Active 6 DOM
-
2026-06-08days on market $150,000 Active 5 DOM
-
2026-06-07remarks 695-char remark
-
2026-06-07$150,000 Active 4 DOM
ⓘ Source: listings_history table (triggers on properties + properties_extension) + one-shot
backfill from property_details.listing_events for pre-trigger history.
Tax reassessment forecast MS · Resets to sale price
- Current annual tax
- $532 · $44/mo
- Projected year-2 tax
- $1,185 · $99/mo
- Expected delta
- +$653/yr (+$54/mo · 122.9%)
ⓘ Screening estimate from a state-policy table — verify with the county assessor before closing.
Climate risk First Street
- Flood 8/10 Severe FEMA zone AE · 96% chance over 30 yrs
- Wildfire 1/10 Low
- Heat 10/10 Extreme 7 d/yr ≥106°F today · 21 d/yr by 30 yrs out
- Wind 9/10 Extreme 99% chance of damaging wind over 30 yrs
- Air quality 2/10 Low 1 unhealthy d/yr today · 2 by 30 yrs out
Nearby sold comps map
Loading sold comps map…
Walkable amenities ~0.75 mi
Loading nearby amenities…
Taxation est. · year 1
- Rental income
- $15,379
- − Mortgage interest
- −$8,402
- − Property taxes
- −$532
- − Insurance
- −$5,868
- − Repairs & maintenance
- −$1,230
- − Management
- −$1,230
- − Depreciation
- −$4,364
- Taxable loss
- −$6,247
- Est. tax savings @ 24.0%
- +$1,499
- After-tax cash flow
- $-2,190/yr
For passive investors: Depreciation is non-cash, so a rental often shows a tax loss while cash-flowing — sheltering income. Rental losses are passive: they offset passive income freely, and up to $25,000/yr can offset ordinary (W-2) income if you actively participate and your MAGI is under $100k (phasing out to $0 by $150k); unused losses carry forward. On sale, claimed depreciation is recaptured at up to 25%, and gains may owe capital-gains tax (a 1031 exchange can defer both). Figures are a year-1 estimate at your 24.0% rate — not tax advice; consult a CPA.
Schools (NCES district)
- District
- Harrison County School District
- NCES district ID
- 2801770
- Math proficiency
- 52% ▼ -4.00%
- Reading proficiency
- 46% ▼ -4.00%
- Median HH income
- $46,504
- Composite
- 41.66/100
- National rank
- #3419
- State rank
- #14 of 130 in MS
Livability — D'Iberville
No livability data for this city. (Only ~50 U.S. cities are tracked.)
Census & demographics
- Census place
- D'Iberville, MS
- Population (ZIP)
- 13,033
Population outlook (Harrison County) Hauer SSP2
- Today (2025)
- 228,444 people
- By 2030
- 241,942 · +5.9%
- By 2040
- 267,531 · +17.1%
- By 2050
- 291,062 · +27.4%
- By 2075
- 346,711 · +51.8%
- By 2100
- 378,165 · +65.5%
Race, ethnicity, and origin ACS 2023
- Neighborhood character
- Diverse neighborhood (Simpson 0.60)
- Race & ethnicity
- White 60% Black 18% Asian 10% Two or more races 9% Hispanic / Latino 9%
- Hispanic origin (detail)
- Common ancestry
- Romanian 5% Slovak 4% Lithuanian 3%
- Foreign-born
- 12% · Canada, Vietnam, South Korea
- Languages at home
- 85% English-only · Spanish 6% Vietnamese 6% Other Asian/Pacific 1%
Political lean MEDSL · Harrison
- 2024 margin
- Strong R (+28.9) · D 35.0% · R 63.9% · Other 1.1%
- 2008→2024 swing
- -2.9pp toward R · 2008: -26.0pp · 2024: -28.9pp
- All cycles
- 2024: R+28.9 2020: R+25.2 2016: R+30.7 2012: R+26.6 2008: R+26.0
Not yet ingested
- Civics
- —
Market trends
- HPI YoY
- ▼ -83.70%
- Current HPI
- 187.2895
- Rent YoY
- —
- Metro
- —
- State GDP YoY
- —
- F500 in state
- 0
Price history
1 event — show timeline
- 2026-06-03 Listed $150,000 MLSU
Property tax history
+4.3%/yrLatest (2025): $532 · +5.5% YoY. Source: county tax records.
Cash-flow waterfall
monthlySold comps — $/sqft
last 12 mo · ≤1 miLoading sold comps…