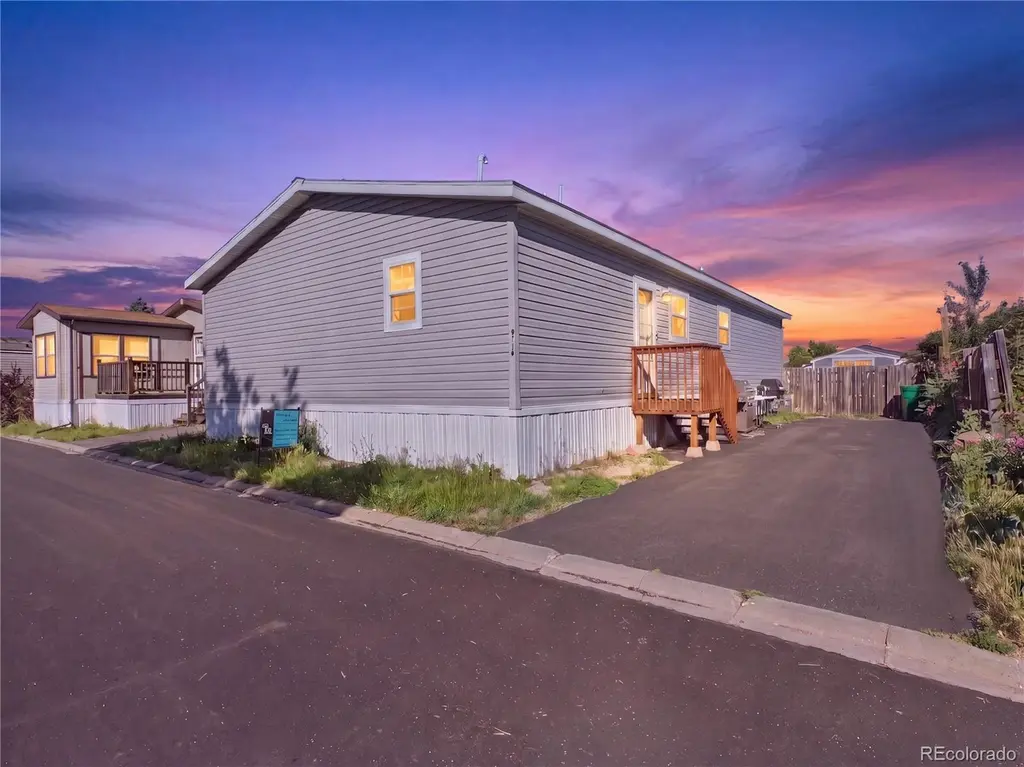
9710 Lark St · Federal Heights, CO
Flood risk 1/10 · Minimal
- FEMA flood zone
- X (unshaded)
- Chance of flooding over 30 yrs
- 0.0%
- Est. flood insurance / yr
- $507 – $1,088
Fire risk 1/10 · Minimal
- Est. fire insurance / yr
- $939 – $1,743
Heat risk 3/10 · Minor
- Hot days now (above 92°F)
- 7 days/yr
- Hot days in 30 yrs
- 18 days/yr
Wind risk 2/10 · Minimal
- Chance of severe wind over 30 yrs
- —
Air-quality risk 4/10 · Minor
- Unhealthy air days now
- 6 days/yr
- Unhealthy air days in 30 yrs
- 8 days/yr
Risk factors via First Street. Map © Google.
Why this score? — see what drove the C+ grade
The composite is a weighted blend of 9 inputs, each scored 0–100. Each bar is that input's sub-score; the figure is the points it added to the 100-point composite (weight × sub-score).
- Cash flow +26.9/30.0
- DSCR +9.3/10.0
- ARV discount +7.5/15.0
- 1% rule +7.2/10.0
- Condition / age +4.0/5.0
- Livability +3.8/5.0
- Schools +3.5/10.0
- Rent growth +2.7/5.0
- Appreciation +0.0/10.0
$199,900
🖨 Deal sheet (PDF) 📄 Offer letter ✓ Due diligence
Listing remarks
Welcome home! This charming and affordable manufactured home was built in 2023. Modern, bright, and open layout with spacious living area, contemporary kitchen and a large Primary suite separated from the spare bedrooms by the living room and kitchen. This inviting residence offers a comfortable and functional layout with bright living spaces, a spacious modern farmhouse kitchen with white cabinets, stainless steel appliances and a breakfast nook that opens up to the living room. Enjoy the convenience of updated systems and newer construction, providing peace of mind and lower maintenance. Large storage shed. Prime Metro Denver location, this home offers easy access to shopping, dining, sch
Key facts
- Open floor plan
- Community clubhouse
- Natural light
Tags
Property features AI
Finance
- Other: Lot number 191
- Financial info: Monthly land lease: $1,100 (lease expires July 31, 2026)
- HOA & community: Located in Denver Cascade mobile home park; Land lease in place
Exterior
- Parking: Total of 4 parking spaces; Two off-street spaces
- Utilities: Public sewer
- Home design: Manufactured home (in park); Model: LIFESTYLE; Individual ownership; Entry located on main level
- Construction: Vinyl siding; Composition roof
- Exterior features: Partial fencing; Brick driveway
Interior
- Bedrooms: Four bedrooms, all on the main level
- Bathrooms: Two full bathrooms, both on the main level
- Heating & cooling: Forced air heating; Central air conditioning
- Interior features: Main-level living throughout
Neighborhood map
What this means for you Summary
Snapshot
- This is a 4-bed/2.0-bath manufactured listed at $200k. Condition is rated good.
Deal economics
- At list price, monthly cash flow is $553 ($7k/yr) — positive.
- The deal already cash-flows at list — no discount required.
- Meets the 1% rule at list price ($2k rent vs $200k).
- Cap rate 9.6% vs local median 4.2% in Federal Heights — top-decile yield for the area; either an underpriced asset or a hidden risk that comps aren't pricing in. Stress-test before assuming the spread holds.
Location & tenants
- Location reads 76/100 on livability (#28 in CO, #3,380 nationally) — a middle-class / working-renter tenant base. Strengths: commute A+, cost of living A+, housing A+; Watch: health & safety D+, crime F.
- Adams 12 Five Star Schools (suburban): math 31% / reading 46% proficiency, ranked #26 of 86 in CO (top 30%) — families likely to look elsewhere, expect single-tenant / working-renter base with shorter leases.
- Zoned schools: Federal Heights Elementary School (math 2% / reading 8%, grade F, #958 of 966 statewide, top 100%, 414 students, 87% FRL); Northglenn Middle School (math 8% / reading 12%, grade F, #246 of 270 statewide, top 91%, 684 students, 85% FRL); Northglenn High School (math 16% / reading 38%, grade F, #257 of 381 statewide, top 68%, 1,959 students, 69% FRL) — zoned schools average 81% FRL vs 33% district-wide (47 pts higher); higher-poverty schools than district average — tighter screening recommended.
- Zoned-school proficiency averages 14% at this address vs 38% district-wide (-24 pts) — the specific schools serving this property underperform the Adams 12 Five Star Schools average; the district grade overstates school quality for this exact location.
- Market conditions: Rents flat; 136 active listings in the ZIP; 18 comparable units currently listed for rent nearby; rentals at typical pace (median 25d on market — plan ~3-4 weeks tenant-placement turnaround); 2,299 units permitted in Adams County in 2024 (343 in 5+ unit buildings).
- At $2,448/mo this rent would consume 47% of the median local household income ($62k/yr) (locally 1521% of renters already pay >50% of income on rent) — very limited rent-growth headroom before tenants either downsize or default.
Forward outlook
- Local home prices are declining (-3.0%/yr); year-one equity from $1k of loan paydown is wiped out by about $6k of value loss. Plan a longer hold.
- Adams County population projected at +44% by 2050 — long-run rental-demand tailwind backs the buy-and-hold thesis.
Negotiation context
- Only 9 days on market — expect competitive offers; lowballing is unlikely to land.
Questions for the listing agent
- Is there a deadline driving the sale (1031 exchange, divorce, estate, relocation)? That informs how much negotiation room exists.
- Schools are F-rated, which usually means shorter tenancies and higher turnover. Who's the typical renter profile here, and what's been the actual vacancy rate?
- Crime grade is F in this area — have there been break-ins, vandalism, or insurance claims at this property in the last 3 years? What carrier currently insures it and at what premium?
- What's the average days-on-market for RENTAL listings here right now (not sales)? A rising rental-DOM trend means longer vacancies and softer asking-rent achievability than the comps imply.
- What's the recent tenant-quality profile in this submarket — average credit score on applications, eviction rate, late-payment / NSF rate, and stable-employment percentage? A property-management company in the area should have these aggregated.
- How much new for-sale + rental construction is in the pipeline within 1–3 miles? Heavy new supply typically softens prices + rents 12–24 months out; constrained supply supports both.
Investment metrics
- 1% rule
- 1.22% ✓
- Cap rate
- 9.61%
- Cash-on-cash
- 11.85%
- DSCR
- 1.53
- GRM
- 6.8
CMA / ARV
- ARV (on-the-fly)
- $84,842
- Comps found
- 12
Show comp detail 12 sales within ~0.75 mi
| Address | Dist | Beds/Ba | Sqft | Sold | Price | $/sf | Match |
|---|---|---|---|---|---|---|---|
| 2685 Hawk St | 0.13mi | 3/2.0 (-1) | 1,488 (+4%) | 2mo | $49,900 | $34 | 82 |
| 9755 Elderberry St | 0.06mi | 3/2.0 (-1) | 1,344 (-6%) | 2mo | $85,000 | $63 | 80 |
| 2920 Dove St | 0.20mi | 3/2.0 (-1) | 1,512 (+5%) | 7mo | $70,000 | $46 | 71 |
| 2551 W 92nd Ave | 0.41mi | 3/2.0 (-1) | 1,560 (+8%) | 7mo | $130,500 | $84 | 56 |
| 1801 W 92nd Ave | 0.55mi | 3/2.0 (-1) | 1,512 (+5%) | 7mo | $80,000 | $53 | 55 |
| 1801 W 92nd Ave | 0.55mi | 3/2.0 (-1) | 1,344 (-6%) | 8mo | $93,000 | $69 | 52 |
| 1801 W 92nd Ave #652 | 0.55mi | 3/2.0 (-1) | 1,344 (-6%) | 9mo | $16,000 | $12 | 51 |
| 1801 W 92nd Ave | 0.55mi | 3/2.0 (-1) | 1,568 (+9%) | 7mo | $85,000 | $54 | 49 |
| 1801 W 92nd Ave #61 | 0.55mi | 3/2.0 (-1) | 1,344 (-6%) | 12mo | $56,500 | $42 | 48 |
| 1801 W 92nd Ave | 0.55mi | 3/2.0 (-1) | 1,568 (+9%) | 8mo | $93,000 | $59 | 48 |
| 2551 W 92 Ave | 0.41mi | 3/2.0 (-1) | 1,232 (-14%) | 8mo | $115,000 | $93 | 46 |
| 1801 W 92nd Ave | 0.55mi | 3/2.0 (-1) | 1,248 (-13%) | 6mo | $76,000 | $61 | 42 |
Match score weights: distance 35% · size 25% · config 20% · recency 20%. Top-matched comps best support the ARV.
Projected returns pro-forma
-3.0% appreciation · 0.77% rent growth · sell at horizon
- IRR
- -1.2%
- Equity multiple
- 0.95×
- Total profit
- $-2,538
- Equity at exit
- $29,806
- IRR
- 5.9%
- Equity multiple
- 1.40×
- Total profit
- $22,168
- Equity at exit
- $17,284
Cash invested: $55,972 (down + closing). Projections, not guarantees.
Landlord ↔ Tenant lean methodology
- Overall (STATE)
- 38 Tenant-Leaning
- State Colorado
- 38 Tenant-Leaning · D+4
- County
- — inherits STATE
- City
- — inherits STATE
ZIP-level market 80260
- Rents YoY
- 0.8%
- Active inventory
- 136
- Price-to-rent
- 6.8×
Monthly cashflow live
- Estimated rent
- $2,448 high interval (Pro) →
- Mortgage (P&I)
- −$1,048
- Tax est. 1.5%
- −$250 /mo · $2,998/yr
- Insurance
- −$83
- HOA
- −$0
- Vacancy / Maint / Mgmt
- −$514
- Net cashflow
- $553
Break-even live
Sensitivity live
| Price | -10% $691 | -5% $622 | +0% $553 | +5% $483 | +10% $414 |
|---|---|---|---|---|---|
| Rent | -10% $359 | -5% $456 | +0% $553 | +5% $649 | +10% $746 |
| Rate | -1.0pp $653 | -0.5pp $603 | base $553 | +0.5pp $501 | +1.0pp $448 |
UW: 25.0% down · 7.5% · 30yr · 1.5% tax · 5.0% vac · 8.0% maint · 8.0% mgmt
Financing live
Cash to close
- Down payment
- $49,975
- Closing costs
- $5,997
- Reserves months
- —
- Total cash needed
- —
Loan-product check · same deal, 3 products live
Conventional
25% down · 7.5% · 30yr
- Down + closing
- —
- Monthly P&I
- —
- Monthly cashflow
- —
- DSCR
- —
- Eligible?
- —
Personal DTI + credit; lowest rate.
DSCR
20% down · 8.5% · 30yr
- Down + closing
- —
- Monthly P&I
- —
- Monthly cashflow
- —
- DSCR
- —
- Eligible?
- —
No personal income docs; deal must DSCR.
Hard money
10% down · 12.0% · 12mo
- Down + closing
- —
- Monthly P&I
- —
- Monthly cashflow
- —
- DSCR
- —
- Eligible?
- —
Short-term bridge; refi at stabilization.
Rent comps 18 comps
| Address | Beds | Baths | Sqft | Rent | $/sqft | DOM | Units | Dist |
|---|---|---|---|---|---|---|---|---|
| 9400 Elm Ct #645 Denver, CO | 3.0 | 2.0 | 1184 | $2,203 | $1.86 | 25d | 1 | 0.45mi |
| 1801 W 92nd Ave #754 Denver, CO | 3.0 | 2.0 | 1123 | $1,995 | $1.78 | 6d | 1 | 0.57mi |
| 3390 W 96th Ave Westminster, CO | 3.0 | 2.0 | 1665 | $2,895 | $1.74 | 6d | 1 | 0.62mi |
| 3323 W 96th Cir Westminster, CO | 1.0–3.0 | 1.0–3.0 | 1190 | $3,339 | $2.81 | 2d | 21 | 0.63mi |
| 10154 Wyandott Cir N Thornton, CO | 3.0 | 2.5 | 1464 | $2,465 | $1.68 | 17d | 1 | 0.66mi |
| 1921 W 101st Ave Unit 1921 Thornton, CO | 3.0 | 2.5 | 1335 | $2,800 | $2.10 | 15d | 1 | 0.70mi |
| 9783 Croke Dr Denver, CO | 3.0 | 1.5 | 1240 | $1,999 | $1.61 | 6d | 1 | 0.92mi |
| 3601 W 90th Ave Westminster, CO | 3.0 | 2.0 | 1770 | $2,850 | $1.61 | 25d | 1 | 1.15mi |
| 3601 W 90th Ave Unit 1 Westminster, CO | 3.0 | 2.5 | 1770 | $2,850 | $1.61 | 25d | 1 | 1.15mi |
| 9132 Osceola St Westminster, CO | 3.0 | 2.0 | 1204 | $2,350 | $1.95 | 25d | 1 | 1.19mi |
| 9130 Osceola St Westminster, CO | 3.0 | 2.0 | 1204 | $2,350 | $1.95 | 12d | 1 | 1.20mi |
| 9710 Huron St Unit B Northglenn, CO | 3.0 | 2.0 | 1292 | $2,080 | $1.61 | 18d | 1 | 1.21mi |
| 8670 Clay St Unit 6301 Westminster, CO | 3.0 | 2.0 | 1110 | $2,325 | $2.09 | 25d | 1 | 1.27mi |
| 8670 Clay St Unit 5201 Westminster, CO | 3.0 | 2.0 | 1110 | $2,550 | $2.30 | 25d | 1 | 1.27mi |
| 8670 Clay St Unit 4211 Westminster, CO | 3.0 | 2.0 | 1110 | $2,186 | $1.97 | 25d | 1 | 1.27mi |
| 8670 Clay St Unit 7219 Westminster, CO | 3.0 | 2.0 | 1110 | $2,373 | $2.14 | 25d | 1 | 1.27mi |
| 9189 Gale Blvd Thornton, CO | 1.0–3.0 | 1.0–2.0 | 755 | $1,699 | $2.25 | 25d | 1 | 1.29mi |
| 536 Niver Ave Northglenn, CO | 4.0 | 2.0 | 1752 | $2,979 | $1.70 | 25d | 1 | 1.42mi |
Listing history 7 events
-
2026-06-21days on market $199,900 Active 9 DOM
-
2026-06-18days on market $199,900 Active 6 DOM
-
2026-06-17days on market $199,900 Active 5 DOM
-
2026-06-16days on market $199,900 Active 4 DOM
-
2026-06-15days on market $199,900 Active 3 DOM
-
2026-06-13remarks 699-char remark
-
2026-06-13$199,900 Active 1 DOM
ⓘ Source: listings_history table (triggers on properties + properties_extension) + one-shot
backfill from property_details.listing_events for pre-trigger history.
Climate risk First Street
- Flood 1/10 Low FEMA zone X (unshaded) · 0% chance over 30 yrs
- Wildfire 1/10 Low
- Heat 3/10 Moderate 7 d/yr ≥92°F today · 18 d/yr by 30 yrs out
- Wind 2/10 Low
- Air quality 4/10 Moderate 6 unhealthy d/yr today · 8 by 30 yrs out
Nearby sold comps map
Loading sold comps map…
Walkable amenities ~0.75 mi
Loading nearby amenities…
Taxation est. · year 1
- Rental income
- $29,377
- − Mortgage interest
- −$11,198
- − Property taxes
- −$2,998
- − Insurance
- −$1,000
- − Repairs & maintenance
- −$2,350
- − Management
- −$2,350
- − Depreciation
- −$5,815
- Taxable income
- $3,666
- Est. tax owed @ 24.0%
- −$880
- After-tax cash flow
- $5,750/yr
For passive investors: Depreciation is non-cash, so a rental often shows a tax loss while cash-flowing — sheltering income. Rental losses are passive: they offset passive income freely, and up to $25,000/yr can offset ordinary (W-2) income if you actively participate and your MAGI is under $100k (phasing out to $0 by $150k); unused losses carry forward. On sale, claimed depreciation is recaptured at up to 25%, and gains may owe capital-gains tax (a 1031 exchange can defer both). Figures are a year-1 estimate at your 24.0% rate — not tax advice; consult a CPA.
Condition & rehab AI · 12 photos
This charming and affordable manufactured home is in good condition with a modern kitchen and a spacious layout. It offers a comfortable and functional living space with updated systems and newer construction. The home is located in a prime Metro Denver location, making it an attractive investment opportunity.
Value-add opportunities
- Both Landscaping improvements — Enhances curb appeal and adds value for both resale and rental.
- Both Painting exterior — Fresh paint can improve the home's appearance and add value.
- Both Landscaping and curb appeal — A well-maintained and landscaped exterior can significantly boost the home's value for both resale and rental.
Renovation cost estimate screening
Value-add ROI direction
- Both Landscaping improvements — Enhances curb appeal and adds value for both resale and rental. ↑
- Both Painting exterior — Fresh paint can improve the home's appearance and add value. ↑
- Both Landscaping and curb appeal — A well-maintained and landscaped exterior can significantly boost the home's value for both resale and rental. ↑
ⓘ Cost ranges are severity-bucket heuristics (US national rule-of-thumb). Get contractor quotes + a written scope before underwriting a rehab budget.
Schools (NCES district)
- District
- Adams 12 Five Star Schools
- NCES district ID
- 0806900
- Math proficiency
- 31% ▼ -4.00%
- Reading proficiency
- 46% ▬ 0.00%
- Median HH income
- $67,478
- Composite
- 34.87/100
- National rank
- #5086
- State rank
- #26 of 86 in CO
Livability — Federal Heights
- Score
- 76/100
- State rank
- #28
- US rank
- #3380
Category grades
Schools grade is shown separately in the Schools card above.
Census & demographics
- Census place
- Federal Heights, CO
- County
- Adams County · 464,133 people
- City population
- 34,677
- Metro
- Denver-Aurora-Lakewood, CO
- Population (ZIP)
- 34,677
- Household income
- $61,852
- Rent vs Own
- Severe rent burden
- 1521.0
Population outlook (Adams County) Hauer SSP2
- Today (2025)
- 598,184 people
- By 2030
- 651,880 · +9.0%
- By 2040
- 759,778 · +27.0%
- By 2050
- 862,889 · +44.3%
- By 2075
- 1,085,994 · +81.5%
- By 2100
- 1,211,318 · +102.5%
Race, ethnicity, and origin ACS 2023
- Neighborhood character
- Majority Hispanic (61%)
- Race & ethnicity
- Hispanic / Latino 61% White 30% Two or more races 26% Asian 3% Black 3%
- Hispanic origin (detail)
- Mexican 51%
- Common ancestry
- Romanian 1% Slovak 1% Italian 1%
- Foreign-born
- 25% · Canada, Vietnam, China
- Languages at home
- 53% English-only · Spanish 42% Other Asian/Pacific 2% Other Indo-European 1%
Political lean MEDSL · Adams
- 2024 margin
- Lean D (+9.0) · D 53.2% · R 44.1% · Other 2.7%
- 2008→2024 swing
- -9.3pp toward R · 2008: 18.4pp · 2024: 9.0pp
- All cycles
- 2024: D+9.0 2020: D+16.3 2016: D+7.2 2012: D+15.1 2008: D+18.4
Not yet ingested
- Civics
- —
Market trends
- HPI YoY
- ▼ -260.84%
- Current HPI
- 285.4552
- Rent YoY
- ▲ 0.77%
- Metro
- Denver-Aurora-Lakewood, CO
- State GDP YoY
- ▲ 1.95%
- F500 in state
- 14
Industry mix (Fortune 500 HQ in CO)
| Industry | F500 HQs | Revenue |
|---|---|---|
| Technology Distribution | 1 | $31B |
|
||
| Food / Agriculture | 1 | $18B |
|
||
| Packaging | 1 | $14B |
|
||
| Healthcare | 1 | $13B |
|
||
| Energy | 1 | $10B |
|
||
| Technology | 1 | $4B |
|
||
Price history
1 event — show timeline
- 2026-06-12 Listed $199,900 REColorado as Distributed by MLS Grid
Cash-flow waterfall
monthlySold comps — $/sqft
last 12 mo · ≤1 miLoading sold comps…