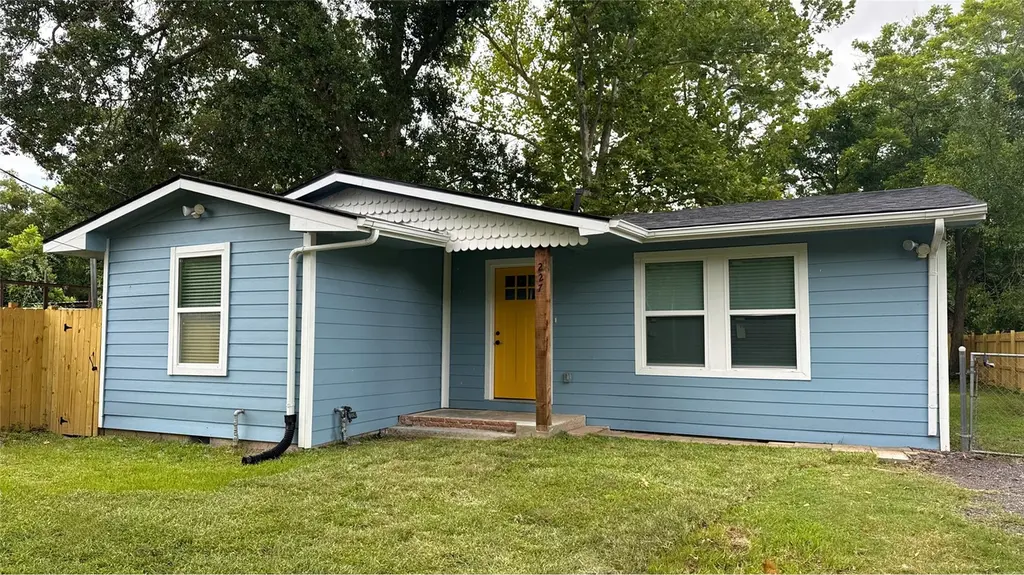
227 Kansas St · Bacliff, TX
Flood risk 7/10 · Major
- FEMA flood zone
- X (shaded)
- Chance of flooding over 30 yrs
- 0.75%
- Est. flood insurance / yr
- $507 – $1,088
Fire risk 1/10 · Minimal
- Est. fire insurance / yr
- $1,222 – $2,270
Heat risk 10/10 · Severe
- Hot days now (above 109°F)
- 7 days/yr
- Hot days in 30 yrs
- 26 days/yr
Wind risk 9/10 · Severe
- Chance of severe wind over 30 yrs
- 99.0%
Air-quality risk 2/10 · Minimal
- Unhealthy air days now
- 1 days/yr
- Unhealthy air days in 30 yrs
- 1 days/yr
Risk factors via First Street. Map © Google.
Why this score? — see what drove the D+ grade
The composite is a weighted blend of 9 inputs, each scored 0–100. Each bar is that input's sub-score; the figure is the points it added to the 100-point composite (weight × sub-score).
- Cash flow +23.5/30.0
- DSCR +7.5/10.0
- 1% rule +5.9/10.0
- Schools +3.5/10.0
- Livability +2.9/5.0
- Rent growth +2.5/5.0
- Condition / age +2.5/5.0
- ARV discount +0.4/15.0
- Appreciation +0.0/10.0
$169,900
🖨 Deal sheet 📄 Offer letter ✓ Due diligence
Listing remarks MLS
This house is in need of repairs.
Key facts
- Renovated plumbing
- Renovated electrical
- Updated home
Tags
Property features AI
Finance
- Other: Lease not considered
Exterior
- Parking: Asphalt road access
- Security: Smoke detector(s)
- Utilities: Public water; Public sewer
- Home design: Residential property; Faces northeast; Built in 1967; Entry on slab/block foundation
- Construction: Cement siding; Wood siding; Composition roof; Block and slab foundation
- Exterior features: Fenced yard (partial fencing, back yard); Private yard; Storage; Shed(s)
Interior
- Kitchen: Dishwasher; Disposal; Gas oven; Gas range; Microwave; Refrigerator
- Bedrooms: 2 possible bedrooms
- Flooring: Laminate; Tile
- Bathrooms: 2 full bathrooms
- Heating & cooling: Central heating (gas); Central air conditioning (electric); HVAC energy-efficient features; Programmable thermostat
- Interior features: Kitchen/family room combo; Pots & pan drawers; Tub with shower; Window treatments / coverings; Ceiling fan(s); Programmable thermostat
- Laundry & utility: Washer hookup; Gas dryer hookup; Washer; Dryer
Neighborhood map
What this means for you Summary
Snapshot
- This is a 2-bed/1.0-bath single-family listed at $170k.
Deal economics
- At list price, monthly cash flow is $250 ($3k/yr) — positive.
- The deal already cash-flows at list — no discount required.
- Meets the 1% rule at list price ($2k rent vs $170k).
- Recommended offer: $167k (1.5% below list) — sets the bar for market timing.
- Cap rate 8.5% vs local median 5.0% in Bacliff — top-decile yield for the area; either an underpriced asset or a hidden risk that comps aren't pricing in. Stress-test before assuming the spread holds.
Location & tenants
- Location reads 57/100 on livability (#1,252 in TX) — a working-class tenant base; expect higher turnover. Strengths: cost of living A+, housing A+; Watch: employment D+, crime D, amenities F.
- Dickinson ISD (suburban): math 39% / reading 40% proficiency, ranked #366 of 826 in TX (top 44%) — families likely to look elsewhere, expect single-tenant / working-renter base with shorter leases; 60% free/reduced lunch — lower-income household profile, screen leases tightly.
- Zoned schools: Kenneth E Little El (math 32% / reading 25%, grade F, #2,706 of 4,322 statewide, top 63%, 648 students, 88% FRL); Dunbar Middle (math 25% / reading 20%, grade F, #1,341 of 1,662 statewide, top 82%, 654 students, 78% FRL); Dickinson H S (math 30% / reading 46%, grade F, #880 of 1,632 statewide, top 54%, 3,619 students, 64% FRL) — zoned schools average 77% FRL vs 60% district-wide (16 pts higher); higher-poverty schools than district average — tighter screening recommended.
- Market conditions: 62 active listings in the ZIP; 2 comparable units currently listed for rent nearby; 3,258 units permitted in Galveston County in 2024 (0 in 5+ unit buildings).
- This rent runs 43% of the median local income ($51k/yr) — at the standard rent-burdened threshold; future hikes will face affordability resistance.
Forward outlook
- Local home prices are declining (-3.0%/yr); year-one equity from $1k of loan paydown is wiped out by about $5k of value loss. Plan a longer hold.
- Galveston County population projected at +43% by 2050 — long-run rental-demand tailwind backs the buy-and-hold thesis.
Negotiation context
- It's been on market 29 days — a 2% lower offer ($167k) is reasonable based on typical stale-listing flexibility.
- 6 sale attempts since 15y ago with the ask held roughly flat each time — persistent listings suggest the price (not the market) is what's stuck; bring a comps-based counter.
Risks & watch-outs
- Watch-outs: flood insurance adds $66/mo.
- Climate carrying-cost: major flood risk; severe wind risk, 99% chance of damaging wind over 30y; extreme-heat days projected 7→26/yr by 2055 (HVAC capex compounding) — expect insurance premiums to compound above CPI over the hold.
Questions for the listing agent
- Built in 1967 — when were the roof, HVAC, electrical panel, plumbing, and water heater last replaced?
- What's the actual annual flood-insurance premium (NFIP or private), and is the property in a SFHA with mandatory coverage?
- Is there a deadline driving the sale (1031 exchange, divorce, estate, relocation)? That informs how much negotiation room exists.
- Schools are F-rated, which usually means shorter tenancies and higher turnover. Who's the typical renter profile here, and what's been the actual vacancy rate?
- Crime grade is D in this area — have there been break-ins, vandalism, or insurance claims at this property in the last 3 years? What carrier currently insures it and at what premium?
- The area grade is low — what's the realistic commute time and amenity access for the typical tenant pool here? Any planned neighborhood developments (good or bad) we should know about?
- What's the average days-on-market for RENTAL listings here right now (not sales)? A rising rental-DOM trend means longer vacancies and softer asking-rent achievability than the comps imply.
- What's the recent tenant-quality profile in this submarket — average credit score on applications, eviction rate, late-payment / NSF rate, and stable-employment percentage? A property-management company in the area should have these aggregated.
- How much new for-sale + rental construction is in the pipeline within 1–3 miles? Heavy new supply typically softens prices + rents 12–24 months out; constrained supply supports both.
Investment metrics
- 1% rule
- 1.09% ✓
- Cap rate
- 8.53%
- Cash-on-cash
- 7.97%
- DSCR
- 1.35
- GRM
- 7.7
CMA / ARV
- ARV (on-the-fly)
- $146,692
- Comps found
- 7
Show comp detail 7 sales within ~0.75 mi
| Address | Dist | Beds/Ba | Sqft | Sold | Price | $/sf | Match |
|---|---|---|---|---|---|---|---|
| 303 Texas Ave | 0.06mi | 2/1.0 | 832 (-4%) | 6mo | $132,900 | $160 | 85 |
| 4111 Brown St | 0.16mi | 2/1.0 | 850 (-2%) | 10mo | $134,900 | $159 | 80 |
| 4102 Houx St | 0.09mi | 2/1.0 | 840 (-3%) | 24mo | $159,900 | $190 | 71 |
| 4222 Houx St | 0.19mi | 2/1.0 | 944 (+9%) | 17mo | $159,900 | $169 | 62 |
| 506 Oklahoma Ave | 0.13mi | 3/2.0 (+1) | 996 (+15%) | 3mo | $175,000 | $176 | 58 |
| 4730 Oleander St | 0.69mi | 3/1.0 (+1) | 915 (+5%) | 0mo | $135,000 | $148 | 54 |
| 4705 8th St | 0.57mi | 1/1.0 (-1) | 880 (+1%) | 22mo | $385,000 | $438 | 48 |
Match score weights: distance 35% · size 25% · config 20% · recency 20%. Top-matched comps best support the ARV.
Projected returns pro-forma
-3.0% appreciation · 3.0% rent growth · sell at horizon
- IRR
- -6.6%
- Equity multiple
- 0.76×
- Total profit
- $-11,581
- Equity at exit
- $25,333
- IRR
- 3.1%
- Equity multiple
- 1.22×
- Total profit
- $10,594
- Equity at exit
- $14,690
Cash invested: $47,572 (down + closing). Projections, not guarantees.
Landlord ↔ Tenant lean methodology
- Overall (STATE)
- 87 Strongly Landlord-Friendly
- State Texas
- 87 Strongly Landlord-Friendly · R+5
- County
- — inherits STATE
- City
- — inherits STATE
ZIP-level market 77518
- Home prices YoY
- -7.6%
- Active inventory
- 62
- Price-to-rent
- 7.7×
Monthly cashflow live
- Estimated rent
- $1,850 medium interval (Pro) →
- Mortgage (P&I)
- −$891
- Tax from tax record
- −$183 /mo · $2,200/yr
- Insurance
- −$71
- Flood insurance flood zone
- −$66 /mo · $798/yr
- HOA
- −$0
- Vacancy / Maint / Mgmt
- −$388
- Net cashflow
- $250
Break-even live
UW: 25.0% down · 7.5% · 30yr · 1.5% tax · 5.0% vac · 8.0% maint · 8.0% mgmt
Financing live
Cash to close
- Down payment
- $42,475
- Closing costs
- $5,097
- Reserves months
- —
- Total cash needed
- —
Loan-product check · same deal, 3 products live
Conventional
25% down · 7.5% · 30yr
- Down + closing
- —
- Monthly P&I
- —
- Monthly cashflow
- —
- DSCR
- —
- Eligible?
- —
Personal DTI + credit; lowest rate.
DSCR
20% down · 8.5% · 30yr
- Down + closing
- —
- Monthly P&I
- —
- Monthly cashflow
- —
- DSCR
- —
- Eligible?
- —
No personal income docs; deal must DSCR.
Hard money
10% down · 12.0% · 12mo
- Down + closing
- —
- Monthly P&I
- —
- Monthly cashflow
- —
- DSCR
- —
- Eligible?
- —
Short-term bridge; refi at stabilization.
Rent comps 2 comps
| Address | Beds | Baths | Sqft | Rent | $/sqft | DOM | Units | Dist |
|---|---|---|---|---|---|---|---|---|
| 320 Louisiana Ave Bacliff, TX | 2.0 | 1.0 | 786 | $2,150 | $2.74 | 1d | 1 | 0.15mi |
| 804 E AVE Unit 2 Bacliff, TX | 2.0 | 1.0 | 850 | $1,100 | $1.29 | 44d | 1 | 0.65mi |
Listing history 31 events
-
2026-06-18days on market $169,900 Active 29 DOM
-
2026-06-17days on market $169,900 Active 28 DOM
-
2026-06-16days on market $169,900 Active 27 DOM
-
2026-06-15days on market $169,900 Active 26 DOM
-
2026-06-13pricedays on market $169,900 Active 24 DOM
-
2026-06-09days on market $175,000 Active 20 DOM
-
2026-06-08days on market $175,000 Active 19 DOM
-
2026-06-07days on market $175,000 Active 18 DOM
-
2026-06-04days on market $175,000 Active 15 DOM
-
2026-06-03days on market $175,000 Active 14 DOM
-
2026-06-02days on market $175,000 Active 13 DOM
-
2026-06-01days on market $175,000 Active 12 DOM
-
2026-05-31days on market $175,000 Active 11 DOM
-
2026-05-20$175,000 Active
-
2024-01-24historical $1,500
-
2024-01-23historical
-
2023-12-18$169,000 Active
-
2023-11-27price $1,500
-
2023-10-07$1,550
-
2023-08-30historical $1,550
-
2023-08-29$1,550
-
2022-02-09soldstatus
-
2021-10-04soldstatus
-
2018-07-23soldstatus Sold 33-char remark
Show marketing remark (33 chars)
This house is in need of repairs.
-
2018-07-23soldstatus
Show marketing remark (33 chars)
This house is in need of repairs.
-
2018-07-17status Pending 33-char remark
Show marketing remark (33 chars)
This house is in need of repairs.
-
2018-06-21price $50,000 33-char remark
Show marketing remark (33 chars)
This house is in need of repairs.
-
2018-03-16$60,000 Active 33-char remark
Show marketing remark (33 chars)
This house is in need of repairs.
-
2011-04-20historical
-
2011-03-05$42,000
-
2004-07-14soldstatus
ⓘ Source: listings_history table (triggers on properties + properties_extension) + one-shot
backfill from property_details.listing_events for pre-trigger history.
Tax reassessment forecast TX · Resets to sale price
- Current annual tax
- $2,200 · $183/mo
- Projected year-2 tax
- $3,109 · $259/mo
- Expected delta
- +$909/yr (+$76/mo · 41.3%)
ⓘ Screening estimate from a state-policy table — verify with the county assessor before closing.
Climate risk First Street
- Flood 7/10 Severe FEMA zone X (shaded) · 75% chance over 30 yrs
- Wildfire 1/10 Low
- Heat 10/10 Extreme 7 d/yr ≥109°F today · 26 d/yr by 30 yrs out
- Wind 9/10 Extreme 99% chance of damaging wind over 30 yrs
- Air quality 2/10 Low 1 unhealthy d/yr today · 1 by 30 yrs out
Nearby sold comps map
Loading sold comps map…
Walkable amenities ~0.75 mi
Loading nearby amenities…
Taxation est. · year 1
- Rental income
- $22,195
- − Mortgage interest
- −$9,517
- − Property taxes
- −$2,200
- − Insurance
- −$1,647
- − Repairs & maintenance
- −$1,776
- − Management
- −$1,776
- − Depreciation
- −$4,943
- Taxable income
- $337
- Est. tax owed @ 24.0%
- −$81
- After-tax cash flow
- $2,915/yr
For passive investors: Depreciation is non-cash, so a rental often shows a tax loss while cash-flowing — sheltering income. Rental losses are passive: they offset passive income freely, and up to $25,000/yr can offset ordinary (W-2) income if you actively participate and your MAGI is under $100k (phasing out to $0 by $150k); unused losses carry forward. On sale, claimed depreciation is recaptured at up to 25%, and gains may owe capital-gains tax (a 1031 exchange can defer both). Figures are a year-1 estimate at your 24.0% rate — not tax advice; consult a CPA.
Schools (NCES district)
- District
- Dickinson ISD
- NCES district ID
- 4817070
- Math proficiency
- 39% ▼ -11.00%
- Reading proficiency
- 40% ▼ -2.00%
- Median HH income
- $61,318
- Composite
- 35.16/100
- National rank
- #5005
- State rank
- #366 of 826 in TX
Livability — Bacliff
- Score
- 57/100
- State rank
- #1252
- US rank
- #21864
Category grades
Schools grade is shown separately in the Schools card above.
Census & demographics
- Census place
- Bacliff, TX
- County
- Galveston County · 357,330 people
- City population
- 9,541
- Metro
- Houston-The Woodlands-Sugar Land, TX
- Population (ZIP)
- 9,541
- Household income
- $51,458
- Rent vs Own
- Severe rent burden
- 672.0
Population outlook (Galveston County) Hauer SSP2
- Today (2025)
- 390,640 people
- By 2030
- 425,226 · +8.9%
- By 2040
- 493,765 · +26.4%
- By 2050
- 559,698 · +43.3%
- By 2075
- 719,260 · +84.1%
- By 2100
- 819,628 · +109.8%
Race, ethnicity, and origin ACS 2023
- Neighborhood character
- Diverse neighborhood (Simpson 0.60)
- Race & ethnicity
- Hispanic / Latino 46% White 43% Two or more races 21% Black 7% Asian 2% Native American 1%
- Hispanic origin (detail)
- Mexican 31%
- Common ancestry
- Slovak 3% Lithuanian 2% Romanian 1%
- Foreign-born
- 15% · Canada, Vietnam, China
- Languages at home
- 66% English-only · Spanish 32% Vietnamese 1%
Political lean MEDSL · Galveston
- 2024 margin
- Strong R (+27.4) · D 35.7% · R 63.1% · Other 1.2%
- 2008→2024 swing
- -7.9pp toward R · 2008: -19.5pp · 2024: -27.4pp
- All cycles
- 2024: R+27.4 2020: R+22.6 2016: R+22.6 2012: R+26.9 2008: R+19.5
Not yet ingested
- Civics
- —
Market trends
- HPI YoY
- ▼ -24.15%
- Current HPI
- 293.2677
- Rent YoY
- —
- Metro
- Houston-The Woodlands-Sugar Land, TX
- State GDP YoY
- ▲ 3.95%
- F500 in state
- 110
Industry mix (Fortune 500 HQ in TX)
| Industry | F500 HQs | Revenue |
|---|---|---|
| Energy | 16 | $1,198B |
|
||
| Technology | 5 | $198B |
|
||
| Engineering / Construction | 4 | $72B |
|
||
| Energy Services | 3 | $60B |
|
||
| Utilities | 3 | $41B |
|
||
| Healthcare | 2 | $330B |
|
||
Price history
+316.7% since first listed18 events — show timeline
- 2026-05-20 Listed $175,000 HARMLS
- 2024-01-24 Rental Removed $1,500 HARMLS
- 2024-01-23 Listing Removed — HARMLS
- 2023-12-18 Listed $169,000 HARMLS
- 2023-11-27 Price Changed $1,500 HARMLS
- 2023-10-07 Listed for Rent $1,550 HARMLS
- 2023-08-30 Rental Removed $1,550 HARMLS
- 2023-08-29 Listed for Rent $1,550 HARMLS
- 2022-02-09 Sold (Public Records) — Public Records
- 2021-10-04 Sold (Public Records) — Public Records
- 2018-07-23 Sold (Public Records) — Public Records
- 2018-07-23 Sold (MLS) — HARMLS
- 2018-07-17 Pending — HARMLS
- 2018-06-21 Price Changed $50,000 HARMLS
- 2018-03-16 Listed $60,000 HARMLS
- 2011-04-20 Listing Removed — HARMLS
- 2011-03-05 Listed $42,000 HARMLS
- 2004-07-14 Sold (Public Records) — Public Records
Property tax history
+8.6%/yrLatest (2025): $2,200 · -4.0% YoY. Source: county tax records.
Cash-flow waterfall
monthlySold comps — $/sqft
last 12 mo · ≤1 miLoading sold comps…