Green Acres Ave #3315 · North Fort Myers, FL
Flood risk No data
- FEMA flood zone
- —
- Chance of flooding over 30 yrs
- —
- Est. flood insurance / yr
- —
Fire risk No data
- Est. fire insurance / yr
- —
Heat risk No data
- Hot days now (above threshold)
- —
- Hot days in 30 yrs
- —
Wind risk No data
- Chance of severe wind over 30 yrs
- —
Air-quality risk No data
- Unhealthy air days now
- —
- Unhealthy air days in 30 yrs
- —
Risk factors via First Street. Map © Google.
Why this score? — see what drove the D- grade
The composite is a weighted blend of 9 inputs, each scored 0–100. Each bar is that input's sub-score; the figure is the points it added to the 100-point composite (weight × sub-score).
- Cash flow +10.7/30.0
- Condition / age +4.8/5.0
- Schools +4.6/10.0
- Livability +3.7/5.0
- Rent growth +3.5/5.0
- 1% rule +3.2/10.0
- DSCR +3.1/10.0
- Appreciation +2.4/10.0
- ARV discount +0.9/15.0
$251,497
🖨 Deal sheet (PDF) 📄 Offer letter ✓ Due diligence
Listing remarks
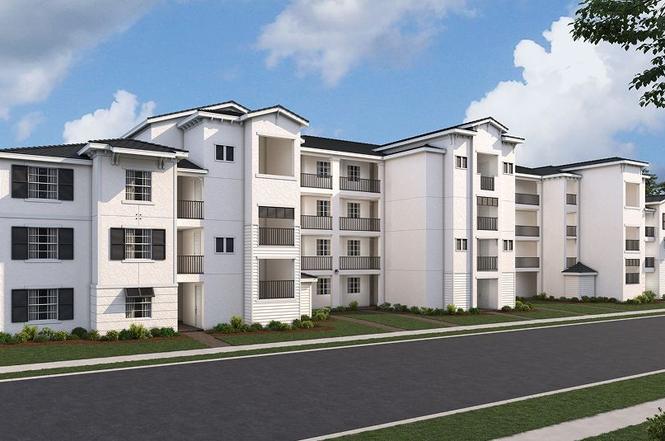
This home at Webbs Reserve comes with a bundled golf membership to the club - an exceptional value woven right into your purchase. From the moment you arrive, you're not just a resident; you're a member. This inviting 1,120-square-foot condo offers a smart split floorplan that balances privacy and open living. Step inside to discover a seamless flow between the kitchen, dining room and living room, where sliding doors open to a lanai perfect for outdoor gatherings. The luxurious owner's suite is conveniently located adjacent to the lanai, while a secondary bedroom near the foyer provides extra privacy for guests or family. Covered parking adds ease to your low-maintenance lifestyle. Set wit
Key facts
- Solar-powered town
- Covered parking
- Open layout
Tags
Property features AI
Finance
- Financial info: List price $251,497
Exterior
- Home design: Single-family spec home (Arbor plan); Status: Active
- Exterior features: Address: Green Acres Ave #3315, Punta Gorda, FL 33982
Interior
- Bedrooms: 2 bedrooms
- Bathrooms: 2 full bathrooms
- Interior features: Spec home, Plan name: Arbor; Living area approximately 1,120
Neighborhood map
What this means for you Summary
Snapshot
- This is a 2-bed/2.0-bath townhouse listed at $251k. Condition is rated excellent.
Deal economics
- At list price, monthly cash flow is $-119 ($-1k/yr) — negative.
- To cash-flow at today's rent, offer at most $234k (6.8% below list).
- To meet the 1% rule (rent ≥ 1% of price), the offer needs to be $205k (18.5% below list).
- Recommended offer: $205k (18.5% below list) — sets the bar for 1% rule.
- Cap rate 5.7% vs local median 3.6% in North Fort Myers — top-decile yield for the area; either an underpriced asset or a hidden risk that comps aren't pricing in. Stress-test before assuming the spread holds.
Location & tenants
- Location reads 74/100 on livability (#269 in FL, #4,409 nationally) — a middle-class / working-renter tenant base. Strengths: cost of living A+, housing A+, health & safety A+; Watch: employment C-, amenities F, commute F.
- Charlotte (suburban): math 54% / reading 54% proficiency, ranked #22 of 73 in FL (top 30%) — acceptable for families but not a draw, mixed tenant base, ~2y average lease.
- Zoned schools: East Elementary School (math 67% / reading 68%, grade B+, #435 of 2,144 statewide, top 21%, 761 students, 52% FRL); Punta Gorda Middle School (math 54% / reading 52%, grade C+, #209 of 571 statewide, top 37%, 1,120 students, 41% FRL); Charlotte High School (math 44% / reading 46%, grade D-, #228 of 667 statewide, top 35%, 1,994 students, 41% FRL).
- Market conditions: Rents rising fast (+4.1%/yr); 1044 active listings in the ZIP; 40 comparable units currently listed for rent nearby; rentals at typical pace (median 23d on market — plan ~3-4 weeks tenant-placement turnaround); 4,585 units permitted in Charlotte County in 2024 (703 in 5+ unit buildings).
- This rent runs 34% of the median local income ($72k/yr) — at the standard rent-burdened threshold; future hikes will face affordability resistance.
Forward outlook
- Local home prices are declining (-3.0%/yr); year-one equity from $2k of loan paydown is wiped out by about $8k of value loss. Plan a longer hold.
- Charlotte County population projected at +24% by 2050 — long-run rental-demand tailwind backs the buy-and-hold thesis.
Negotiation context
- It's been on market 123 days — a 12% lower offer ($221k) is reasonable based on typical stale-listing flexibility.
Questions for the listing agent
- What do current leases actually rent for vs. the listed asking? Can we see a recent rent roll and the last 12 months of T-12 income?
- It's been on market 123 days. Have you received any prior offers? Is the seller open to a 18% concession, seller financing, or rate buy-down credit?
- Why hasn't it sold? Are there any deal-killer items the seller is aware of (foundation, flood, title, zoning, code violations)?
- Is there a deadline driving the sale (1031 exchange, divorce, estate, relocation)? That informs how much negotiation room exists.
- The area grade is low — what's the realistic commute time and amenity access for the typical tenant pool here? Any planned neighborhood developments (good or bad) we should know about?
- What's the average days-on-market for RENTAL listings here right now (not sales)? A rising rental-DOM trend means longer vacancies and softer asking-rent achievability than the comps imply.
- What's the recent tenant-quality profile in this submarket — average credit score on applications, eviction rate, late-payment / NSF rate, and stable-employment percentage? A property-management company in the area should have these aggregated.
- How much new for-sale + rental construction is in the pipeline within 1–3 miles? Heavy new supply typically softens prices + rents 12–24 months out; constrained supply supports both.
Investment metrics
- 1% rule
- 0.82% ✗
- Cap rate
- 5.73%
- Cash-on-cash
- -2.02%
- DSCR
- 0.91
- GRM
- 10.2
CMA / ARV
- ARV (on-the-fly)
- $219,520
- Comps found
- 2
Show comp detail 2 sales within ~0.75 mi
| Address | Dist | Beds/Ba | Sqft | Sold | Price | $/sf | Match |
|---|---|---|---|---|---|---|---|
| 15405 Green Acres Ave #2343 | 0.35mi | 2/2.0 | 1,120 (0%) | 3mo | $219,000 | $196 | 81 |
| 15285 Green Acres Ave #412 | 0.28mi | 2/2.0 | 1,154 (+3%) | 10mo | $220,000 | $191 | 74 |
Match score weights: distance 35% · size 25% · config 20% · recency 20%. Top-matched comps best support the ARV.
Projected returns pro-forma
-3.0% appreciation · 4.13% rent growth · sell at horizon
- IRR
- -18.4%
- Equity multiple
- 0.35×
- Total profit
- $-45,930
- Equity at exit
- $37,499
- IRR
- -8.6%
- Equity multiple
- 0.44×
- Total profit
- $-39,715
- Equity at exit
- $21,745
Cash invested: $70,419 (down + closing). Projections, not guarantees.
Landlord ↔ Tenant lean methodology
- Overall (STATE)
- 87 Strongly Landlord-Friendly
- State Florida
- 87 Strongly Landlord-Friendly · R+3
- County
- — inherits STATE
- City
- — inherits STATE
ZIP-level market 33982
- Home prices YoY
- -1.2%
- Rents YoY
- 4.1%
- Active inventory
- 1044
- Price-to-rent
- 10.2×
Monthly cashflow live
- Estimated rent
- $2,050 medium interval (Pro) →
- Mortgage (P&I)
- −$1,319
- Tax est. 1.5%
- −$314 /mo · $3,772/yr
- Insurance
- −$105
- HOA
- −$0
- Vacancy / Maint / Mgmt
- −$430
- Net cashflow
- $-119
Break-even live
Sensitivity live
| Price | -10% $55 | -5% $-32 | +0% $-119 | +5% $-206 | +10% $-293 |
|---|---|---|---|---|---|
| Rent | -10% $-281 | -5% $-200 | +0% $-119 | +5% $-38 | +10% $43 |
| Rate | -1.0pp $8 | -0.5pp $-55 | base $-119 | +0.5pp $-184 | +1.0pp $-250 |
UW: 25.0% down · 7.5% · 30yr · 1.5% tax · 5.0% vac · 8.0% maint · 8.0% mgmt
Financing live
Cash to close
- Down payment
- $62,874
- Closing costs
- $7,545
- Reserves months
- —
- Total cash needed
- —
Loan-product check · same deal, 3 products live
Conventional
25% down · 7.5% · 30yr
- Down + closing
- —
- Monthly P&I
- —
- Monthly cashflow
- —
- DSCR
- —
- Eligible?
- —
Personal DTI + credit; lowest rate.
DSCR
20% down · 8.5% · 30yr
- Down + closing
- —
- Monthly P&I
- —
- Monthly cashflow
- —
- DSCR
- —
- Eligible?
- —
No personal income docs; deal must DSCR.
Hard money
10% down · 12.0% · 12mo
- Down + closing
- —
- Monthly P&I
- —
- Monthly cashflow
- —
- DSCR
- —
- Eligible?
- —
Short-term bridge; refi at stabilization.
Rent comps 40 comps
| Address | Beds | Baths | Sqft | Rent | $/sqft | DOM | Units | Dist |
|---|---|---|---|---|---|---|---|---|
| 15275 Green Acres Ave #324 Punta Gorda, FL | 2.0 | 2.0 | 1120 | $1,600 | $1.43 | 23d | 1 | 0.14mi |
| 15275 Green Acres Ave #338 Punta Gorda, FL | 3.0 | 2.0 | 1301 | $4,795 | $3.69 | 23d | 1 | 0.14mi |
| 15275 Green Acres Ave #335 Punta Gorda, FL | 2.0 | 2.0 | 1120 | $4,000 | $3.57 | 23d | 1 | 0.14mi |
| 15275 Green Acres Ave #344 Punta Gorda, FL | 2.0 | 2.0 | 1120 | $5,500 | $4.91 | 23d | 1 | 0.14mi |
| 15275 Green Acres Ave #323 Punta Gorda, FL | 2.0 | 2.0 | 1154 | $5,000 | $4.33 | 23d | 1 | 0.14mi |
| 15275 Green Acres Ave #337 Punta Gorda, FL | 2.0 | 2.0 | 1154 | $1,900 | $1.65 | 23d | 1 | 0.14mi |
| 15285 Green Acres Ave Unit 425 Punta Gorda, FL | 2.0 | 2.0 | 1120 | $4,950 | $4.42 | 23d | 1 | 0.20mi |
| 15285 Green Acres Ave Unit 425 Punta Gorda, FL | 2.0 | 2.0 | 1120 | $4,950 | $4.42 | 15d | 1 | 0.20mi |
| 15285 Green Acres AVE #415 Punta Gorda, FL | 2.0 | 2.0 | 1120 | $1,800 | $1.61 | 23d | 1 | 0.20mi |
| 15345 Green Acres Ave Unit 2117 Punta Gorda, FL | 2.0 | 2.0 | 1154 | $6,000 | $5.20 | 23d | 1 | 0.23mi |
| 15375 Green Acres Ave #2211 Punta Gorda, FL | 3.0 | 2.0 | 1301 | $2,295 | $1.76 | 23d | 1 | 0.23mi |
| 15345 Green Acres Ave #2116 Punta Gorda, FL | 2.0 | 2.0 | 1154 | $1,900 | $1.65 | 23d | 1 | 0.24mi |
| 15345 Green Acres Ave #2111 Punta Gorda, FL | 3.0 | 2.0 | 1301 | $4,795 | $3.69 | 23d | 1 | 0.24mi |
| 15285 Green Acres AVE #414 Punta Gorda, FL | 2.0 | 2.0 | 1120 | $6,000 | $5.36 | 23d | 1 | 0.30mi |
| 15195 Pinehurst Ln Unit 925 Punta Gorda, FL | 2.0 | 2.0 | 1366 | $6,000 | $4.39 | 23d | 1 | 0.33mi |
| 15195 Pinehurst Ln Unit 917 Punta Gorda, FL | 2.0 | 2.0 | 1355 | $5,500 | $4.06 | 23d | 1 | 0.33mi |
| 14923 Anchorage Rd Punta Gorda, FL | 3.0 | 2.0 | 1417 | $2,200 | $1.55 | 23d | 1 | 0.34mi |
| 15405 Green Acres Ave Unit 2322 Punta Gorda, FL | 2.0 | 2.0 | 1150 | $4,000 | $3.48 | 23d | 1 | 0.37mi |
| 15375 Green Acres Ave #2243 , FL | 2.0 | 2.0 | 1120 | $4,500 | $4.02 | 15d | 1 | 0.37mi |
| 15405 Green Acres Ave #2327 , FL | 2.0 | 2.0 | 1154 | $4,500 | $3.90 | 15d | 1 | 0.37mi |
| 15405 Green Acres Ave #2341 Punta Gorda, FL | 2.0 | 2.0 | 1154 | $5,500 | $4.77 | 23d | 1 | 0.37mi |
| 15405 Green Acres Ave #2331 Punta Gorda, FL | 3.0 | 2.0 | 1301 | $5,500 | $4.23 | 23d | 1 | 0.37mi |
| 15175 Bluffton Ln Unit 724 Punta Gorda, FL | 2.0 | 2.0 | 1366 | $3,000 | $2.20 | 23d | 1 | 0.40mi |
| 15175 Pinehurst Ln Unit 724 Punta Gorda, FL | 2.0 | 2.0 | 1366 | $5,000 | $3.66 | 23d | 1 | 0.41mi |
| 15960 Grassland Ln #2714 Punta Gorda, FL | 2.0 | 2.0 | 1366 | $2,800 | $2.05 | 23d | 1 | 1.09mi |
| 15960 Grassland Ln #2727 Punta Gorda, FL | 2.0 | 2.0 | 1422 | $6,000 | $4.22 | 23d | 1 | 1.09mi |
| 15930 Grassland Ln #2412 Punta Gorda, FL | 2.0 | 2.0 | 1355 | $6,600 | $4.87 | 23d | 1 | 1.11mi |
| 16000 Grassland Ln #3127 Punta Gorda, FL | 2.0 | 2.0 | 1355 | $6,000 | $4.43 | 23d | 1 | 1.15mi |
| 43985 Boardwalk Loop #2141 Punta Gorda, FL | 2.0 | 2.0 | 1198 | $6,000 | $5.01 | 23d | 1 | 1.26mi |
| 43985 Boardwalk Loop #2138 Punta Gorda, FL | 3.0 | 2.0 | 1301 | $1,975 | $1.52 | 23d | 1 | 1.26mi |
| 43977 Boardwalk Loop #2315 Punta Gorda, FL | 2.0 | 2.0 | 1120 | $4,500 | $4.02 | 23d | 1 | 1.29mi |
| 43989 Boardwalk Loop #2032 Punta Gorda, FL | 2.0 | 2.0 | 1154 | $6,000 | $5.20 | 23d | 1 | 1.31mi |
| 43989 Boardwalk Loop #2028 Punta Gorda, FL | 3.0 | 2.0 | 1301 | $5,500 | $4.23 | 23d | 1 | 1.31mi |
| 43989 Boardwalk Loop #2024 Punta Gorda, FL | 2.0 | 2.0 | 1120 | $5,400 | $4.82 | 23d | 1 | 1.31mi |
| 43989 Boardwalk Loop #2042 Punta Gorda, FL | 2.0 | 2.0 | 1120 | $5,000 | $4.46 | 23d | 1 | 1.31mi |
| 43989 Boardwalk Loop #2041 Punta Gorda, FL | 2.0 | 2.0 | 1154 | $1,850 | $1.60 | 23d | 1 | 1.31mi |
| 43984 Boardwalk Loop #1717 Punta Gorda, FL | 2.0 | 2.0 | 1355 | $7,500 | $5.54 | 23d | 1 | 1.32mi |
| 43031 Greenway Blvd #1014 Punta Gorda, FL | 2.0 | 2.0 | 1366 | $6,000 | $4.39 | 23d | 1 | 1.33mi |
| 43021 Greenway Blvd #1115 Punta Gorda, FL | 2.0 | 2.0 | 1355 | $2,600 | $1.92 | 23d | 1 | 1.33mi |
| 43011 Greenway Blvd #1225 Punta Gorda, FL | 2.0 | 2.0 | 1355 | $6,000 | $4.43 | 23d | 1 | 1.34mi |
Listing history 16 events
-
2026-06-22days on market $251,497 Active 123 DOM
-
2026-06-18days on market $251,497 Active 120 DOM
-
2026-06-18remarks 699-char remark
-
2026-06-17days on market $251,497 Active 119 DOM
-
2026-06-16days on market $251,497 Active 118 DOM
-
2026-06-15days on market $251,497 Active 117 DOM
-
2026-06-14days on market $251,497 Active 115 DOM
-
2026-06-13days on market $251,497 Active 114 DOM
-
2026-06-10days on market $251,497 Active 112 DOM
-
2026-06-09days on market $251,497 Active 111 DOM
-
2026-06-08days on market $251,497 Active 110 DOM
-
2026-06-05days on market $251,497 Active 106 DOM
-
2026-06-02days on market $251,497 Active 104 DOM
-
2026-06-01days on market $251,497 Active 103 DOM
-
2026-05-31days on market $251,497 Active 102 DOM
-
2026-05-30days on market $251,497 Active 101 DOM
ⓘ Source: listings_history table (triggers on properties + properties_extension) + one-shot
backfill from property_details.listing_events for pre-trigger history.
Nearby sold comps map
Loading sold comps map…
Walkable amenities ~0.75 mi
Loading nearby amenities…
Taxation est. · year 1
- Rental income
- $24,597
- − Mortgage interest
- −$14,088
- − Property taxes
- −$3,772
- − Insurance
- −$1,257
- − Repairs & maintenance
- −$1,968
- − Management
- −$1,968
- − Depreciation
- −$7,316
- Taxable loss
- −$5,773
- Est. tax savings @ 24.0%
- +$1,385
- After-tax cash flow
- $-40/yr
For passive investors: Depreciation is non-cash, so a rental often shows a tax loss while cash-flowing — sheltering income. Rental losses are passive: they offset passive income freely, and up to $25,000/yr can offset ordinary (W-2) income if you actively participate and your MAGI is under $100k (phasing out to $0 by $150k); unused losses carry forward. On sale, claimed depreciation is recaptured at up to 25%, and gains may owe capital-gains tax (a 1031 exchange can defer both). Figures are a year-1 estimate at your 24.0% rate — not tax advice; consult a CPA.
Condition & rehab AI · 13 photos
This move-in-ready townhouse in Webbs Reserve offers a modern and well-maintained living space with excellent curb appeal and a golf membership bundled into the purchase.
Value-add opportunities
- Both Landscaping and curb appeal improvements — Enhances curb appeal and could attract more buyers
- Both Add smart home features — Improves convenience and could increase rental value
Renovation cost estimate screening
Value-add ROI direction
- Both Landscaping and curb appeal improvements — Enhances curb appeal and could attract more buyers ↑
- Both Add smart home features — Improves convenience and could increase rental value ↑
ⓘ Cost ranges are severity-bucket heuristics (US national rule-of-thumb). Get contractor quotes + a written scope before underwriting a rehab budget.
Schools (NCES district)
- District
- Charlotte
- NCES district ID
- 1200240
- Math proficiency
- 54% ▼ -6.00%
- Reading proficiency
- 54% ▼ -1.00%
- Median HH income
- $44,864
- Composite
- 45.62/100
- National rank
- #2586
- State rank
- #22 of 73 in FL
Livability — North Fort Myers
- Score
- 74/100
- State rank
- #269
- US rank
- #4409
Category grades
Schools grade is shown separately in the Schools card above.
Census & demographics
- County
- Charlotte County · 196,994 people
- City population
- 57,035
- Metro
- Punta Gorda, FL
- Population (ZIP)
- 13,006
- Household income
- $72,443
- Rent vs Own
- Severe rent burden
- 43.0
Population outlook (Charlotte County) Hauer SSP2
- Today (2025)
- 198,646 people
- By 2030
- 210,507 · +6.0%
- By 2040
- 230,857 · +16.2%
- By 2050
- 247,148 · +24.4%
- By 2075
- 281,777 · +41.8%
- By 2100
- 293,609 · +47.8%
Race, ethnicity, and origin ACS 2023
- Neighborhood character
- Predominantly White (81%)
- Race & ethnicity
- White 81% Two or more races 8% Hispanic / Latino 7% Black 7%
- Hispanic origin (detail)
- Puerto Rican 2% Cuban 3%
- Common ancestry
- Lithuanian 3% Iranian 3% Slovak 3%
- Foreign-born
- 6% · Canada, Jamaica
- Languages at home
- 93% English-only · Spanish 5% German/W. Germanic 1% Arabic 1%
Political lean MEDSL · Charlotte
- 2024 margin
- Solid R (+34.0) · D 32.7% · R 66.7%
- 2008→2024 swing
- -26.7pp toward R · 2008: -7.2pp · 2024: -34.0pp
- All cycles
- 2024: R+34.0 2020: R+26.6 2016: R+27.8 2012: R+14.3 2008: R+7.2
Not yet ingested
- Civics
- —
Market trends
- HPI YoY
- ▼ -5.25%
- Current HPI
- 448.5895
- Rent YoY
- ▲ 4.13%
- Metro
- Punta Gorda, FL
- State GDP YoY
- ▲ 3.28%
- F500 in state
- 36
Industry mix (Fortune 500 HQ in FL)
| Industry | F500 HQs | Revenue |
|---|---|---|
| Industrial Technology | 2 | $29B |
|
||
| Insurance | 2 | $17B |
|
||
| Retail | 1 | $60B |
|
||
| Technology Distribution | 1 | $58B |
|
||
| Homebuilding | 1 | $35B |
|
||
| Technology Manufacturing | 1 | $35B |
|
||
Cash-flow waterfall
monthlySold comps — $/sqft
last 12 mo · ≤1 miLoading sold comps…