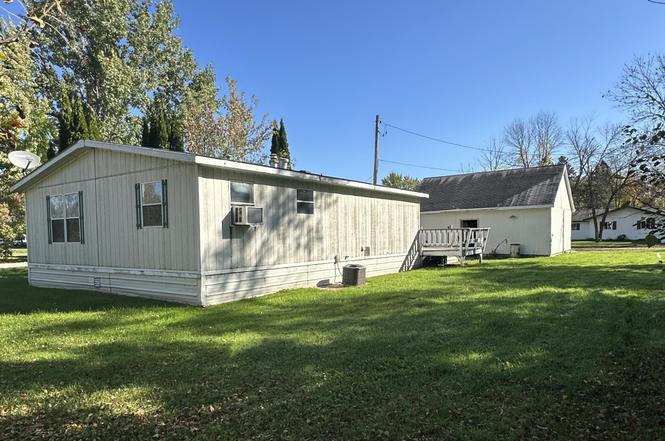
603 2nd St SE · Baudette, MN
Flood risk 1/10 · Minimal
- FEMA flood zone
- X (unshaded)
- Chance of flooding over 30 yrs
- 0.0%
- Est. flood insurance / yr
- $473 – $860
Fire risk 3/10 · Minor
- Est. fire insurance / yr
- $888 – $1,650
Heat risk 1/10 · Minimal
- Hot days now (above 93°F)
- 7 days/yr
- Hot days in 30 yrs
- 12 days/yr
Wind risk 1/10 · Minimal
- Chance of severe wind over 30 yrs
- —
Air-quality risk 2/10 · Minimal
- Unhealthy air days now
- 2 days/yr
- Unhealthy air days in 30 yrs
- 2 days/yr
Risk factors via First Street. Map © Google.
Why this score? — see what drove the C- grade
The composite is a weighted blend of 9 inputs, each scored 0–100. Each bar is that input's sub-score; the figure is the points it added to the 100-point composite (weight × sub-score).
- Cash flow +22.6/30.0
- ARV discount +7.5/15.0
- DSCR +7.2/10.0
- 1% rule +5.4/10.0
- Livability +3.7/5.0
- Schools +3.0/10.0
- Rent growth +2.5/5.0
- Condition / age +2.5/5.0
- Appreciation +0.0/10.0
$89,500
🖨 Deal sheet (PDF) 📄 Offer letter ✓ Due diligence
Listing remarks
Affordable 2 bedroom 1 bath home resting on a 100'x140' corner lot in East Baudette. Property also offers 2 stall detached garage and large yard.
Key facts
- 0.32 acre lot
- 2 garage spots
- Built 1994
Neighborhood map
What this means for you Summary
Snapshot
- This is a 2-bed/1.0-bath single-family listed at $90k.
Deal economics
- At list price, monthly cash flow is $152 ($2k/yr) — positive.
- The deal already cash-flows at list — no discount required.
- Meets the 1% rule at list price ($934 rent vs $90k).
- Recommended offer: $79k (12.0% below list) — sets the bar for market timing.
Location & tenants
- Location reads 73/100 on livability (#243 in MN) — a middle-class / working-renter tenant base. Strengths: cost of living A+, health & safety A+, housing A; Watch: crime D+, amenities F, commute F.
- Lake Of The Woods School District (rural): math 30% / reading 39% proficiency, ranked #259 of 301 in MN (top 86%) — families likely to look elsewhere, expect single-tenant / working-renter base with shorter leases.
- Zoned schools: Lake of The Woods Elementary (math 37% / reading 42%, grade F, #604 of 857 statewide, top 74%, 255 students, 45% FRL); Lake of The Woods Secondary (math 22% / reading 32%, grade F, #369 of 471 statewide, top 79%, 191 students, 40% FRL).
- Market conditions: 99 active listings in the ZIP; 13 units permitted in Lake of the Woods County in 2024 (0 in 5+ unit buildings).
Forward outlook
- Local home prices are declining (-3.0%/yr); year-one equity from $619 of loan paydown is wiped out by about $3k of value loss. Plan a longer hold.
- Lake of the Woods County population projected at -20% by 2050 — secular population decline; favor cash flow + early exit over multi-decade hold.
Negotiation context
- It's been on market 143 days — a 12% lower offer ($79k) is reasonable based on typical stale-listing flexibility.
- 3 sale attempts since 15y ago; this cycle's ask has dropped $10k (10%) from the opening price — seller is motivated, your offer sets the floor, not the list.
- Current owner paid $56k; list at $90k implies a 61% gain — meaningful room to come down on a strong offer.
Questions for the listing agent
- It's been on market 143 days. Have you received any prior offers? Is the seller open to a 12% concession, seller financing, or rate buy-down credit?
- Why hasn't it sold? Are there any deal-killer items the seller is aware of (foundation, flood, title, zoning, code violations)?
- Is there a deadline driving the sale (1031 exchange, divorce, estate, relocation)? That informs how much negotiation room exists.
- Crime grade is D in this area — have there been break-ins, vandalism, or insurance claims at this property in the last 3 years? What carrier currently insures it and at what premium?
- What's the average days-on-market for RENTAL listings here right now (not sales)? A rising rental-DOM trend means longer vacancies and softer asking-rent achievability than the comps imply.
- What's the recent tenant-quality profile in this submarket — average credit score on applications, eviction rate, late-payment / NSF rate, and stable-employment percentage? A property-management company in the area should have these aggregated.
- How much new for-sale + rental construction is in the pipeline within 1–3 miles? Heavy new supply typically softens prices + rents 12–24 months out; constrained supply supports both.
Investment metrics
- 1% rule
- 1.04% ✓
- Cap rate
- 8.33%
- Cash-on-cash
- 7.29%
- DSCR
- 1.32
- GRM
- 8.0
CMA / ARV
No comps found within radius.
Projected returns pro-forma
-3.0% appreciation · 3.0% rent growth · sell at horizon
- IRR
- -5.1%
- Equity multiple
- 0.81×
- Total profit
- $-4,810
- Equity at exit
- $13,345
- IRR
- 4.5%
- Equity multiple
- 1.33×
- Total profit
- $8,276
- Equity at exit
- $7,738
Cash invested: $25,060 (down + closing). Projections, not guarantees.
Landlord ↔ Tenant lean methodology
- Overall (STATE)
- 46 Balanced
- State Minnesota
- 46 Balanced · D+2
- County
- — inherits STATE
- City
- — inherits STATE
ZIP-level market 56623
- Home prices YoY
- -15.0%
- Active inventory
- 99
- Price-to-rent
- 8.0×
Monthly cashflow live
- Estimated rent
- $934 medium interval (Pro) →
- Mortgage (P&I)
- −$469
- Tax from tax record
- −$79 /mo · $948/yr
- Insurance
- −$37
- HOA
- −$0
- Vacancy / Maint / Mgmt
- −$196
- Net cashflow
- $152
Break-even live
Sensitivity live
| Price | -10% $203 | -5% $178 | +0% $152 | +5% $127 | +10% $102 |
|---|---|---|---|---|---|
| Rent | -10% $78 | -5% $115 | +0% $152 | +5% $189 | +10% $226 |
| Rate | -1.0pp $197 | -0.5pp $175 | base $152 | +0.5pp $129 | +1.0pp $105 |
UW: 25.0% down · 7.5% · 30yr · 1.5% tax · 5.0% vac · 8.0% maint · 8.0% mgmt
Financing live
Cash to close
- Down payment
- $22,375
- Closing costs
- $2,685
- Reserves months
- —
- Total cash needed
- —
Loan-product check · same deal, 3 products live
Conventional
25% down · 7.5% · 30yr
- Down + closing
- —
- Monthly P&I
- —
- Monthly cashflow
- —
- DSCR
- —
- Eligible?
- —
Personal DTI + credit; lowest rate.
DSCR
20% down · 8.5% · 30yr
- Down + closing
- —
- Monthly P&I
- —
- Monthly cashflow
- —
- DSCR
- —
- Eligible?
- —
No personal income docs; deal must DSCR.
Hard money
10% down · 12.0% · 12mo
- Down + closing
- —
- Monthly P&I
- —
- Monthly cashflow
- —
- DSCR
- —
- Eligible?
- —
Short-term bridge; refi at stabilization.
Listing history 7 events
-
2026-02-16status Pending
-
2025-11-12price $89,500
-
2025-09-26$99,500 Active
-
2015-09-29soldstatus $55,624
-
2011-08-28historical
-
2011-02-27$59,900
-
2011-02-27$59,900
ⓘ Source: listings_history table (triggers on properties + properties_extension) + one-shot
backfill from property_details.listing_events for pre-trigger history.
Tax reassessment forecast MN · Partial reset (capped growth)
- Current annual tax
- $948 · $79/mo
- Projected year-2 tax
- $975 · $81/mo
- Expected delta
- +$27/yr (+$2/mo · 2.9%)
ⓘ Screening estimate from a state-policy table — verify with the county assessor before closing.
Climate risk First Street
- Flood 1/10 Low FEMA zone X (unshaded) · 0% chance over 30 yrs
- Wildfire 3/10 Moderate
- Heat 1/10 Low 7 d/yr ≥93°F today · 12 d/yr by 30 yrs out
- Wind 1/10 Low
- Air quality 2/10 Low 2 unhealthy d/yr today · 2 by 30 yrs out
Nearby sold comps map
Loading sold comps map…
Walkable amenities ~0.75 mi
Loading nearby amenities…
Taxation est. · year 1
- Rental income
- $11,209
- − Mortgage interest
- −$5,013
- − Property taxes
- −$948
- − Insurance
- −$448
- − Repairs & maintenance
- −$897
- − Management
- −$897
- − Depreciation
- −$2,604
- Taxable income
- $403
- Est. tax owed @ 24.0%
- −$97
- After-tax cash flow
- $1,731/yr
For passive investors: Depreciation is non-cash, so a rental often shows a tax loss while cash-flowing — sheltering income. Rental losses are passive: they offset passive income freely, and up to $25,000/yr can offset ordinary (W-2) income if you actively participate and your MAGI is under $100k (phasing out to $0 by $150k); unused losses carry forward. On sale, claimed depreciation is recaptured at up to 25%, and gains may owe capital-gains tax (a 1031 exchange can defer both). Figures are a year-1 estimate at your 24.0% rate — not tax advice; consult a CPA.
Schools (NCES district)
- District
- Lake Of The Woods School District
- NCES district ID
- 2717570
- Math proficiency
- 30% ▼ -9.00%
- Reading proficiency
- 39% ▼ -9.00%
- Median HH income
- $45,937
- Composite
- 29.52/100
- National rank
- #6498
- State rank
- #259 of 301 in MN
Livability — Baudette
- Score
- 73/100
- State rank
- #243
- US rank
- #5219
Category grades
Schools grade is shown separately in the Schools card above.
Census & demographics
- Census place
- Baudette, MN
- Population (ZIP)
- 2,684
Population outlook (Lake of the Woods County) Hauer SSP2
- Today (2025)
- 3,706 people
- By 2030
- 3,565 · -3.8%
- By 2040
- 3,224 · -13.0%
- By 2050
- 2,957 · -20.2%
- By 2075
- 2,685 · -27.5%
- By 2100
- 2,544 · -31.4%
Race, ethnicity, and origin ACS 2023
- Neighborhood character
- Predominantly White (91%)
- Race & ethnicity
- White 91% Two or more races 7%
- Common ancestry
- Portuguese 22% Scottish 6% Romanian 3%
- Foreign-born
- 2% · Canada
- Languages at home
- 99% English-only · Spanish 1%
Political lean MEDSL · Lake of the Woods
- 2024 margin
- Solid R (+47.1) · D 25.8% · R 72.9% · Other 1.4%
- 2008→2024 swing
- -33.9pp toward R · 2008: -13.3pp · 2024: -47.1pp
- All cycles
- 2024: R+47.1 2020: R+42.9 2016: R+44.3 2012: R+20.1 2008: R+13.3
Not yet ingested
- Civics
- —
Market trends
- HPI YoY
- ▼ -32.47%
- Current HPI
- 184.2846
- Rent YoY
- —
- Metro
- —
- State GDP YoY
- ▲ 2.41%
- F500 in state
- 34
Industry mix (Fortune 500 HQ in MN)
| Industry | F500 HQs | Revenue |
|---|---|---|
| Healthcare | 2 | $407B |
|
||
| Retail | 2 | $150B |
|
||
| Consumer Goods | 2 | $32B |
|
||
| Industrial Machinery | 2 | $6B |
|
||
| Agriculture | 1 | $40B |
|
||
| Healthcare / Medical Devices | 1 | $32B |
|
||
Price history
+49.4% since first listed7 events — show timeline
- 2026-02-16 Pending — NORTHSTARMLS as Distributed by MLS Grid
- 2025-11-12 Price Changed $89,500 NORTHSTARMLS as Distributed by MLS Grid
- 2025-09-26 Listed $99,500 NORTHSTARMLS as Distributed by MLS Grid
- 2015-09-29 Sold (Public Records) $55,624 Public Records
- 2011-08-28 Listing Removed — NORTHSTARMLS as Distributed by MLS Grid
- 2011-02-27 Listed $59,900 NORTHSTARMLS as Distributed by MLS Grid
- 2011-02-27 Listed $59,900 NORTHSTARMLS as Distributed by MLS Grid
Property tax history
+6.2%/yrLatest (2025): $948 · +3.9% YoY. Source: county tax records.
Cash-flow waterfall
monthlySold comps — $/sqft
last 12 mo · ≤1 miLoading sold comps…