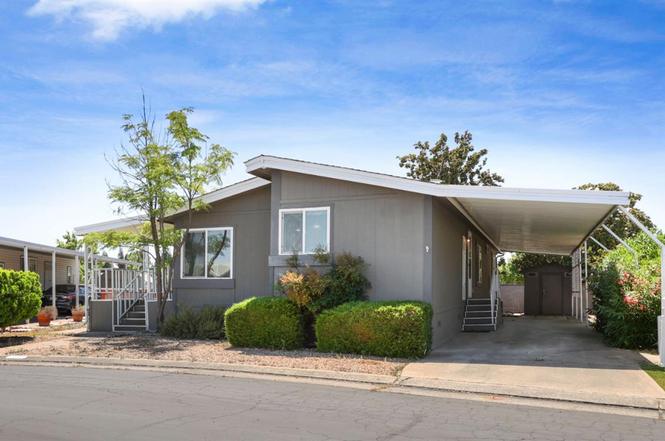
6706 Tam O Shanter Dr #66 · Stockton, CA
Flood risk 1/10 · Minimal
- FEMA flood zone
- X (shaded)
- Chance of flooding over 30 yrs
- 0.0%
- Est. flood insurance / yr
- $507 – $1,088
Fire risk 3/10 · Minor
- Est. fire insurance / yr
- $659 – $1,223
Heat risk 7/10 · Major
- Hot days now (above 102°F)
- 7 days/yr
- Hot days in 30 yrs
- 15 days/yr
Wind risk 1/10 · Minimal
- Chance of severe wind over 30 yrs
- —
Air-quality risk 10/10 · Severe
- Unhealthy air days now
- 30 days/yr
- Unhealthy air days in 30 yrs
- 30 days/yr
Risk factors via First Street. Map © Google.
Why this score? — see what drove the B+ grade
The composite is a weighted blend of 9 inputs, each scored 0–100. Each bar is that input's sub-score; the figure is the points it added to the 100-point composite (weight × sub-score).
- Cash flow +30.0/30.0
- ARV discount +15.0/15.0
- 1% rule +10.0/10.0
- DSCR +10.0/10.0
- Rent growth +4.3/5.0
- Schools +2.9/10.0
- Livability +2.9/5.0
- Condition / age +2.5/5.0
- Appreciation +0.0/10.0
$125,000
🖨 Deal sheet 📄 Offer letter ✓ Due diligence
Listing remarks
THIS TRIPLE-WIDE has everything you need! The large kitchen features roomy pantry closet and plenty of storage for all your cooking essentials. Enjoy the convenience of a gas stove and oven. A charming corner window lets in plenty of natural sunlight. The dining room includes a built-in China cabinet, ideal for showcasing your dish collection. The expansive living room is perfect for relaxing, complete with a cozy woodstove to keep you warm during the colder months. Need extra space? The flex room is perfect for a study, TV room, or a workout area, it's your choice! The home offers two bedrooms and two bathrooms, including a master bedroom with en suite bathroom and walk-in closet. Outside
Key facts
- Roomy pantry closet
- Large kitchen
- Gas stove
Tags
Property features AI
Finance
- Other: Located at 6706 Tam O Shanter Dr #66, Stockton, CA 95210 (within a park community)
- HOA & community: No homeowners association; Senior community
Exterior
- Parking: Covered parking; Guest parking available; No garage
- Utilities: Individual electric meter; Individual gas meter; Natural gas connected; Internet available; 220V in kitchen; Public water; Public sewer
- Home design: Manufactured home (in park), triple wide; Built in 1984
- Construction: Wood skirting; Composition roof; STARCREST manufactured home
- Exterior features: Carport awning; Porch awning
Interior
- Kitchen: Free-standing gas range; Range hood; Dishwasher; Pantry closet; Kitchen island; Synthetic countertops
- Bedrooms: 2 bedrooms (including master bedroom)
- Flooring: Vinyl flooring
- Bathrooms: 2 full bathrooms; Tub with shower over
- Heating & cooling: Central cooling; Central heating; Wood stove
- Interior features: Wood-burning free-standing fireplace; Porch with steps; Window screens; Pets allowed with size limit; Bonus room; Formal dining area; Cathedral/vaulted living room ceiling
- Laundry & utility: Inside laundry room with sink; 220V in laundry; Electric hookup for laundry
Neighborhood map
What this means for you Summary
Snapshot
- This is a 2-bed/2.0-bath manufactured listed at $125k.
Deal economics
- At list price, monthly cash flow is $872 ($10k/yr) — positive.
- The deal already cash-flows at list — no discount required.
- Meets the 1% rule at list price ($2k rent vs $125k).
- Cap rate 14.7% vs local median 3.6% in Stockton — top-decile yield for the area; either an underpriced asset or a hidden risk that comps aren't pricing in. Stress-test before assuming the spread holds.
Location & tenants
- Location reads 57/100 on livability (#734 in CA) — a working-class tenant base; expect higher turnover. Strengths: housing A+, health & safety A, amenities A-; Watch: employment C-, schools D-, crime F.
- Stockton Unified (urban): math 23% / reading 46% proficiency, ranked #295 of 517 in CA (top 57%) — families likely to look elsewhere, expect single-tenant / working-renter base with shorter leases; 78% free/reduced lunch — lower-income household profile, screen leases tightly.
- Market conditions: Rents rising fast (+7.1%/yr); 102 active listings in the ZIP; 16 comparable units currently listed for rent nearby; rentals at typical pace (median 24d on market — plan ~3-4 weeks tenant-placement turnaround); 44% of comp listings sitting > 30 days — soft ceiling on asking rent; 3,779 units permitted in San Joaquin County in 2024 (0 in 5+ unit buildings).
- This rent runs 39% of the median local income ($68k/yr) — at the standard rent-burdened threshold; future hikes will face affordability resistance.
Forward outlook
- Local home prices are declining (-3.0%/yr); year-one equity from $864 of loan paydown is wiped out by about $4k of value loss. Plan a longer hold.
- San Joaquin County population projected at +17% by 2050 — long-run rental-demand tailwind backs the buy-and-hold thesis.
- At projected returns (-3.0% appreciation + 7.1% rent growth), your $35k cash investment doubles in ~4 years — after that, you're playing with house money.
Negotiation context
- Only 4 days on market — expect competitive offers; lowballing is unlikely to land.
Risks & watch-outs
- Climate carrying-cost: extreme-heat days projected 7→15/yr by 2055 (HVAC capex compounding) — expect insurance premiums to compound above CPI over the hold.
Questions for the listing agent
- Is there a deadline driving the sale (1031 exchange, divorce, estate, relocation)? That informs how much negotiation room exists.
- Schools are D-rated, which usually means shorter tenancies and higher turnover. Who's the typical renter profile here, and what's been the actual vacancy rate?
- Crime grade is F in this area — have there been break-ins, vandalism, or insurance claims at this property in the last 3 years? What carrier currently insures it and at what premium?
- What's the average days-on-market for RENTAL listings here right now (not sales)? A rising rental-DOM trend means longer vacancies and softer asking-rent achievability than the comps imply.
- What's the recent tenant-quality profile in this submarket — average credit score on applications, eviction rate, late-payment / NSF rate, and stable-employment percentage? A property-management company in the area should have these aggregated.
- How much new for-sale + rental construction is in the pipeline within 1–3 miles? Heavy new supply typically softens prices + rents 12–24 months out; constrained supply supports both.
Investment metrics
- 1% rule
- 1.76% ✓
- Cap rate
- 14.66%
- Cash-on-cash
- 29.88%
- DSCR
- 2.33
- GRM
- 4.7
CMA / ARV
- ARV (on-the-fly)
- $168,096
- Comps found
- 7
Show comp detail 7 sales within ~0.75 mi
| Address | Dist | Beds/Ba | Sqft | Sold | Price | $/sf | Match |
|---|---|---|---|---|---|---|---|
| 6706 Tam O Shanter Dr #61 | 0.00mi | 2/2.0 | 1,584 (-3%) | 7mo | $175,000 | $110 | 90 |
| 6706 Tam O Shanter #96 | 0.00mi | 3/2.0 (+1) | 1,680 (+3%) | 4mo | $151,000 | $90 | 87 |
| 6706 Tam O Shanter Dr #17 | 0.00mi | 2/2.0 | 1,558 (-4%) | 8mo | $170,000 | $109 | 85 |
| 6706 Tam O Shanter Dr #126 | 0.00mi | 2/2.0 | 1,800 (+10%) | 3mo | $129,000 | $72 | 80 |
| 6706 Tam O Shanter Dr #45 | 0.00mi | 2/2.0 | 1,440 (-12%) | 4mo | $159,000 | $110 | 77 |
| 6706 Tam O Shanter Dr #2 | 0.08mi | 2/2.0 | 1,674 (+3%) | 22mo | $127,000 | $76 | 73 |
| 6706 Tam O Shanter #32 | 0.07mi | 2/2.0 | 1,440 (-12%) | 16mo | $148,000 | $103 | 64 |
Match score weights: distance 35% · size 25% · config 20% · recency 20%. Top-matched comps best support the ARV.
Projected returns pro-forma
-3.0% appreciation · 7.09% rent growth · sell at horizon
- IRR
- 29.0%
- Equity multiple
- 2.28×
- Total profit
- $44,703
- Equity at exit
- $18,638
- IRR
- 38.7%
- Equity multiple
- 5.36×
- Total profit
- $152,567
- Equity at exit
- $10,808
Cash invested: $35,000 (down + closing). Projections, not guarantees.
Landlord ↔ Tenant lean methodology
- Overall (STATE)
- 18 Strongly Tenant-Friendly
- State California
- 18 Strongly Tenant-Friendly · D+13
- County
- — inherits STATE
- City
- — inherits STATE
ZIP-level market 95210
- Rents YoY
- 7.1%
- Active inventory
- 102
- Price-to-rent
- 4.7×
Monthly cashflow live
- Estimated rent
- $2,197 high interval (Pro) →
- Mortgage (P&I)
- −$656
- Tax est. 1.5%
- −$156 /mo · $1,875/yr
- Insurance
- −$52
- HOA
- −$0
- Vacancy / Maint / Mgmt
- −$461
- Net cashflow
- $872
Break-even live
UW: 25.0% down · 7.5% · 30yr · 1.5% tax · 5.0% vac · 8.0% maint · 8.0% mgmt
Financing live
Cash to close
- Down payment
- $31,250
- Closing costs
- $3,750
- Reserves months
- —
- Total cash needed
- —
Loan-product check · same deal, 3 products live
Conventional
25% down · 7.5% · 30yr
- Down + closing
- —
- Monthly P&I
- —
- Monthly cashflow
- —
- DSCR
- —
- Eligible?
- —
Personal DTI + credit; lowest rate.
DSCR
20% down · 8.5% · 30yr
- Down + closing
- —
- Monthly P&I
- —
- Monthly cashflow
- —
- DSCR
- —
- Eligible?
- —
No personal income docs; deal must DSCR.
Hard money
10% down · 12.0% · 12mo
- Down + closing
- —
- Monthly P&I
- —
- Monthly cashflow
- —
- DSCR
- —
- Eligible?
- —
Short-term bridge; refi at stabilization.
Rent comps 16 comps
| Address | Beds | Baths | Sqft | Rent | $/sqft | DOM | Units | Dist |
|---|---|---|---|---|---|---|---|---|
| 6465 West Ln Stockton, CA | 2.0 | 1.0 | 1200 | $1,625 | $1.35 | 44d | 1 | 0.15mi |
| 5761 Caribbean Cir Stockton, CA | 3.0 | 2.0 | 1533 | $3,200 | $2.09 | 43d | 1 | 0.62mi |
| 5337 Barbados Cir Stockton, CA | 3.0 | 2.0 | 1309 | $2,300 | $1.76 | 21d | 1 | 0.67mi |
| 7409 Village Green Dr Stockton, CA | 3.0 | 2.0 | 1141 | $2,000 | $1.75 | 43d | 1 | 0.75mi |
| 218 E Longview Ave Stockton, CA | 3.0 | 2.0 | 1416 | $2,350 | $1.66 | 14d | 1 | 0.80mi |
| 5509 Kermit Ln Stockton, CA | 3.0 | 2.0 | 1317 | $2,500 | $1.90 | 14d | 1 | 0.86mi |
| 5509 Kermit Ln Stockton, CA | 3.0 | 2.0 | 1317 | $2,500 | $1.90 | 3d | 1 | 0.86mi |
| 326 Sue Ct Stockton, CA | 3.0 | 2.0 | 1153 | $2,495 | $2.16 | 23d | 1 | 0.93mi |
| 326 Sue Ct Stockton, CA | 3.0 | 2.0 | 1153 | $2,495 | $2.16 | 21d | 1 | 0.93mi |
| 7620 N El Dorado St Stockton, CA | 1.0–3.0 | 1.0–2.0 | 827 | $1,538 | $1.86 | 43d | 1 | 1.00mi |
| 230 W Pearl Ave Stockton, CA | 3.0 | 3.0 | 1196 | $3,050 | $2.55 | 19d | 1 | 1.14mi |
| 451 Marengo Ave Stockton, CA | 3.0 | 1.0 | 1100 | $2,250 | $2.05 | 14d | 1 | 1.23mi |
| 1857 Crestwood Cir Stockton, CA | 3.0 | 2.0 | 1561 | $2,450 | $1.57 | 43d | 1 | 1.27mi |
| 1768 Crestwood Cir Stockton, CA | 3.0 | 2.0 | 1389 | $2,500 | $1.80 | 43d | 1 | 1.29mi |
| 4790 Winona Way Stockton, CA | 3.0 | 2.0 | 1483 | $2,450 | $1.65 | 23d | 1 | 1.31mi |
| 8446 N El Dorado St Stockton, CA | 3.0 | 2.0 | 1269 | $2,300 | $1.81 | 43d | 1 | 1.39mi |
Listing history 5 events
-
2026-06-18days on market $125,000 Active 4 DOM
-
2026-06-17days on market $125,000 Active 3 DOM
-
2026-06-16days on market $125,000 Active 2 DOM
-
2026-06-15remarks 699-char remark
-
2026-06-15$125,000 Active 1 DOM
ⓘ Source: listings_history table (triggers on properties + properties_extension) + one-shot
backfill from property_details.listing_events for pre-trigger history.
Climate risk First Street
- Flood 1/10 Low FEMA zone X (shaded) · 0% chance over 30 yrs
- Wildfire 3/10 Moderate
- Heat 7/10 Severe 7 d/yr ≥102°F today · 15 d/yr by 30 yrs out
- Wind 1/10 Low
- Air quality 10/10 Extreme 30 unhealthy d/yr today · 30 by 30 yrs out
Nearby sold comps map
Loading sold comps map…
Walkable amenities ~0.75 mi
Loading nearby amenities…
Taxation est. · year 1
- Rental income
- $26,361
- − Mortgage interest
- −$7,002
- − Property taxes
- −$1,875
- − Insurance
- −$625
- − Repairs & maintenance
- −$2,109
- − Management
- −$2,109
- − Depreciation
- −$3,636
- Taxable income
- $9,005
- Est. tax owed @ 24.0%
- −$2,161
- After-tax cash flow
- $8,298/yr
For passive investors: Depreciation is non-cash, so a rental often shows a tax loss while cash-flowing — sheltering income. Rental losses are passive: they offset passive income freely, and up to $25,000/yr can offset ordinary (W-2) income if you actively participate and your MAGI is under $100k (phasing out to $0 by $150k); unused losses carry forward. On sale, claimed depreciation is recaptured at up to 25%, and gains may owe capital-gains tax (a 1031 exchange can defer both). Figures are a year-1 estimate at your 24.0% rate — not tax advice; consult a CPA.
Schools (NCES district)
- District
- Stockton Unified
- NCES district ID
- 0638010
- Math proficiency
- 23% ▲ 2.00%
- Reading proficiency
- 46% ▲ 16.00%
- Median HH income
- $37,563
- Composite
- 28.65/100
- National rank
- #6701
- State rank
- #295 of 517 in CA
Livability — Stockton
- Score
- 57/100
- State rank
- #734
- US rank
- #21638
Category grades
Schools grade is shown separately in the Schools card above.
Census & demographics
- Census place
- Stockton, CA
- County
- San Joaquin County · 729,570 people
- City population
- 332,006
- Metro
- Stockton, CA
- Population (ZIP)
- 41,549
- Household income
- $67,991
- Rent vs Own
- Severe rent burden
- 1817.0
Population outlook (San Joaquin County) Hauer SSP2
- Today (2025)
- 796,965 people
- By 2030
- 828,849 · +4.0%
- By 2040
- 885,611 · +11.1%
- By 2050
- 929,798 · +16.7%
- By 2075
- 994,578 · +24.8%
- By 2100
- 971,291 · +21.9%
Race, ethnicity, and origin ACS 2023
- Neighborhood character
- Highly diverse neighborhood (Simpson 0.73)
- Race & ethnicity
- Hispanic / Latino 38% Asian 31% Two or more races 21% White 13% Black 11% Pacific Islander 1%
- Hispanic origin (detail)
- Mexican 34%
- Common ancestry
- Italian 1% Russian 1%
- Foreign-born
- 27% · Canada, Vietnam, China
- Languages at home
- 49% English-only · Spanish 25% Other Asian/Pacific 12% Other Indo-European 6%
Political lean MEDSL · San Joaquin
- 2024 margin
- Toss-up / Even · D 48.0% · R 48.9% · Other 3.0%
- 2008→2024 swing
- -11.6pp toward R · 2008: 10.7pp · 2024: -0.9pp
- All cycles
- 2024: R+0.9 2020: D+13.9 2016: D+12.9 2012: D+8.9 2008: D+10.7
Not yet ingested
- Civics
- —
Market trends
- HPI YoY
- ▼ -283.31%
- Current HPI
- 349.495
- Rent YoY
- ▲ 7.09%
- Metro
- Stockton, CA
- State GDP YoY
- ▲ 3.21%
- F500 in state
- 116
Industry mix (Fortune 500 HQ in CA)
| Industry | F500 HQs | Revenue |
|---|---|---|
| Technology | 27 | $1,492B |
|
||
| Financial Services | 3 | $174B |
|
||
| Retail | 3 | $44B |
|
||
| Insurance | 3 | $26B |
|
||
| Media / Entertainment | 2 | $115B |
|
||
| Pharmaceuticals / Biotech | 2 | $62B |
|
||
Cash-flow waterfall
monthlySold comps — $/sqft
last 12 mo · ≤1 miLoading sold comps…