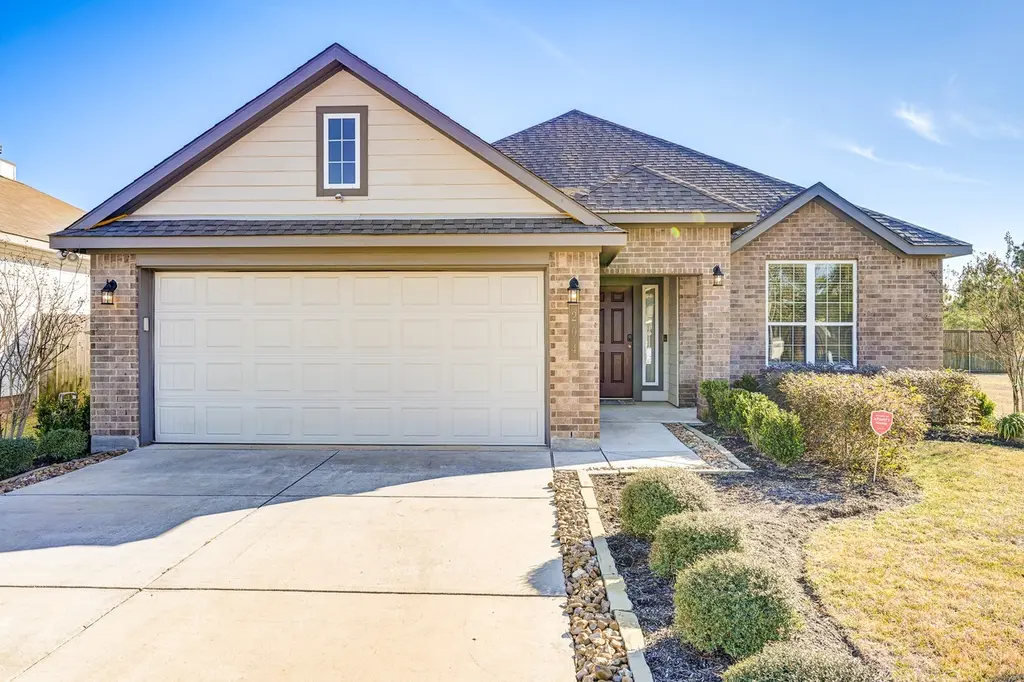
204 Shoreview Dr · Cut and Shoot, TX
Flood risk No data
- FEMA flood zone
- —
- Chance of flooding over 30 yrs
- —
- Est. flood insurance / yr
- —
Fire risk No data
- Est. fire insurance / yr
- —
Heat risk No data
- Hot days now (above threshold)
- —
- Hot days in 30 yrs
- —
Wind risk No data
- Chance of severe wind over 30 yrs
- —
Air-quality risk No data
- Unhealthy air days now
- —
- Unhealthy air days in 30 yrs
- —
Risk factors via First Street. Map © Google.
Why this score? — see what drove the D+ grade
The composite is a weighted blend of 9 inputs, each scored 0–100. Each bar is that input's sub-score; the figure is the points it added to the 100-point composite (weight × sub-score).
- ARV discount +15.0/15.0
- Cash flow +12.5/30.0
- Schools +5.1/10.0
- 1% rule +4.2/10.0
- Condition / age +4.0/5.0
- DSCR +3.7/10.0
- Livability +2.8/5.0
- Rent growth +2.4/5.0
- Appreciation +0.0/10.0
$214,900
🖨 Deal sheet 📄 Offer letter ✓ Due diligence
Listing remarks
Discover this inviting 1-story single-family home in the Lakes at Crockett Martin, featuring 3 bedrooms, 2 full bathrooms, a formal dining, and an open layout filled with abundant natural light. The kitchen is thoughtfully designed with a large island and breakfast bar, granite countertops, a striking tile backsplash, undercabinet lighting, and a pantry, all flowing seamlessly into the family room for easy entertaining. Your primary suite comes with an en-suite bath with double sinks, soaking tub, separate shower, and a walk-in closet. Step outside to a fenced backyard with a covered patio, ideal for outdoor dining or quiet evenings. Residents enjoy neighborhood amenities, including scenic
Key facts
- Shared green spaces
- Stocked pond
- Covered patio
Tags
Property features AI
Finance
- HOA & community: POA: Lakes at Crockett Martin; Annual association fee of $450; Community curbs
Exterior
- Parking: Attached 2-car garage; Driveway
- Security: Smoke detectors
- Utilities: Public water; Public sewer
- Home design: Residential property; Built in 2021; Slab foundation; Composition roof
- Construction: Brick and cement siding construction
- Exterior features: Covered patio; Patio; Deck; Fenced backyard; Subdivision setting; Concrete road access
Interior
- Kitchen: Dishwasher; Electric oven; Electric range; Disposal; Microwave
- Bedrooms: Primary bedroom (First floor, 17x13); Bedroom (First floor, 13x11); Bedroom (First floor, 12x10)
- Flooring: Carpet; Tile; Wood
- Bathrooms: 2 full bathrooms
- Heating & cooling: Central heating (electric); Central air (electric)
- Interior features: Breakfast bar; Double vanity; Granite counters; Kitchen island; Kitchen/family room combo; Pantry; Soaking tub; Separate shower; Ceiling fans; Programmable thermostat
- Laundry & utility: Washer hookup; Electric dryer hookup; Utility room (First floor, 6x6)
Neighborhood map
What this means for you Summary
Snapshot
- This is a 3-bed/2.0-bath single-family listed at $215k. Condition is rated good.
Deal economics
- At list price, monthly cash flow is $-33 ($-394/yr) — negative.
- To cash-flow at today's rent, offer at most $209k (2.7% below list).
- To meet the 1% rule (rent ≥ 1% of price), the offer needs to be $198k (7.8% below list).
- Recommended offer: $198k (7.8% below list) — sets the bar for 1% rule.
- Cap rate 6.1% vs local median 4.8% in Cut and Shoot — meaningfully above typical; check what's discounted (condition, days-on-market, listing class) to confirm the premium yield is real.
Location & tenants
- Location reads 56/100 on livability (#1,326 in TX) — a working-class tenant base; expect higher turnover. Strengths: cost of living A+, housing A+; Watch: crime D-, amenities F, commute F.
- Conroe ISD (other): math 57% / reading 57% proficiency, ranked #69 of 826 in TX (top 8%) — acceptable for families but not a draw, mixed tenant base, ~2y average lease.
- Zoned schools: Caney Creek H S (math 33% / reading 42%, grade F, #888 of 1,632 statewide, top 55%, 2,504 students, 79% FRL) — zoned schools average 79% FRL vs 34% district-wide (45 pts higher); higher-poverty schools than district average — tighter screening recommended.
- Zoned-school proficiency averages 38% at this address vs 57% district-wide (-20 pts) — the specific schools serving this property underperform the Conroe ISD average; the district grade overstates school quality for this exact location.
- Market conditions: Rents soft (-0.3%/yr); 714 active listings in the ZIP; 4 comparable units currently listed for rent nearby; rentals lingering (median 44d on market — plan ~5-8 weeks vacancy on turnover, expect pricing pressure); 50% of comp listings sitting > 30 days — soft ceiling on asking rent; solid renter incomes; 13,259 units permitted in Montgomery County in 2024 (1,402 in 5+ unit buildings).
- This rent runs 32% of the median local income ($75k/yr) — at the standard rent-burdened threshold; future hikes will face affordability resistance.
Forward outlook
- Local home prices are declining (-3.0%/yr); year-one equity from $1k of loan paydown is wiped out by about $6k of value loss. Plan a longer hold.
- Montgomery County population projected at +65% by 2050 — long-run rental-demand tailwind backs the buy-and-hold thesis.
Negotiation context
- It's been on market 34 days — a 3% lower offer ($208k) is reasonable based on typical stale-listing flexibility.
- 5 sale attempts with the ask held roughly flat each time — persistent listings suggest the price (not the market) is what's stuck; bring a comps-based counter.
Questions for the listing agent
- What do current leases actually rent for vs. the listed asking? Can we see a recent rent roll and the last 12 months of T-12 income?
- It's been on market 34 days. Have you received any prior offers? Is the seller open to a 8% concession, seller financing, or rate buy-down credit?
- What does the HOA fee cover, when was the last increase, and are there any pending special assessments or reserve-fund shortfalls?
- Is there a deadline driving the sale (1031 exchange, divorce, estate, relocation)? That informs how much negotiation room exists.
- Schools are F-rated, which usually means shorter tenancies and higher turnover. Who's the typical renter profile here, and what's been the actual vacancy rate?
- Crime grade is D in this area — have there been break-ins, vandalism, or insurance claims at this property in the last 3 years? What carrier currently insures it and at what premium?
- The area grade is low — what's the realistic commute time and amenity access for the typical tenant pool here? Any planned neighborhood developments (good or bad) we should know about?
- What's the average days-on-market for RENTAL listings here right now (not sales)? A rising rental-DOM trend means longer vacancies and softer asking-rent achievability than the comps imply.
- What's the recent tenant-quality profile in this submarket — average credit score on applications, eviction rate, late-payment / NSF rate, and stable-employment percentage? A property-management company in the area should have these aggregated.
- How much new for-sale + rental construction is in the pipeline within 1–3 miles? Heavy new supply typically softens prices + rents 12–24 months out; constrained supply supports both.
Investment metrics
- 1% rule
- 0.92% ✗
- Cap rate
- 6.11%
- Cash-on-cash
- -0.66%
- DSCR
- 0.97
- GRM
- 9.0
CMA / ARV
- ARV (median comp)
- $291,428
- List price
- $214,900
- Delta
- -26.26%
- Verdict
- UNDERPRICED
- Comps
- 20 within 1.0 mi
Show comp detail 12 sales within ~0.75 mi
| Address | Dist | Beds/Ba | Sqft | Sold | Price | $/sf | Match |
|---|---|---|---|---|---|---|---|
| 339 Parkin Ct | 0.03mi | 4/2.0 (+1) | 1,676 (+2%) | 2mo | $269,990 | $161 | 90 |
| 16114 Hatton Dr | 0.03mi | 4/2.0 (+1) | 1,716 (+4%) | 1mo | $278,990 | $163 | 86 |
| 16039 Tallis Dr | 0.03mi | 4/2.0 (+1) | 1,716 (+4%) | 7mo | $277,990 | $162 | 81 |
| 335 Parkin Ct | 0.32mi | 4/2.0 (+1) | 1,716 (+4%) | 2mo | $278,990 | $163 | 72 |
| 209 Shoreview Dr | 0.03mi | 4/2.0 (+1) | 1,859 (+13%) | 1mo | $292,990 | $158 | 72 |
| 327 Parkin Ct | 0.39mi | 4/2.0 (+1) | 1,716 (+4%) | 1mo | $275,990 | $161 | 70 |
| 338 Parkin Ct | 0.36mi | 3/2.0 | 1,484 (-10%) | 2mo | $260,990 | $176 | 65 |
| 16059 Tallis Dr | 0.39mi | 4/2.0 (+1) | 1,716 (+4%) | 7mo | $271,990 | $159 | 64 |
| 16063 Tallis Dr | 0.36mi | 3/2.0 | 1,484 (-10%) | 4mo | $253,990 | $171 | 63 |
| 323 Parkin Ct | 0.36mi | 3/2.0 | 1,484 (-10%) | 6mo | $257,990 | $174 | 62 |
| 488 Shoreview Dr | 0.31mi | 3/2.0 | 1,446 (-12%) | 6mo | $244,900 | $169 | 60 |
| 515 Fairfax Ln | 0.69mi | 4/2.5 (+1) | 1,758 (+6%) | 3mo | $349,500 | $199 | 48 |
Match score weights: distance 35% · size 25% · config 20% · recency 20%. Top-matched comps best support the ARV.
Projected returns pro-forma
-3.0% appreciation · 0.0% rent growth · sell at horizon
- IRR
- -21.0%
- Equity multiple
- 0.29×
- Total profit
- $-42,626
- Equity at exit
- $32,042
- IRR
- -24.4%
- Equity multiple
- -0.03×
- Total profit
- $-61,859
- Equity at exit
- $18,581
Cash invested: $60,172 (down + closing). Projections, not guarantees.
Landlord ↔ Tenant lean methodology
- Overall (STATE)
- 87 Strongly Landlord-Friendly
- State Texas
- 87 Strongly Landlord-Friendly · R+5
- County
- — inherits STATE
- City
- — inherits STATE
ZIP-level market 77303
- Home prices YoY
- -22.4%
- Rents YoY
- -0.3%
- Active inventory
- 714
- Price-to-rent
- 9.0×
Monthly cashflow live
- Estimated rent
- $1,982 medium interval (Pro) →
- Mortgage (P&I)
- −$1,127
- Tax from tax record
- −$344 /mo · $4,133/yr
- Insurance
- −$90
- HOA
- −$38
- Vacancy / Maint / Mgmt
- −$416
- Net cashflow
- $-33
Break-even live
UW: 25.0% down · 7.5% · 30yr · 1.5% tax · 5.0% vac · 8.0% maint · 8.0% mgmt
Financing live
Cash to close
- Down payment
- $53,725
- Closing costs
- $6,447
- Reserves months
- —
- Total cash needed
- —
Loan-product check · same deal, 3 products live
Conventional
25% down · 7.5% · 30yr
- Down + closing
- —
- Monthly P&I
- —
- Monthly cashflow
- —
- DSCR
- —
- Eligible?
- —
Personal DTI + credit; lowest rate.
DSCR
20% down · 8.5% · 30yr
- Down + closing
- —
- Monthly P&I
- —
- Monthly cashflow
- —
- DSCR
- —
- Eligible?
- —
No personal income docs; deal must DSCR.
Hard money
10% down · 12.0% · 12mo
- Down + closing
- —
- Monthly P&I
- —
- Monthly cashflow
- —
- DSCR
- —
- Eligible?
- —
Short-term bridge; refi at stabilization.
Rent comps 4 comps
| Address | Beds | Baths | Sqft | Rent | $/sqft | DOM | Units | Dist |
|---|---|---|---|---|---|---|---|---|
| 343 Parkin Ct Cut and Shoot, TX | 3.0 | 2.0 | 2014 | $1,985 | $0.99 | 43d | 1 | 0.28mi |
| 2140 Cedar Bend Dr Conroe, TX | 4.0 | 3.0 | 1871 | $1,995 | $1.07 | 10d | 1 | 1.31mi |
| 15141 Meadow Gln S Conroe, TX | 3.0 | 3.0 | 1864 | $1,961 | $1.05 | 22d | 1 | 1.31mi |
| 2221 Cedar Valley Dr Conroe, TX | 3.0 | 2.0 | 1920 | $1,695 | $0.88 | 43d | 1 | 1.33mi |
HOA detail
- Monthly dues
- $38 · $456/yr
Listing history 23 events
-
2026-06-18days on market $214,900 Active 34 DOM
-
2026-06-17days on market $214,900 Active 33 DOM
-
2026-06-16days on market $214,900 Active 32 DOM
-
2026-06-15days on market $214,900 Active 31 DOM
-
2026-06-13days on market $214,900 Active 29 DOM
-
2026-06-09days on market $214,900 Active 25 DOM
-
2026-06-08days on market $214,900 Active 24 DOM
-
2026-06-07days on market $214,900 Active 23 DOM
-
2026-06-04days on market $214,900 Active 20 DOM
-
2026-06-03days on market $214,900 Active 19 DOM
-
2026-06-02days on market $214,900 Active 18 DOM
-
2026-06-01days on market $214,900 Active 17 DOM
-
2026-05-31days on market $214,900 Active 16 DOM
-
2026-05-15historical
-
2026-05-15$214,900 Active 991-char remark
-
2026-04-16price $249,900
-
2026-03-25$259,900 Active
-
2026-03-25historical
-
2026-02-15$2,100
-
2026-01-30$265,000 Active
-
2026-01-17historical $2,300
-
2026-01-04price $2,300
-
2025-11-06$2,400
ⓘ Source: listings_history table (triggers on properties + properties_extension) + one-shot
backfill from property_details.listing_events for pre-trigger history.
Tax reassessment forecast TX · Resets to sale price
- Current annual tax
- $4,133 · $344/mo
- Projected year-2 tax
- $4,133 · $344/mo
- Expected delta
- $0/yr ($0/mo · 0.0%)
ⓘ Screening estimate from a state-policy table — verify with the county assessor before closing.
Nearby sold comps map
Loading sold comps map…
Walkable amenities ~0.75 mi
Loading nearby amenities…
Taxation est. · year 1
- Rental income
- $23,788
- − Mortgage interest
- −$12,038
- − Property taxes
- −$4,133
- − Insurance
- −$1,074
- − Repairs & maintenance
- −$1,903
- − Management
- −$1,903
- − HOA
- −$456
- − Depreciation
- −$6,252
- Taxable loss
- −$3,971
- Est. tax savings @ 24.0%
- +$953
- After-tax cash flow
- $559/yr
For passive investors: Depreciation is non-cash, so a rental often shows a tax loss while cash-flowing — sheltering income. Rental losses are passive: they offset passive income freely, and up to $25,000/yr can offset ordinary (W-2) income if you actively participate and your MAGI is under $100k (phasing out to $0 by $150k); unused losses carry forward. On sale, claimed depreciation is recaptured at up to 25%, and gains may owe capital-gains tax (a 1031 exchange can defer both). Figures are a year-1 estimate at your 24.0% rate — not tax advice; consult a CPA.
Condition & rehab AI · 6 photos
This single-family home in the Lakes at Crockett Martin is in good condition with a good condition score of 80. It is move-in ready with a cosmetic rehab level and minimal repairs needed. The highest-ROI updates to increase its value are painting the exterior, landscaping, and replacing window treatments.
Value-add opportunities
- Both Paint exterior — Enhances curb appeal and value
- Both Landscaping — Improves curb appeal and value
- Both Replace window treatments — Enhances curb appeal and value
Renovation cost estimate screening
Value-add ROI direction
- Both Paint exterior — Enhances curb appeal and value ↑
- Both Landscaping — Improves curb appeal and value ↑
- Both Replace window treatments — Enhances curb appeal and value ↑
ⓘ Cost ranges are severity-bucket heuristics (US national rule-of-thumb). Get contractor quotes + a written scope before underwriting a rehab budget.
Schools (NCES district)
- District
- Conroe ISD
- NCES district ID
- 4815000
- Math proficiency
- 57% ▼ -6.00%
- Reading proficiency
- 57% ▼ -1.00%
- Median HH income
- $71,541
- Composite
- 50.65/100
- National rank
- #1833
- State rank
- #69 of 826 in TX
Livability — Cut and Shoot
- Score
- 56/100
- State rank
- #1326
- US rank
- #22835
Category grades
Schools grade is shown separately in the Schools card above.
Census & demographics
- County
- Montgomery County · 663,713 people
- Metro
- Houston-The Woodlands-Sugar Land, TX
- Population (ZIP)
- 28,854
- Household income
- $75,348
- Rent vs Own
- Severe rent burden
- 464.0
Population outlook (Montgomery County) Hauer SSP2
- Today (2025)
- 713,896 people
- By 2030
- 805,263 · +12.8%
- By 2040
- 992,708 · +39.1%
- By 2050
- 1,179,590 · +65.2%
- By 2075
- 1,628,084 · +128.1%
- By 2100
- 1,937,880 · +171.5%
Race, ethnicity, and origin ACS 2023
- Neighborhood character
- Diverse neighborhood (Simpson 0.56)
- Race & ethnicity
- White 54% Hispanic / Latino 38% Two or more races 17% Black 4%
- Hispanic origin (detail)
- Mexican 25%
- Common ancestry
- Lithuanian 1% Romanian 1% Slovak 1%
- Foreign-born
- 13% · Canada, Jamaica
- Languages at home
- 69% English-only · Spanish 31%
Political lean MEDSL · Montgomery
- 2024 margin
- Solid R (+45.5) · D 26.8% · R 72.3%
- 2008→2024 swing
- +7.2pp toward D · 2008: -52.7pp · 2024: -45.5pp
- All cycles
- 2024: R+45.5 2020: R+43.8 2016: R+51.4 2012: R+60.7 2008: R+52.7
Not yet ingested
- Civics
- —
Market trends
- HPI YoY
- ▼ -77.71%
- Current HPI
- 269.5367
- Rent YoY
- ▼ -0.31%
- Metro
- Houston-The Woodlands-Sugar Land, TX
- State GDP YoY
- ▲ 3.95%
- F500 in state
- 110
Industry mix (Fortune 500 HQ in TX)
| Industry | F500 HQs | Revenue |
|---|---|---|
| Energy | 16 | $1,198B |
|
||
| Technology | 5 | $198B |
|
||
| Engineering / Construction | 4 | $72B |
|
||
| Energy Services | 3 | $60B |
|
||
| Utilities | 3 | $41B |
|
||
| Healthcare | 2 | $330B |
|
||
Price history
+8854.2% since first listed10 events — show timeline
- 2026-05-15 Listed $214,900 HARMLS
- 2026-05-15 Listing Removed — HARMLS
- 2026-04-16 Price Changed $249,900 HARMLS
- 2026-03-25 Listing Removed — HARMLS
- 2026-03-25 Listed $259,900 HARMLS
- 2026-02-15 Listed for Rent $2,100 HARMLS
- 2026-01-30 Listed $265,000 HARMLS
- 2026-01-17 Rental Removed $2,300 HARMLS
- 2026-01-04 Price Changed $2,300 HARMLS
- 2025-11-06 Listed for Rent $2,400 HARMLS
Cash-flow waterfall
monthlySold comps — $/sqft
last 12 mo · ≤1 miLoading sold comps…