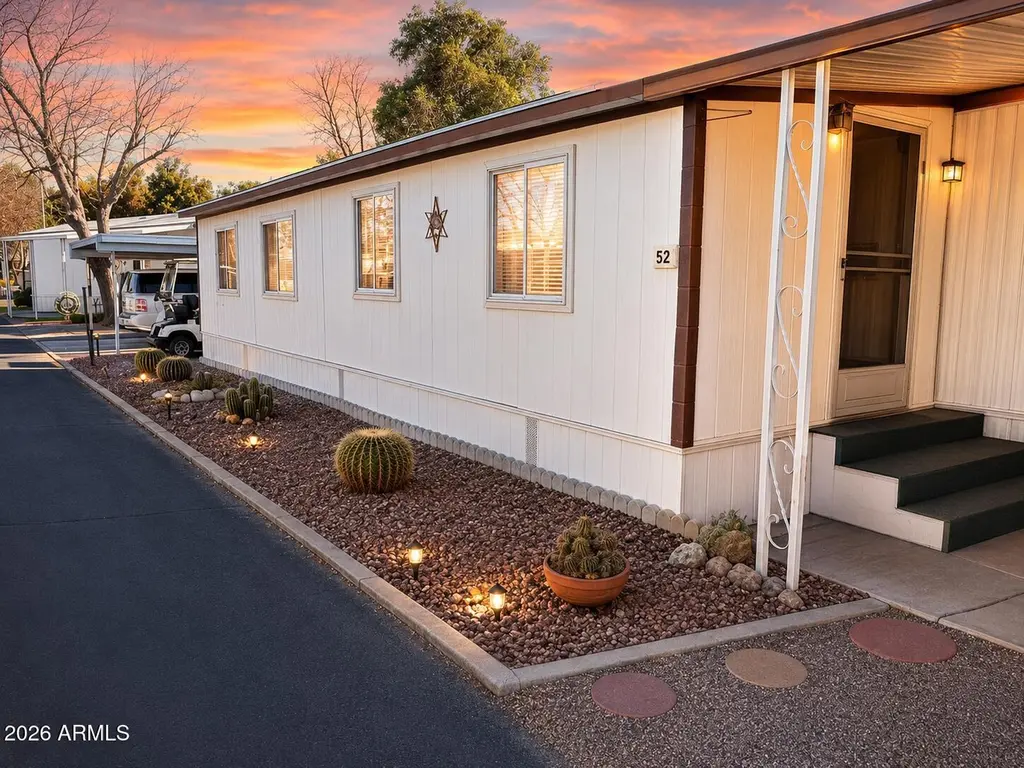
550 Palm Dr #52 · Wickenburg, AZ
Flood risk 8/10 · Major
- FEMA flood zone
- AE
- Chance of flooding over 30 yrs
- 0.99%
- Est. flood insurance / yr
- $1,737 – $8,500
Fire risk 5/10 · Moderate
- Est. fire insurance / yr
- $610 – $1,132
Heat risk 8/10 · Major
- Hot days now (above 110°F)
- 7 days/yr
- Hot days in 30 yrs
- 16 days/yr
Wind risk 1/10 · Minimal
- Chance of severe wind over 30 yrs
- —
Air-quality risk 1/10 · Minimal
- Unhealthy air days now
- 0 days/yr
- Unhealthy air days in 30 yrs
- 0 days/yr
Risk factors via First Street. Map © Google.
Why this score? — see what drove the D grade
The composite is a weighted blend of 9 inputs, each scored 0–100. Each bar is that input's sub-score; the figure is the points it added to the 100-point composite (weight × sub-score).
- Cash flow +15.0/30.0
- ARV discount +7.5/15.0
- 1% rule +5.0/10.0
- DSCR +5.0/10.0
- Livability +3.5/5.0
- Schools +2.9/10.0
- Rent growth +2.5/5.0
- Condition / age +2.5/5.0
- Appreciation +0.0/10.0
$19,999
🖨 Deal sheet 📄 Offer letter ✓ Due diligence
Key facts
- Covered living space
- Multiple windows
- Metal roof
Tags
Property features AI
Finance
- Other: Community features include proximity to light rail stop and on-site community laundry
- HOA & community: Community association with monthly fee; Association covers sewer, street maintenance, trash, and water; Land lease of $720 per month
Exterior
- Parking: Covered parking for 2 vehicles; Unassigned parking; 2-car carport
- Utilities: Private water company service; Septic tank sewer
- Home design: Manufactured/mobile home; Leasehold property
- Construction: Wood frame construction; Painted exterior; Rolled/hot mop roofing
- Exterior features: Painted wood-frame construction; Rolled/hot mop roof; No fencing; Desert front and desert back landscaping; City-maintained road access
Interior
- Kitchen: Reverse osmosis water system; Refrigerator included
- Bedrooms: Up to 2 possible bedrooms
- Flooring: Carpet; Vinyl
- Bathrooms: 1 full bathroom
- Heating & cooling: Has heating; Central air conditioning
- Interior features: Master bedroom on main level; No interior steps; Full bathroom in master bedroom; Dual-pane windows; Storage
- Laundry & utility: Indoor laundry hookups (washer/dryer hook-up only); Community coin-operated laundry available
Neighborhood map
What this means for you Summary
Snapshot
- This is a 2-bed/1.0-bath manufactured listed at $20k.
Deal economics
- At list price, monthly cash flow is $535 ($6k/yr) — positive.
- The deal already cash-flows at list — no discount required.
- Meets the 1% rule at list price ($1k rent vs $20k).
- Recommended offer: $20k (1.5% below list) — sets the bar for market timing.
- Cap rate 64.0% vs local median 3.0% in Wickenburg — top-decile yield for the area; either an underpriced asset or a hidden risk that comps aren't pricing in. Stress-test before assuming the spread holds.
Location & tenants
- Location reads 70/100 on livability (#41 in AZ) — a middle-class / working-renter tenant base. Strengths: crime A+, housing A+, cost of living A-; Watch: amenities F, commute F.
- Wickenburg Unified District (4236) (rural): math 33% / reading 35% proficiency, ranked #92 of 249 in AZ (top 37%) — families likely to look elsewhere, expect single-tenant / working-renter base with shorter leases.
- Zoned schools: Hassayampa Elementary School (math 37% / reading 32%, grade F, #471 of 1,109 statewide, top 44%, 284 students, 50% FRL); Vulture Peak Middle School (math 27% / reading 32%, grade F, #84 of 218 statewide, top 41%, 162 students, 51% FRL); Wickenburg High School (math 27% / reading 32%, grade F, #120 of 381 statewide, top 34%, 460 students, 40% FRL) — zoned schools at 47% FRL track the district average.
- Market conditions: 378 active listings in the ZIP; 5 comparable units currently listed for rent nearby; rentals leasing fast (median 1d on market — plan ~1-2 weeks tenant-placement turnaround); 40% of comp listings sitting > 30 days — soft ceiling on asking rent; 36,011 units permitted in Maricopa County in 2024 (12,801 in 5+ unit buildings).
Forward outlook
- Local home prices are declining (-3.0%/yr); year-one equity from $138 of loan paydown is wiped out by about $600 of value loss. Plan a longer hold.
- Maricopa County population projected at +38% by 2050 — long-run rental-demand tailwind backs the buy-and-hold thesis.
- At projected returns (-3.0% appreciation + 3.0% rent growth), your $6k cash investment doubles in ~1 year — after that, you're playing with house money.
Negotiation context
- It's been on market 22 days — a 2% lower offer ($20k) is reasonable based on typical stale-listing flexibility.
- 2 sale attempts since 2y ago with the ask held roughly flat each time — persistent listings suggest the price (not the market) is what's stuck; bring a comps-based counter.
Risks & watch-outs
- Watch-outs: flood insurance adds $427/mo.
- Climate carrying-cost: in FEMA flood zone AE (mandatory federal flood insurance); moderate wildfire risk; extreme-heat days projected 7→16/yr by 2055 (HVAC capex compounding) — expect insurance premiums to compound above CPI over the hold.
Questions for the listing agent
- Built in 1967 — when were the roof, HVAC, electrical panel, plumbing, and water heater last replaced?
- What's the actual annual flood-insurance premium (NFIP or private), and is the property in a SFHA with mandatory coverage?
- Is there a deadline driving the sale (1031 exchange, divorce, estate, relocation)? That informs how much negotiation room exists.
- Schools are D-rated, which usually means shorter tenancies and higher turnover. Who's the typical renter profile here, and what's been the actual vacancy rate?
- The area grade is low — what's the realistic commute time and amenity access for the typical tenant pool here? Any planned neighborhood developments (good or bad) we should know about?
- What's the average days-on-market for RENTAL listings here right now (not sales)? A rising rental-DOM trend means longer vacancies and softer asking-rent achievability than the comps imply.
- What's the recent tenant-quality profile in this submarket — average credit score on applications, eviction rate, late-payment / NSF rate, and stable-employment percentage? A property-management company in the area should have these aggregated.
- How much new for-sale + rental construction is in the pipeline within 1–3 miles? Heavy new supply typically softens prices + rents 12–24 months out; constrained supply supports both.
Investment metrics
- 1% rule
- 6.96% ✓
- Cap rate
- 63.97%
- Cash-on-cash
- 205.99%
- DSCR
- 10.17
- GRM
- 1.2
CMA / ARV
No comps found within radius.
Projected returns pro-forma
-3.0% appreciation · 3.0% rent growth · sell at horizon
- IRR
- —
- Equity multiple
- 6.55×
- Total profit
- $31,099
- Equity at exit
- $2,982
- IRR
- —
- Equity multiple
- 13.87×
- Total profit
- $72,084
- Equity at exit
- $1,729
Cash invested: $5,600 (down + closing). Projections, not guarantees.
Landlord ↔ Tenant lean methodology
- Overall (STATE)
- 87 Strongly Landlord-Friendly
- State Arizona
- 87 Strongly Landlord-Friendly · R+3
- County
- — inherits STATE
- City
- — inherits STATE
ZIP-level market 85390
- Home prices YoY
- -17.4%
- Active inventory
- 378
- Price-to-rent
- 1.2×
Monthly cashflow live
- Estimated rent
- $1,392 high interval (Pro) →
- Mortgage (P&I)
- −$105
- Tax est. 1.5%
- −$25 /mo · $300/yr
- Insurance
- −$8
- Flood insurance flood zone
- −$427 /mo · $5,118/yr
- HOA
- −$0
- Vacancy / Maint / Mgmt
- −$292
- Net cashflow
- $535
Break-even live
UW: 25.0% down · 7.5% · 30yr · 1.5% tax · 5.0% vac · 8.0% maint · 8.0% mgmt
Financing live
Cash to close
- Down payment
- $5,000
- Closing costs
- $600
- Reserves months
- —
- Total cash needed
- —
Loan-product check · same deal, 3 products live
Conventional
25% down · 7.5% · 30yr
- Down + closing
- —
- Monthly P&I
- —
- Monthly cashflow
- —
- DSCR
- —
- Eligible?
- —
Personal DTI + credit; lowest rate.
DSCR
20% down · 8.5% · 30yr
- Down + closing
- —
- Monthly P&I
- —
- Monthly cashflow
- —
- DSCR
- —
- Eligible?
- —
No personal income docs; deal must DSCR.
Hard money
10% down · 12.0% · 12mo
- Down + closing
- —
- Monthly P&I
- —
- Monthly cashflow
- —
- DSCR
- —
- Eligible?
- —
Short-term bridge; refi at stabilization.
Rent comps 5 comps
| Address | Beds | Baths | Sqft | Rent | $/sqft | DOM | Units | Dist |
|---|---|---|---|---|---|---|---|---|
| 757 N Oleander St Wickenburg, AZ | 1.0 | 1.0 | 576 | $1,200 | $2.08 | 43d | 1 | 0.05mi |
| 560 Penn Ln Wickenburg, AZ | 2.0–3.0 | 2.0 | 1051 | $1,595 | $1.52 | 1d | 6 | 0.51mi |
| 455 N Tegner St #26 Wickenburg, AZ | 1.0 | 1.0 | 792 | $1,150 | $1.45 | 1d | 1 | 0.51mi |
| 90 W Yavapai St Apt 9 Wickenburg, AZ | 1.0 | 1.0 | 608 | $1,250 | $2.06 | 43d | 1 | 0.55mi |
| 549 W Wickenburg Way Unit 2 Wickenburg, AZ | 1.0 | 1.0 | 610 | $995 | $1.63 | 1d | 1 | 0.62mi |
Listing history 17 events
-
2026-06-18days on market $19,999 Active 22 DOM
-
2026-06-17days on market $19,999 Active 21 DOM
-
2026-06-16days on market $19,999 Active 20 DOM
-
2026-06-15days on market $19,999 Active 19 DOM
-
2026-06-13days on market $19,999 Active 17 DOM
-
2026-06-13days on market $19,999 Active 16 DOM
-
2026-06-09days on market $19,999 Active 13 DOM
-
2026-06-08days on market $19,999 Active 12 DOM
-
2026-06-07days on market $19,999 Active 11 DOM
-
2026-06-04days on market $19,999 Active 8 DOM
-
2026-06-03days on market $19,999 Active 7 DOM
-
2026-06-02days on market $19,999 Active 6 DOM
-
2026-06-01days on market $19,999 Active 5 DOM
-
2026-05-31days on market $19,999 Active 4 DOM
-
2026-05-27$19,999 Active
-
2024-02-21historical
-
2024-02-02$35,000 Active
ⓘ Source: listings_history table (triggers on properties + properties_extension) + one-shot
backfill from property_details.listing_events for pre-trigger history.
Climate risk First Street
- Flood 8/10 Severe FEMA zone AE · 99% chance over 30 yrs
- Wildfire 5/10 Major
- Heat 8/10 Severe 7 d/yr ≥110°F today · 16 d/yr by 30 yrs out
- Wind 1/10 Low
- Air quality 1/10 Low 0 unhealthy d/yr today · 0 by 30 yrs out
Nearby sold comps map
Loading sold comps map…
Walkable amenities ~0.75 mi
Loading nearby amenities…
Taxation est. · year 1
- Rental income
- $16,701
- − Mortgage interest
- −$1,120
- − Property taxes
- −$300
- − Insurance
- −$5,218
- − Repairs & maintenance
- −$1,336
- − Management
- −$1,336
- − Depreciation
- −$582
- Taxable income
- $6,808
- Est. tax owed @ 24.0%
- −$1,634
- After-tax cash flow
- $4,783/yr
For passive investors: Depreciation is non-cash, so a rental often shows a tax loss while cash-flowing — sheltering income. Rental losses are passive: they offset passive income freely, and up to $25,000/yr can offset ordinary (W-2) income if you actively participate and your MAGI is under $100k (phasing out to $0 by $150k); unused losses carry forward. On sale, claimed depreciation is recaptured at up to 25%, and gains may owe capital-gains tax (a 1031 exchange can defer both). Figures are a year-1 estimate at your 24.0% rate — not tax advice; consult a CPA.
Schools (NCES district)
- District
- Wickenburg Unified District (4236)
- NCES district ID
- 0409190
- Math proficiency
- 33% ▼ -10.00%
- Reading proficiency
- 35% ▼ -7.00%
- Median HH income
- $47,369
- Composite
- 29.27/100
- National rank
- #6560
- State rank
- #92 of 249 in AZ
Livability — Wickenburg
- Score
- 70/100
- State rank
- #41
- US rank
- #7975
Category grades
Schools grade is shown separately in the Schools card above.
Census & demographics
- Census place
- Wickenburg, AZ
- County
- Maricopa County · 4,537,380 people
- City population
- 10,298
- Metro
- Phoenix-Mesa-Chandler, AZ
- Population (ZIP)
- 10,298
- Household income
- $68,591
- Rent vs Own
- Severe rent burden
- 251.0
Population outlook (Maricopa County) Hauer SSP2
- Today (2025)
- 4,979,203 people
- By 2030
- 5,378,229 · +8.0%
- By 2040
- 6,156,598 · +23.6%
- By 2050
- 6,872,376 · +38.0%
- By 2075
- 8,401,270 · +68.7%
- By 2100
- 9,247,439 · +85.7%
Race, ethnicity, and origin ACS 2023
- Neighborhood character
- Predominantly White (88%)
- Race & ethnicity
- White 88% Hispanic / Latino 7% Two or more races 4% Native American 1%
- Hispanic origin (detail)
- Mexican 5%
- Common ancestry
- Portuguese 3% Lithuanian 3% Slovak 2%
- Foreign-born
- 3% · Canada
- Languages at home
- 93% English-only · Spanish 5%
Political lean MEDSL · Maricopa
- 2024 margin
- Toss-up / Even · D 47.7% · R 51.2% · Other 1.1%
- 2008→2024 swing
- +7.1pp toward D · 2008: -10.6pp · 2024: -3.5pp
- All cycles
- 2024: R+3.5 2020: D+2.2 2016: R+3.5 2012: R+12.0 2008: R+10.6
Not yet ingested
- Civics
- —
Market trends
- HPI YoY
- ▼ -66.26%
- Current HPI
- 314.3169
- Rent YoY
- —
- Metro
- Phoenix-Mesa-Chandler, AZ
- State GDP YoY
- ▲ 4.54%
- F500 in state
- 20
Industry mix (Fortune 500 HQ in AZ)
| Industry | F500 HQs | Revenue |
|---|---|---|
| Technology | 2 | $13B |
|
||
| Mining / Metals | 1 | $23B |
|
||
| Environmental Services | 1 | $16B |
|
||
| Metals / Steel | 1 | $14B |
|
||
| Technology Distribution | 1 | $9B |
|
||
| Homebuilding | 1 | $8B |
|
||
Price history
-42.9% since first listed3 events — show timeline
- 2026-05-27 Listed $19,999 ARMLS
- 2024-02-21 Listing Removed — ARMLS
- 2024-02-02 Listed $35,000 ARMLS
Cash-flow waterfall
monthlySold comps — $/sqft
last 12 mo · ≤1 miLoading sold comps…