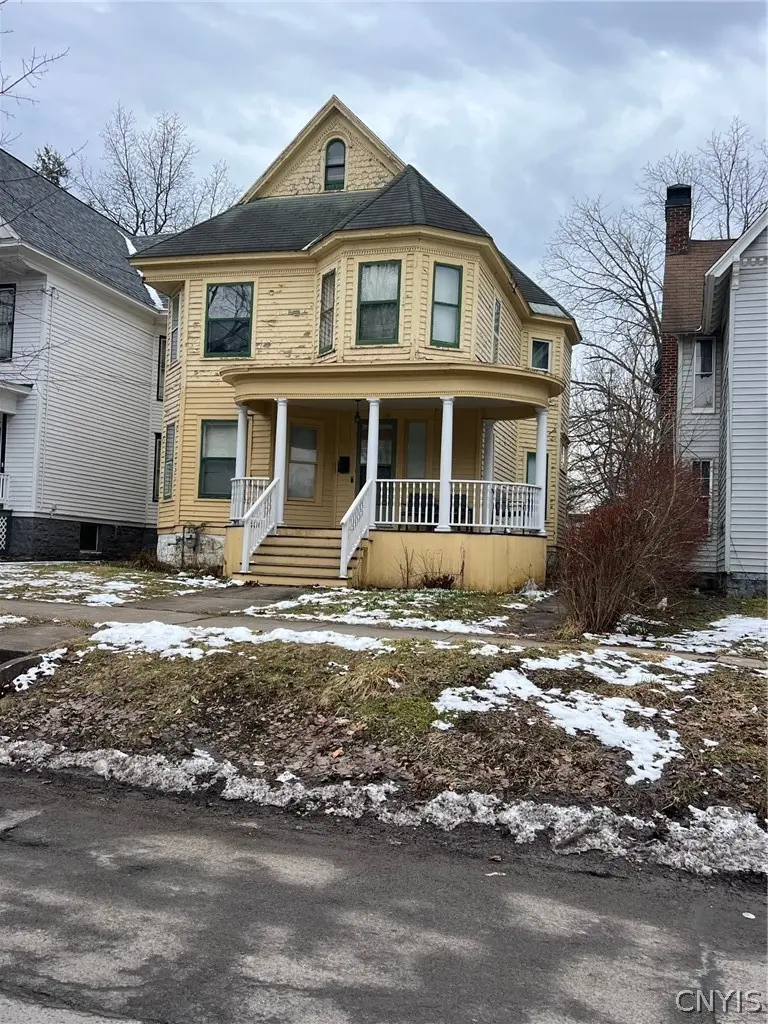
110 Clinton Pl · Utica, NY
Flood risk 1/10 · Minimal
- FEMA flood zone
- X (unshaded)
- Chance of flooding over 30 yrs
- 0.0%
- Est. flood insurance / yr
- $473 – $860
Fire risk 1/10 · Minimal
- Est. fire insurance / yr
- $691 – $1,283
Heat risk 3/10 · Minor
- Hot days now (above 95°F)
- 7 days/yr
- Hot days in 30 yrs
- 16 days/yr
Wind risk 2/10 · Minimal
- Chance of severe wind over 30 yrs
- 1.0%
Air-quality risk 2/10 · Minimal
- Unhealthy air days now
- 0 days/yr
- Unhealthy air days in 30 yrs
- 1 days/yr
Risk factors via First Street. Map © Google.
Why this score? — see what drove the A- grade
The composite is a weighted blend of 9 inputs, each scored 0–100. Each bar is that input's sub-score; the figure is the points it added to the 100-point composite (weight × sub-score).
- Cash flow +29.3/30.0
- ARV discount +12.8/15.0
- DSCR +10.0/10.0
- Appreciation +10.0/10.0
- 1% rule +7.7/10.0
- Livability +4.0/5.0
- Schools +2.9/10.0
- Rent growth +2.5/5.0
- Condition / age +2.5/5.0
$169,000
🖨 Deal sheet 📄 Offer letter ✓ Due diligence
Listing remarks MLS
VERY SPACIOUS 4 BEDROOM HOME/2 FULL BATH HOME OFFERING 2,200 SQUARE FEET OF LIVING SPACES
Key facts
- 7,040 sq ft lot
- 2 garage spots
- Built 1890
Neighborhood map
What this means for you Summary
Snapshot
- This is a 4-bed/1.0-bath single-family listed at $169k.
Deal economics
- At list price, monthly cash flow is $595 ($7k/yr) — positive.
- The deal already cash-flows at list — no discount required.
- Meets the 1% rule at list price ($2k rent vs $169k).
- Recommended offer: $154k (9.0% below list) — sets the bar for market timing.
- Cap rate 10.5% vs local median 7.7% in Utica — top-decile yield for the area; either an underpriced asset or a hidden risk that comps aren't pricing in. Stress-test before assuming the spread holds.
Location & tenants
- Location reads 80/100 on livability (#104 in NY, #1,589 nationally) — a professional / high-income tenant draw. Strengths: commute A+, cost of living A+, housing A+; Watch: employment D, schools D-, crime F.
- Utica City School District (urban): math 33% / reading 38% proficiency, ranked #562 of 590 in NY (top 95%) — families likely to look elsewhere, expect single-tenant / working-renter base with shorter leases; 71% free/reduced lunch — lower-income household profile, screen leases tightly.
- Market conditions: 143 active listings in the ZIP; 3 comparable units currently listed for rent nearby; rentals lingering (median 44d on market — plan ~5-8 weeks vacancy on turnover, expect pricing pressure); 100% of comp listings sitting > 30 days — soft ceiling on asking rent; 204 units permitted in Oneida County in 2024 (68 in 5+ unit buildings).
- At $2,147/mo this rent would consume 49% of the median local household income ($53k/yr) (locally 2251% of renters already pay >50% of income on rent) — very limited rent-growth headroom before tenants either downsize or default.
Forward outlook
- In year one you build about $18k of equity ($1k loan paydown + $17k appreciation (10.0% local appreciation)).
- Oneida County population projected at -12% by 2050 — secular population decline; favor cash flow + early exit over multi-decade hold.
- At projected returns (10.0% appreciation + 3.0% rent growth), your $47k cash investment doubles in ~2 years — after that, you're playing with house money.
- By year 3, paydown + projected appreciation supports a ~$46k cash-out refi (75% LTV) — recoverable capital for the next deal without selling this one.
Negotiation context
- It's been on market 91 days — a 9% lower offer ($154k) is reasonable based on typical stale-listing flexibility.
- 4 sale attempts since 6y ago; this cycle's ask is 6660% above the opening price — seller raised mid-cycle; expect resistance to lowballs.
- Current owner paid $122k; 39% above their basis — modest negotiation headroom, anchor on the comps not their cost.
Risks & watch-outs
- Watch-outs: built in 1890 — expect roof / HVAC / electrical / plumbing capex.
Questions for the listing agent
- It's been on market 91 days. Have you received any prior offers? Is the seller open to a 9% concession, seller financing, or rate buy-down credit?
- Built in 1890 — when were the roof, HVAC, electrical panel, plumbing, and water heater last replaced?
- Why hasn't it sold? Are there any deal-killer items the seller is aware of (foundation, flood, title, zoning, code violations)?
- Is there a deadline driving the sale (1031 exchange, divorce, estate, relocation)? That informs how much negotiation room exists.
- Schools are D-rated, which usually means shorter tenancies and higher turnover. Who's the typical renter profile here, and what's been the actual vacancy rate?
- Crime grade is F in this area — have there been break-ins, vandalism, or insurance claims at this property in the last 3 years? What carrier currently insures it and at what premium?
- What's the average days-on-market for RENTAL listings here right now (not sales)? A rising rental-DOM trend means longer vacancies and softer asking-rent achievability than the comps imply.
- What's the recent tenant-quality profile in this submarket — average credit score on applications, eviction rate, late-payment / NSF rate, and stable-employment percentage? A property-management company in the area should have these aggregated.
- How much new for-sale + rental construction is in the pipeline within 1–3 miles? Heavy new supply typically softens prices + rents 12–24 months out; constrained supply supports both.
Investment metrics
- 1% rule
- 1.27% ✓
- Cap rate
- 10.52%
- Cash-on-cash
- 15.08%
- DSCR
- 1.67
- GRM
- 6.6
CMA / ARV
- ARV (median comp)
- $191,449
- List price
- $169,000
- Delta
- -11.73%
- Verdict
- UNDERPRICED
- Comps
- 20 within 1.0 mi
Show comp detail 12 sales within ~0.75 mi
| Address | Dist | Beds/Ba | Sqft | Sold | Price | $/sf | Match |
|---|---|---|---|---|---|---|---|
| 1548 Kemble St | 0.04mi | 4/2.0 | 1,906 (-10%) | 14mo | $180,200 | $95 | 65 |
| 119 Pleasant St | 0.34mi | 4/1.5 | 1,913 (-10%) | 2mo | $192,500 | $101 | 63 |
| 1808 Storrs Ave | 0.56mi | 4/1.5 | 2,113 (-1%) | 14mo | $190,000 | $90 | 59 |
| 1628 Miller St | 0.43mi | 4/1.0 | 1,900 (-11%) | 7mo | $55,000 | $29 | 56 |
| 1624 Sunset Ave | 0.50mi | 4/2.5 | 2,160 (+2%) | 19mo | $179,900 | $83 | 52 |
| 1420 Lenox Ave | 0.67mi | 5/2.0 (+1) | 2,058 (-3%) | 8mo | $150,000 | $73 | 47 |
| 1645 Bennett St | 0.58mi | 4/2.0 | 2,002 (-6%) | 15mo | $165,000 | $82 | 47 |
| 1547 Sunset Ave | 0.38mi | 3/1.5 (-1) | 1,896 (-11%) | 15mo | $195,000 | $103 | 45 |
| 111 Hobart St | 0.33mi | 5/1.5 (+1) | 1,848 (-13%) | 18mo | $154,000 | $83 | 41 |
| 1904 Holland Ave | 0.65mi | 5/2.0 (+1) | 2,323 (+9%) | 10mo | $197,160 | $85 | 37 |
| 816 Oswego St | 0.46mi | 4/1.0 | 1,808 (-15%) | 21mo | $135,000 | $75 | 36 |
| 1649 Miller St | 0.45mi | 5/1.5 (+1) | 1,870 (-12%) | 19mo | $170,000 | $91 | 36 |
Match score weights: distance 35% · size 25% · config 20% · recency 20%. Top-matched comps best support the ARV.
Projected returns pro-forma
10.0% appreciation · 3.0% rent growth · sell at horizon
- IRR
- 35.4%
- Equity multiple
- 3.75×
- Total profit
- $129,907
- Equity at exit
- $152,249
- IRR
- 30.5%
- Equity multiple
- 8.45×
- Total profit
- $352,754
- Equity at exit
- $328,330
Cash invested: $47,320 (down + closing). Projections, not guarantees.
Landlord ↔ Tenant lean methodology
- Overall (STATE)
- 15 Strongly Tenant-Friendly
- State New York
- 15 Strongly Tenant-Friendly · D+10
- County
- — inherits STATE
- City
- — inherits STATE
ZIP-level market 13501
- Home prices YoY
- 5.6%
- Active inventory
- 143
- Price-to-rent
- 6.6×
Monthly cashflow live
- Estimated rent
- $2,147 medium interval (Pro) →
- Mortgage (P&I)
- −$886
- Tax from tax record
- −$145 /mo · $1,737/yr
- Insurance
- −$70
- HOA
- −$0
- Vacancy / Maint / Mgmt
- −$451
- Net cashflow
- $595
Break-even live
UW: 25.0% down · 7.5% · 30yr · 1.5% tax · 5.0% vac · 8.0% maint · 8.0% mgmt
Financing live
Cash to close
- Down payment
- $42,250
- Closing costs
- $5,070
- Reserves months
- —
- Total cash needed
- —
Loan-product check · same deal, 3 products live
Conventional
25% down · 7.5% · 30yr
- Down + closing
- —
- Monthly P&I
- —
- Monthly cashflow
- —
- DSCR
- —
- Eligible?
- —
Personal DTI + credit; lowest rate.
DSCR
20% down · 8.5% · 30yr
- Down + closing
- —
- Monthly P&I
- —
- Monthly cashflow
- —
- DSCR
- —
- Eligible?
- —
No personal income docs; deal must DSCR.
Hard money
10% down · 12.0% · 12mo
- Down + closing
- —
- Monthly P&I
- —
- Monthly cashflow
- —
- DSCR
- —
- Eligible?
- —
Short-term bridge; refi at stabilization.
Rent comps 3 comps
| Address | Beds | Baths | Sqft | Rent | $/sqft | DOM | Units | Dist |
|---|---|---|---|---|---|---|---|---|
| 1804 Storrs Ave Utica, NY | 3.0 | 1.5 | 1633 | $3,000 | $1.84 | 43d | 1 | 0.57mi |
| 1642 Taylor Ave #1644 Utica, NY | 3.0 | 1.0 | 2600 | $1,650 | $0.63 | 43d | 1 | 0.74mi |
| 807 Eagle St Utica, NY | 3.0 | 1.0 | 1526 | $1,300 | $0.85 | 43d | 1 | 1.29mi |
Listing history 26 events
-
2026-06-19days on market $169,000 Active 91 DOM
-
2026-06-18days on market $169,000 Active 90 DOM
-
2026-06-17days on market $169,000 Active 89 DOM
-
2026-06-16days on market $169,000 Active 88 DOM
-
2026-06-15pricedays on market $169,000 Active 87 DOM
-
2026-06-14days on market $179,000 Active 85 DOM
-
2026-06-13days on market $179,000 Active 84 DOM
-
2026-06-10days on market $179,000 Active 82 DOM
-
2026-06-09days on market $179,000 Active 81 DOM
-
2026-06-08days on market $179,000 Active 80 DOM
-
2026-06-07days on market $179,000 Active 79 DOM
-
2026-06-03days on market $179,000 Active 75 DOM
-
2026-06-02days on market $179,000 Active 74 DOM
-
2026-06-01days on market $179,000 Active 73 DOM
-
2026-05-31days on market $179,000 Active 72 DOM
-
2026-05-30days on market $179,000 Active 71 DOM
-
2026-05-15price $179,000 89-char remark
Show marketing remark (89 chars)
VERY SPACIOUS 4 BEDROOM HOME/2 FULL BATH HOME OFFERING 2,200 SQUARE FEET OF LIVING SPACES
-
2026-04-14historical $2,500
-
2026-03-21$2,500
-
2026-03-20$180,000 Active 89-char remark
Show marketing remark (89 chars)
VERY SPACIOUS 4 BEDROOM HOME/2 FULL BATH HOME OFFERING 2,200 SQUARE FEET OF LIVING SPACES
-
2024-09-04soldstatus $121,900 Closed 617-char remark
Show marketing remark (617 chars)
Here's your chance to own a gracious Queen Anne home in the heart of Utica! Take a look at the floor plans: a pretty entry flows to a double living room with fireplace, then to a formal dining room and a kitchen with a full butler's pantry. Upstairs are 4 bedrooms plus a bright gathering space- perfect for curling up with a good book or a home office. This elegant home also features Rochester hardwood floors throughout and so many lovely period details. And, major renovations done: kitchen, baths and a front porch restoration! Look through the photos and the floor plans and contact your favorite Realtor today!
-
2024-07-01historical Active Under Contract 617-char remark
Show marketing remark (617 chars)
Here's your chance to own a gracious Queen Anne home in the heart of Utica! Take a look at the floor plans: a pretty entry flows to a double living room with fireplace, then to a formal dining room and a kitchen with a full butler's pantry. Upstairs are 4 bedrooms plus a bright gathering space- perfect for curling up with a good book or a home office. This elegant home also features Rochester hardwood floors throughout and so many lovely period details. And, major renovations done: kitchen, baths and a front porch restoration! Look through the photos and the floor plans and contact your favorite Realtor today!
-
2024-06-17$119,900 Active 617-char remark
Show marketing remark (617 chars)
Here's your chance to own a gracious Queen Anne home in the heart of Utica! Take a look at the floor plans: a pretty entry flows to a double living room with fireplace, then to a formal dining room and a kitchen with a full butler's pantry. Upstairs are 4 bedrooms plus a bright gathering space- perfect for curling up with a good book or a home office. This elegant home also features Rochester hardwood floors throughout and so many lovely period details. And, major renovations done: kitchen, baths and a front porch restoration! Look through the photos and the floor plans and contact your favorite Realtor today!
-
2021-01-29soldstatus $52,000
-
2021-01-27soldstatus $52,500
-
2020-09-16$59,000
ⓘ Source: listings_history table (triggers on properties + properties_extension) + one-shot
backfill from property_details.listing_events for pre-trigger history.
Tax reassessment forecast NY · Partial reset (capped growth)
- Current annual tax
- $1,737 · $145/mo
- Projected year-2 tax
- $2,297 · $191/mo
- Expected delta
- +$559/yr (+$47/mo · 32.2%)
ⓘ Screening estimate from a state-policy table — verify with the county assessor before closing.
Climate risk First Street
- Flood 1/10 Low FEMA zone X (unshaded) · 0% chance over 30 yrs
- Wildfire 1/10 Low
- Heat 3/10 Moderate 7 d/yr ≥95°F today · 16 d/yr by 30 yrs out
- Wind 2/10 Low 100% chance of damaging wind over 30 yrs
- Air quality 2/10 Low 0 unhealthy d/yr today · 1 by 30 yrs out
Nearby sold comps map
Loading sold comps map…
Walkable amenities ~0.75 mi
Loading nearby amenities…
Taxation est. · year 1
- Rental income
- $25,764
- − Mortgage interest
- −$9,467
- − Property taxes
- −$1,737
- − Insurance
- −$845
- − Repairs & maintenance
- −$2,061
- − Management
- −$2,061
- − Depreciation
- −$4,916
- Taxable income
- $4,676
- Est. tax owed @ 24.0%
- −$1,122
- After-tax cash flow
- $6,014/yr
For passive investors: Depreciation is non-cash, so a rental often shows a tax loss while cash-flowing — sheltering income. Rental losses are passive: they offset passive income freely, and up to $25,000/yr can offset ordinary (W-2) income if you actively participate and your MAGI is under $100k (phasing out to $0 by $150k); unused losses carry forward. On sale, claimed depreciation is recaptured at up to 25%, and gains may owe capital-gains tax (a 1031 exchange can defer both). Figures are a year-1 estimate at your 24.0% rate — not tax advice; consult a CPA.
Schools (NCES district)
- District
- Utica City School District
- NCES district ID
- 3629370
- Math proficiency
- 33% ▼ -7.00%
- Reading proficiency
- 38% ▲ 2.00%
- Median HH income
- $31,834
- Composite
- 29.01/100
- National rank
- #6613
- State rank
- #562 of 590 in NY
Livability — Utica
- Score
- 80/100
- State rank
- #104
- US rank
- #1589
Category grades
Schools grade is shown separately in the Schools card above.
Census & demographics
- Census place
- Utica, NY
- County
- Oneida County · 89,710 people
- City population
- 72,968
- Metro
- Utica-Rome, NY
- Population (ZIP)
- 38,931
- Household income
- $52,548
- Rent vs Own
- Severe rent burden
- 2251.0
Population outlook (Oneida County) Hauer SSP2
- Today (2025)
- 225,223 people
- By 2030
- 220,384 · -2.1%
- By 2040
- 209,071 · -7.2%
- By 2050
- 197,920 · -12.1%
- By 2075
- 175,541 · -22.1%
- By 2100
- 148,491 · -34.1%
Race, ethnicity, and origin ACS 2023
- Neighborhood character
- Highly diverse neighborhood (Simpson 0.70)
- Race & ethnicity
- White 49% Two or more races 15% Hispanic / Latino 14% Black 14% Asian 14%
- Hispanic origin (detail)
- Puerto Rican 8% Dominican 4%
- Common ancestry
- American 8% Romanian 3% Lithuanian 1%
- Foreign-born
- 25% · Canada, Philippines, Vietnam
- Languages at home
- 62% English-only · Other Asian/Pacific 11% Russian/Polish/Slavic 10% Spanish 9%
Political lean MEDSL · Oneida
- 2024 margin
- Strong R (+21.3) · D 39.4% · R 60.6%
- 2008→2024 swing
- -15.2pp toward R · 2008: -6.1pp · 2024: -21.3pp
- All cycles
- 2024: R+21.3 2020: R+15.5 2016: R+21.1 2012: R+5.3 2008: R+6.1
Not yet ingested
- Civics
- —
Market trends
- HPI YoY
- ▲ 20.28%
- Current HPI
- 382.3726
- Rent YoY
- —
- Metro
- Utica-Rome, NY
- State GDP YoY
- ▲ 2.60%
- F500 in state
- 92
Industry mix (Fortune 500 HQ in NY)
| Industry | F500 HQs | Revenue |
|---|---|---|
| Financial Services | 10 | $950B |
|
||
| Consumer Goods | 9 | $162B |
|
||
| Insurance | 4 | $225B |
|
||
| Telecommunications | 2 | $144B |
|
||
| Pharmaceuticals | 2 | $112B |
|
||
| Media / Entertainment | 2 | $69B |
|
||
Price history
+203.4% since first listed10 events — show timeline
- 2026-05-15 Price Changed $179,000 CNYIS
- 2026-04-14 Rental Removed $2,500 CNYIS
- 2026-03-21 Listed for Rent $2,500 CNYIS
- 2026-03-20 Listed $180,000 CNYIS
- 2024-09-04 Sold (MLS) $121,900 CNYIS
- 2024-07-01 Contingent — CNYIS
- 2024-06-17 Listed $119,900 CNYIS
- 2021-01-29 Sold (Public Records) $52,000 Public Records
- 2021-01-27 Sold (MLS) $52,500 CNYIS
- 2020-09-16 Listed $59,000 CNYIS
Property tax history
+10.7%/yrLatest (2025): $1,737 · +5.6% YoY. Source: county tax records.
Cash-flow waterfall
monthlySold comps — $/sqft
last 12 mo · ≤1 miLoading sold comps…