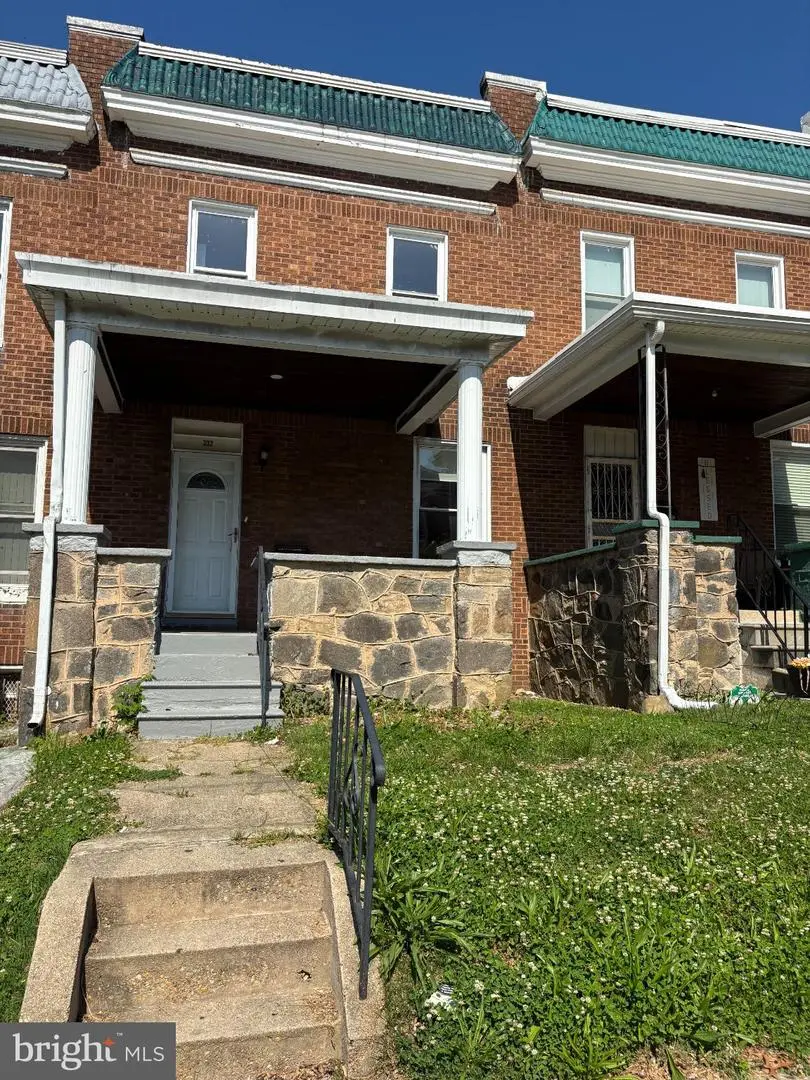
332 Marydell Rd · Baltimore, MD
Flood risk 1/10 · Minimal
- FEMA flood zone
- X (unshaded)
- Chance of flooding over 30 yrs
- 0.0%
- Est. flood insurance / yr
- $473 – $860
Fire risk 1/10 · Minimal
- Est. fire insurance / yr
- $755 – $1,403
Heat risk 7/10 · Major
- Hot days now (above 103°F)
- 7 days/yr
- Hot days in 30 yrs
- 15 days/yr
Wind risk 5/10 · Moderate
- Chance of severe wind over 30 yrs
- 24.0%
Air-quality risk 3/10 · Minor
- Unhealthy air days now
- 3 days/yr
- Unhealthy air days in 30 yrs
- 4 days/yr
Risk factors via First Street. Map © Google.
Why this score? — see what drove the C+ grade
The composite is a weighted blend of 9 inputs, each scored 0–100. Each bar is that input's sub-score; the figure is the points it added to the 100-point composite (weight × sub-score).
- Cash flow +25.2/30.0
- ARV discount +12.7/15.0
- DSCR +8.3/10.0
- 1% rule +6.8/10.0
- Rent growth +3.8/5.0
- Livability +3.8/5.0
- Condition / age +2.5/5.0
- Schools +1.0/10.0
- Appreciation +0.0/10.0
$149,900
🖨 Deal sheet 📄 Offer letter ✓ Due diligence
Listing remarks
Don't miss out on this opportunity! New carpet! New paint! Brand new stainless steel appliances! Large updated kitchen. Lots of natural light shining through. Spacious basement with washer and dryer. Enjoy those warm summer nights on your covered front porch! This home is ready for you to call it yours!
Key facts
- New carpet
- New paint
- Natural light
Tags
Property features AI
Exterior
- Parking: On-street parking
- Utilities: Public water; Public sewer
- Home design: Interior townhouse/rowhouse; Brick construction; Built-Up roof; Fee simple ownership; Year built listed as estimated
- Construction: Brick exterior; Permanent foundation
- Exterior features: Awning(s); Partial fencing; Porch(es)
Interior
- Kitchen: Built-in microwave; Dishwasher; Disposal; Oven/Range - Gas; Refrigerator
- Bedrooms: Three bedrooms on the upper level
- Flooring: Carpet; Hardwood
- Bathrooms: One full bathroom (upper level); One half bathroom (main level)
- Heating & cooling: Forced air heating (natural gas); Central air conditioning (electric); Natural gas hot water
- Interior features: Carpet and wood floors; Full basement; Porches; Awning(s)
- Laundry & utility: Washer and dryer (laundry in basement)
Neighborhood map
What this means for you Summary
Snapshot
- This is a 3-bed/1.5-bath townhouse listed at $150k.
Deal economics
- At list price, monthly cash flow is $338 ($4k/yr) — positive.
- The deal already cash-flows at list — no discount required.
- Meets the 1% rule at list price ($2k rent vs $150k).
- Cap rate 9.0% vs local median 6.0% in Baltimore — top-decile yield for the area; either an underpriced asset or a hidden risk that comps aren't pricing in. Stress-test before assuming the spread holds.
Location & tenants
- Location reads 76/100 on livability (#90 in MD, #3,396 nationally) — a middle-class / working-renter tenant base. Strengths: amenities A+, commute A+, housing A+; Watch: schools D, crime F.
- Baltimore City Public Schools (urban): math 7% / reading 16% proficiency, ranked #24 of 24 in MD (top 100%) — low school quality limits family demand, transient renter base, plan for 1-2y turnover; 79% free/reduced lunch — lower-income household profile, screen leases tightly.
- Market conditions: Rents rising fast (+5.4%/yr); 252 active listings in the ZIP; 40 comparable units currently listed for rent nearby; rentals at typical pace (median 24d on market — plan ~3-4 weeks tenant-placement turnaround); 1,273 units permitted in Baltimore city in 2024 (1,104 in 5+ unit buildings).
- This rent runs 35% of the median local income ($60k/yr) — at the standard rent-burdened threshold; future hikes will face affordability resistance.
Forward outlook
- Local home prices are declining (-3.0%/yr); year-one equity from $1k of loan paydown is wiped out by about $4k of value loss. Plan a longer hold.
- Baltimore County population projected to shrink 4% by 2050 — rents likely to lag national; underwrite the cash flow, not the appreciation.
- At projected returns (-3.0% appreciation + 5.4% rent growth), your $42k cash investment doubles in ~9 years — after that, you're playing with house money.
Negotiation context
- Only 5 days on market — expect competitive offers; lowballing is unlikely to land.
- 10 sale attempts since 25y ago with the ask held roughly flat each time — persistent listings suggest the price (not the market) is what's stuck; bring a comps-based counter.
- Current owner paid $36k; list at $150k implies a 316% gain — meaningful room to come down on a strong offer.
Risks & watch-outs
- Watch-outs: built in 1927 — expect roof / HVAC / electrical / plumbing capex.
- Climate carrying-cost: moderate wind risk, 24% chance of damaging wind over 30y; extreme-heat days projected 7→15/yr by 2055 (HVAC capex compounding) — expect insurance premiums to compound above CPI over the hold.
Questions for the listing agent
- Built in 1927 — when were the roof, HVAC, electrical panel, plumbing, and water heater last replaced?
- Is there a deadline driving the sale (1031 exchange, divorce, estate, relocation)? That informs how much negotiation room exists.
- Schools are D-rated, which usually means shorter tenancies and higher turnover. Who's the typical renter profile here, and what's been the actual vacancy rate?
- Crime grade is F in this area — have there been break-ins, vandalism, or insurance claims at this property in the last 3 years? What carrier currently insures it and at what premium?
- What's the average days-on-market for RENTAL listings here right now (not sales)? A rising rental-DOM trend means longer vacancies and softer asking-rent achievability than the comps imply.
- What's the recent tenant-quality profile in this submarket — average credit score on applications, eviction rate, late-payment / NSF rate, and stable-employment percentage? A property-management company in the area should have these aggregated.
- How much new for-sale + rental construction is in the pipeline within 1–3 miles? Heavy new supply typically softens prices + rents 12–24 months out; constrained supply supports both.
Investment metrics
- 1% rule
- 1.18% ✓
- Cap rate
- 9.00%
- Cash-on-cash
- 9.66%
- DSCR
- 1.43
- GRM
- 7.1
CMA / ARV
- ARV (on-the-fly)
- $169,344
- Comps found
- 12
Show comp detail 12 sales within ~0.75 mi
| Address | Dist | Beds/Ba | Sqft | Sold | Price | $/sf | Match |
|---|---|---|---|---|---|---|---|
| 4413 Parkton St | 0.24mi | 2/1.5 (-1) | 1,120 (-3%) | 3mo | $130,000 | $116 | 77 |
| 48 Hillvale Rd | 0.36mi | 3/1.5 | 1,224 (+6%) | 2mo | $180,000 | $147 | 72 |
| 377 Marydell Rd | 0.09mi | 2/1.0 (-1) | 1,040 (-10%) | 2mo | $145,000 | $139 | 71 |
| 708 Woodington Rd S | 0.39mi | 2/1.5 (-1) | 1,120 (-3%) | 1mo | $100,000 | $89 | 71 |
| 40 Hillvale Rd | 0.34mi | 3/2.0 | 1,224 (+6%) | 1mo | $230,000 | $188 | 71 |
| 5141 Stafford Rd | 0.59mi | 3/1.5 | 1,140 (-1%) | 0mo | $120,100 | $105 | 71 |
| 44 N Athol Ave | 0.44mi | 3/1.0 | 1,224 (+6%) | 3mo | $121,600 | $99 | 64 |
| 5212 Fredcrest Rd | 0.68mi | 3/1.5 | 1,120 (-3%) | 0mo | $195,000 | $174 | 63 |
| 118 Upmanor Rd | 0.51mi | 3/2.0 | 1,024 (-11%) | 2mo | $235,000 | $229 | 54 |
| 642 Queensgate Rd | 0.63mi | 3/2.0 | 1,260 (+9%) | 0mo | $234,444 | $186 | 53 |
| 4865 Melbourne Rd | 0.73mi | 2/2.0 (-1) | 1,232 (+7%) | 2mo | $214,000 | $174 | 45 |
| 21 Monastery Ave S | 0.72mi | 2/1.0 (-1) | 1,320 (+15%) | 3mo | $65,000 | $49 | 33 |
Match score weights: distance 35% · size 25% · config 20% · recency 20%. Top-matched comps best support the ARV.
Projected returns pro-forma
-3.0% appreciation · 5.38% rent growth · sell at horizon
- IRR
- 1.0%
- Equity multiple
- 1.04×
- Total profit
- $1,589
- Equity at exit
- $22,351
- IRR
- 12.9%
- Equity multiple
- 2.14×
- Total profit
- $47,896
- Equity at exit
- $12,961
Cash invested: $41,972 (down + closing). Projections, not guarantees.
Landlord ↔ Tenant lean methodology
- Overall (CITY)
- 12 Strongly Tenant-Friendly
- State Maryland
- 27 Tenant-Leaning · D+14
- County
- — inherits STATE
- City Baltimore
- 12 Strongly Tenant-Friendly · D+58
ZIP-level market 21229
- Rents YoY
- 5.4%
- Active inventory
- 252
- Price-to-rent
- 7.1×
Monthly cashflow live
- Estimated rent
- $1,766 high interval (Pro) →
- Mortgage (P&I)
- −$786
- Tax from tax record
- −$209 /mo · $2,505/yr
- Insurance
- −$62
- HOA
- −$0
- Vacancy / Maint / Mgmt
- −$371
- Net cashflow
- $338
Break-even live
UW: 25.0% down · 7.5% · 30yr · 1.5% tax · 5.0% vac · 8.0% maint · 8.0% mgmt
Financing live
Cash to close
- Down payment
- $37,475
- Closing costs
- $4,497
- Reserves months
- —
- Total cash needed
- —
Loan-product check · same deal, 3 products live
Conventional
25% down · 7.5% · 30yr
- Down + closing
- —
- Monthly P&I
- —
- Monthly cashflow
- —
- DSCR
- —
- Eligible?
- —
Personal DTI + credit; lowest rate.
DSCR
20% down · 8.5% · 30yr
- Down + closing
- —
- Monthly P&I
- —
- Monthly cashflow
- —
- DSCR
- —
- Eligible?
- —
No personal income docs; deal must DSCR.
Hard money
10% down · 12.0% · 12mo
- Down + closing
- —
- Monthly P&I
- —
- Monthly cashflow
- —
- DSCR
- —
- Eligible?
- —
Short-term bridge; refi at stabilization.
Rent comps 40 comps
| Address | Beds | Baths | Sqft | Rent | $/sqft | DOM | Units | Dist |
|---|---|---|---|---|---|---|---|---|
| 19 S Tremont Rd Baltimore, MD | 3.0 | 1.0 | 1350 | $1,850 | $1.37 | 43d | 1 | 0.28mi |
| 402 Colleen Rd Baltimore, MD | 1.0–2.0 | 1.0 | 910 | $1,450 | $1.59 | 2d | 11 | 0.29mi |
| 4301 Parkton St Baltimore, MD | 1.0–3.0 | 1.0 | 730 | $1,550 | $2.12 | 43d | 1 | 0.30mi |
| 4431 Eldone Rd Baltimore, MD | 3.0 | 2.0 | 896 | $2,000 | $2.23 | 24d | 1 | 0.31mi |
| 2 S Tremont Rd Baltimore, MD | 3.0 | 2.0 | 1450 | $1,800 | $1.24 | 11d | 1 | 0.33mi |
| 2 S Tremont Rd Baltimore, MD | 3.0 | 2.0 | 1450 | $1,800 | $1.24 | 24d | 1 | 0.33mi |
| 304 Collins Ave Unit 2 Baltimore, MD | 3.0 | 1.0 | 1016 | $2,100 | $2.07 | 43d | 1 | 0.34mi |
| 500 Lucia Ave Baltimore, MD | 3.0 | 2.0 | 1472 | $2,100 | $1.43 | 16d | 1 | 0.36mi |
| 4601 Pen Lucy Rd Unit 4615-G Baltimore, MD | 2.0 | 1.0 | 798 | $1,200 | $1.50 | 22d | 1 | 0.38mi |
| 2 N Woodington Rd Baltimore, MD | 1.0–2.0 | 1.0 | 738 | $1,335 | $1.81 | 3d | 5 | 0.38mi |
| 2 S Woodington Rd Baltimore, MD | 2.0 | 1.0 | 856 | $1,160 | $1.36 | 14d | 1 | 0.38mi |
| 4601 Pen Lucy Rd Unit 4714-B Baltimore, MD | 2.0 | 1.0 | 730 | $1,205 | $1.65 | 14d | 1 | 0.38mi |
| 4601 Pen Lucy Rd Unit 4718-F Baltimore, MD | 2.0 | 1.0 | 879 | $1,225 | $1.39 | 2d | 1 | 0.38mi |
| 4601 Pen Lucy Rd Unit 103-H Baltimore, MD | 2.0 | 1.0 | 798 | $1,315 | $1.65 | 24d | 1 | 0.38mi |
| 4018 Massachusetts Ave Baltimore, MD | 3.0 | 1.0 | 1050 | $1,400 | $1.33 | 24d | 1 | 0.41mi |
| 212 S Loudon Ave Baltimore, MD | 3.0 | 1.5 | 1310 | $1,550 | $1.18 | 43d | 1 | 0.44mi |
| 738 Yale Ave Baltimore, MD | 2.0 | 1.0 | 1346 | $1,900 | $1.41 | 24d | 1 | 0.47mi |
| 501 Hazlett Ave Baltimore, MD | 2.0–3.0 | 1.5–2.0 | 1044 | $1,879 | $1.80 | 1d | 8 | 0.48mi |
| 114 S Rock Glen Rd Baltimore, MD | 4.0 | 1.5 | 1160 | $2,350 | $2.03 | 12d | 1 | 0.48mi |
| 565 Brisbane Rd Baltimore, MD | 2.0 | 2.0 | 1146 | $1,675 | $1.46 | 24d | 1 | 0.48mi |
| 111 Upmanor Rd Baltimore, MD | 3.0 | 1.5 | 1224 | $2,163 | $1.77 | 43d | 1 | 0.48mi |
| 219 Atholgate Ln Baltimore, MD | 1.0–3.0 | 1.0–1.5 | 814 | $1,500 | $1.84 | 3d | 2 | 0.49mi |
| 586 Lucia Ave Baltimore, MD | 3.0 | 1.5 | 1178 | $2,100 | $1.78 | 18d | 1 | 0.50mi |
| 751 Yale Ave Baltimore, MD | 3.0 | 1.5 | 1024 | $1,750 | $1.71 | 43d | 1 | 0.51mi |
| 627 Lucia Ave Baltimore, MD | 3.0 | 1.0 | 892 | $1,750 | $1.96 | 24d | 1 | 0.55mi |
| 613 S Beechfield Ave Baltimore, MD | 3.0 | 1.5 | 1080 | $1,950 | $1.81 | 43d | 1 | 0.57mi |
| 5147 Frederick Ave Baltimore, MD | 3.0 | 2.0 | 1216 | $1,950 | $1.60 | 3d | 1 | 0.59mi |
| 4520 Scarlet Oak Ln Baltimore, MD | 2.0 | 1.0 | 1025 | $1,500 | $1.46 | 43d | 1 | 0.74mi |
| 131 N Bend Rd Unit 131-1B Baltimore, MD | 2.0 | 1.5 | 910 | $1,225 | $1.35 | 22d | 1 | 0.82mi |
| 5364 Jamestowne Ct Baltimore, MD | 3.0 | 1.0–1.5 | 787 | $1,905 | $2.42 | 4d | 13 | 0.93mi |
| 3607 W Lexington St Baltimore, MD | 3.0 | 2.0 | 1050 | $1,895 | $1.80 | 4d | 1 | 0.94mi |
| 3392 Saint Benedict St Baltimore, MD | 2.0 | 1.0 | 864 | $1,450 | $1.68 | 24d | 1 | 0.97mi |
| 3336 W Caton Ave Baltimore, MD | 3.0 | 2.0 | 1236 | $1,625 | $1.31 | 24d | 1 | 0.97mi |
| 220 Stonecroft Rd Unit 232-I Baltimore, MD | 2.0 | 1.5 | 900 | $1,295 | $1.44 | 18d | 1 | 0.98mi |
| 220 Stonecroft Rd Unit 230-D Baltimore, MD | 2.0 | 1.5 | 900 | $1,395 | $1.55 | 22d | 1 | 0.98mi |
| 3310 Elbert St Baltimore, MD | 2.0 | 1.0 | 920 | $1,550 | $1.68 | 24d | 1 | 1.00mi |
| 3706 W Franklin St Unit 1 Baltimore, MD | 2.0 | 1.0 | 735 | $1,100 | $1.50 | 4d | 1 | 1.00mi |
| 41 N Kossuth St Baltimore, MD | 3.0 | 2.0 | 1216 | $1,800 | $1.48 | 24d | 1 | 1.01mi |
| 4020 Gelston Dr Baltimore, MD | 3.0 | 2.0 | 1270 | $1,875 | $1.48 | 43d | 1 | 1.08mi |
| 405 N Edgewood St Baltimore, MD | 4.0 | 2.0 | 1408 | $2,950 | $2.10 | 4d | 1 | 1.10mi |
Listing history 32 events
-
2026-05-20$149,900 Active
-
2026-03-29historical
-
2025-12-17$140,000 Active
-
2012-06-08historical Withdrawn
-
2012-06-08historical
-
2012-05-30price
-
2012-04-24price
-
2012-04-03Active
-
2012-04-03$119,900
-
2011-07-27soldstatus $36,000
-
2011-07-22soldstatus $27,600 Sold
-
2011-07-22soldstatus $27,600
-
2011-06-22status Contingent (No Kick Out)
-
2011-06-20historical
-
2011-04-26price $75,000
-
2011-02-24price $100,000
-
2010-11-22$125,000 Active
-
2010-11-21$75,000
-
2010-05-27historical
-
2010-05-27historical
-
2009-08-07price
-
2009-03-30
-
2009-03-30$115,000
-
2006-09-15soldstatus $120,000
-
2006-08-10historical
-
2006-06-24$119,900
-
2004-08-12soldstatus $55,000
-
2002-08-21soldstatus $42,000
-
2002-07-19soldstatus $42,000
-
2002-06-14historical
-
2001-12-30$44,900
-
1992-07-15soldstatus $56,500
ⓘ Source: listings_history table (triggers on properties + properties_extension) + one-shot
backfill from property_details.listing_events for pre-trigger history.
Tax reassessment forecast MD · Partial reset (capped growth)
- Current annual tax
- $2,505 · $209/mo
- Projected year-2 tax
- $2,505 · $209/mo
- Expected delta
- $0/yr ($0/mo · 0.0%)
ⓘ Screening estimate from a state-policy table — verify with the county assessor before closing.
Climate risk First Street
- Flood 1/10 Low FEMA zone X (unshaded) · 0% chance over 30 yrs
- Wildfire 1/10 Low
- Heat 7/10 Severe 7 d/yr ≥103°F today · 15 d/yr by 30 yrs out
- Wind 5/10 Major 24% chance of damaging wind over 30 yrs
- Air quality 3/10 Moderate 3 unhealthy d/yr today · 4 by 30 yrs out
Nearby sold comps map
Loading sold comps map…
Walkable amenities ~0.75 mi
Loading nearby amenities…
Taxation est. · year 1
- Rental income
- $21,191
- − Mortgage interest
- −$8,397
- − Property taxes
- −$2,505
- − Insurance
- −$750
- − Repairs & maintenance
- −$1,695
- − Management
- −$1,695
- − Depreciation
- −$4,361
- Taxable income
- $1,788
- Est. tax owed @ 24.0%
- −$429
- After-tax cash flow
- $3,624/yr
For passive investors: Depreciation is non-cash, so a rental often shows a tax loss while cash-flowing — sheltering income. Rental losses are passive: they offset passive income freely, and up to $25,000/yr can offset ordinary (W-2) income if you actively participate and your MAGI is under $100k (phasing out to $0 by $150k); unused losses carry forward. On sale, claimed depreciation is recaptured at up to 25%, and gains may owe capital-gains tax (a 1031 exchange can defer both). Figures are a year-1 estimate at your 24.0% rate — not tax advice; consult a CPA.
Schools (NCES district)
- District
- Baltimore City Public Schools
- NCES district ID
- 2400090
- Math proficiency
- 7% ▼ -9.00%
- Reading proficiency
- 16% ▼ -5.00%
- Median HH income
- $42,108
- Composite
- 10.08/100
- National rank
- #9805
- State rank
- #24 of 24 in MD
Livability — Baltimore
- Score
- 76/100
- State rank
- #90
- US rank
- #3396
Category grades
Schools grade is shown separately in the Schools card above.
Census & demographics
- Census place
- Baltimore, MD
- County
- Baltimore City · 558,601 people
- City population
- 588,727
- Metro
- Baltimore-Columbia-Towson, MD
- Population (ZIP)
- 46,679
- Household income
- $60,047
- Rent vs Own
- Severe rent burden
- 2776.0
Population outlook (Baltimore County) Hauer SSP2
- Today (2025)
- 624,249 people
- By 2030
- 621,541 · -0.4%
- By 2040
- 609,756 · -2.3%
- By 2050
- 597,249 · -4.3%
- By 2075
- 552,236 · -11.5%
- By 2100
- 513,934 · -17.7%
Race, ethnicity, and origin ACS 2023
- Neighborhood character
- Predominantly Black (73%)
- Race & ethnicity
- Black 73% White 15% Hispanic / Latino 6% Two or more races 4% Asian 3%
- Hispanic origin (detail)
- Common ancestry
- Lithuanian 1% Romanian 1% Serbian 1%
- Foreign-born
- 5% · Canada, Philippines
- Languages at home
- 91% English-only · Spanish 4% Other Indo-European 2% Other Asian/Pacific 1%
Political lean MEDSL · Baltimore
- 2024 margin
- Solid D (+73.0) · D 85.2% · R 12.2% · Other 2.6%
- 2008→2024 swing
- -2.5pp toward R · 2008: 75.5pp · 2024: 73.0pp
- All cycles
- 2024: D+73.0 2020: D+76.6 2016: D+74.6 2012: D+76.4 2008: D+75.5
Not yet ingested
- Civics
- —
Market trends
- HPI YoY
- ▼ -259.07%
- Current HPI
- 226.896
- Rent YoY
- ▲ 5.38%
- Metro
- Baltimore-Columbia-Towson, MD
- State GDP YoY
- ▲ 2.97%
- F500 in state
- 12
Industry mix (Fortune 500 HQ in MD)
| Industry | F500 HQs | Revenue |
|---|---|---|
| Aerospace / Defense | 1 | $71B |
|
||
| Utilities | 1 | $25B |
|
||
| Hotels | 1 | $24B |
|
||
| Consumer Goods | 1 | $7B |
|
||
| Real Estate | 1 | $6B |
|
||
| Chemicals | 1 | $2B |
|
||
Price history
+165.3% since first listed32 events — show timeline
- 2026-05-20 Listed $149,900 BRIGHT MLS
- 2026-03-29 Listing Removed — BRIGHT MLS
- 2025-12-17 Listed $140,000 BRIGHT MLS
- 2012-06-08 Delisted — MRIS
- 2012-06-08 Listing Removed — BRIGHT MLS
- 2012-05-30 Price Changed — MRIS
- 2012-04-24 Price Changed — MRIS
- 2012-04-03 Listed — MRIS
- 2012-04-03 Listed $119,900 BRIGHT MLS
- 2011-07-27 Sold (Public Records) $36,000 Public Records
- 2011-07-22 Sold (MLS) $27,600 BRIGHT MLS
- 2011-07-22 Sold (MLS) $27,600 MRIS
- 2011-06-22 Pending — MRIS
- 2011-06-20 Listing Removed — BRIGHT MLS
- 2011-04-26 Price Changed $75,000 MRIS
- 2011-02-24 Price Changed $100,000 MRIS
- 2010-11-22 Listed $125,000 MRIS
- 2010-11-21 Listed $75,000 BRIGHT MLS
- 2010-05-27 Delisted — MRIS
- 2010-05-27 Listing Removed — BRIGHT MLS
- 2009-08-07 Price Changed — MRIS
- 2009-03-30 Listed — MRIS
- 2009-03-30 Listed $115,000 BRIGHT MLS
- 2006-09-15 Sold (MLS) $120,000 MRIS
- 2006-08-10 Delisted — MRIS
- 2006-06-24 Listed $119,900 MRIS
- 2004-08-12 Sold (Public Records) $55,000 Public Records
- 2002-08-21 Sold (Public Records) $42,000 Public Records
- 2002-07-19 Sold (MLS) $42,000 MRIS
- 2002-06-14 Delisted — MRIS
- 2001-12-30 Listed $44,900 MRIS
- 1992-07-15 Sold (Public Records) $56,500 Public Records
Property tax history
+1.7%/yrLatest (2025): $2,505 · +7.4% YoY. Source: county tax records.
Cash-flow waterfall
monthlySold comps — $/sqft
last 12 mo · ≤1 miLoading sold comps…