719 Beck St · Summerville, SC
Flood risk 1/10 · Minimal
- FEMA flood zone
- X (unshaded)
- Chance of flooding over 30 yrs
- 0.0%
- Est. flood insurance / yr
- $507 – $1,088
Fire risk 3/10 · Minor
- Est. fire insurance / yr
- $783 – $1,453
Heat risk 9/10 · Severe
- Hot days now (above 108°F)
- 7 days/yr
- Hot days in 30 yrs
- 17 days/yr
Wind risk 8/10 · Major
- Chance of severe wind over 30 yrs
- 98.0%
Air-quality risk 3/10 · Minor
- Unhealthy air days now
- 3 days/yr
- Unhealthy air days in 30 yrs
- 3 days/yr
Risk factors via First Street. Map © Google.
Why this score? — see what drove the B grade
The composite is a weighted blend of 9 inputs, each scored 0–100. Each bar is that input's sub-score; the figure is the points it added to the 100-point composite (weight × sub-score).
- Cash flow +30.0/30.0
- 1% rule +10.0/10.0
- DSCR +10.0/10.0
- ARV discount +7.5/15.0
- Schools +4.1/10.0
- Rent growth +3.5/5.0
- Livability +3.2/5.0
- Condition / age +2.5/5.0
- Appreciation +0.0/10.0
$67,500
🖨 Deal sheet 📄 Offer letter ✓ Due diligence
Listing remarks
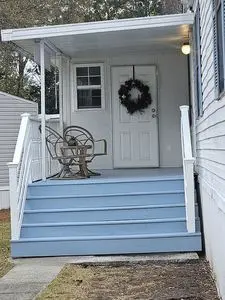
1995 Horton Echo Mobile home for sale in Crestview Mobile Home Park (Aged 55 plus community) located in Summerville, SC. Approx 1400sq feet with attached storage and shed. 3 bedroom, 2 bath furnished. Must be approved by community. Lot rent/HOA is $683/month. Gated entrance, pool, clubhouse and many weekly activities. Clean title. Asking $67,500 obo. As is.
Key facts
- Clubhouse
- Weekly activities
- Gated entrance
Tags
Neighborhood map
What this means for you Summary
Snapshot
- This is a 3-bed/2.0-bath manufactured listed at $68k.
Deal economics
- At list price, monthly cash flow is $1k ($14k/yr) — positive.
- The deal already cash-flows at list — no discount required.
- Meets the 1% rule at list price ($2k rent vs $68k).
- Recommended offer: $65k (3.0% below list) — sets the bar for market timing.
- Cap rate 26.6% vs local median 4.0% in Summerville — top-decile yield for the area; either an underpriced asset or a hidden risk that comps aren't pricing in. Stress-test before assuming the spread holds.
Location & tenants
- Location reads 63/100 on livability (#167 in SC) — a middle-class / working-renter tenant base. Strengths: housing A+, schools B+, cost of living B+; Watch: amenities F, commute F, health & safety F.
- Dorchester 02 (suburban): math 40% / reading 55% proficiency, ranked #12 of 80 in SC (top 15%) — families likely to look elsewhere, expect single-tenant / working-renter base with shorter leases.
- Market conditions: Rents rising (+3.9%/yr); 691 active listings in the ZIP; 39 comparable units currently listed for rent nearby; rentals at typical pace (median 14d on market — plan ~3-4 weeks tenant-placement turnaround); solid renter incomes; 1,199 units permitted in Dorchester County in 2024 (0 in 5+ unit buildings).
Forward outlook
- Local home prices are declining (-3.0%/yr); year-one equity from $467 of loan paydown is wiped out by about $2k of value loss. Plan a longer hold.
- Dorchester County population projected at +43% by 2050 — long-run rental-demand tailwind backs the buy-and-hold thesis.
- At projected returns (-3.0% appreciation + 3.9% rent growth), your $19k cash investment doubles in ~2 years — after that, you're playing with house money.
Negotiation context
- It's been on market 37 days — a 3% lower offer ($65k) is reasonable based on typical stale-listing flexibility.
Risks & watch-outs
- Climate carrying-cost: severe wind risk, 98% chance of damaging wind over 30y; extreme-heat days projected 7→17/yr by 2055 (HVAC capex compounding) — expect insurance premiums to compound above CPI over the hold.
Questions for the listing agent
- It's been on market 37 days. Have you received any prior offers? Is the seller open to a 3% concession, seller financing, or rate buy-down credit?
- Is there a deadline driving the sale (1031 exchange, divorce, estate, relocation)? That informs how much negotiation room exists.
- Schools are B-rated — typically a magnet for longer-tenancy family renters. What's the average tenant stay here, and is there a school-zone premium baked into asking?
- What's the average days-on-market for RENTAL listings here right now (not sales)? A rising rental-DOM trend means longer vacancies and softer asking-rent achievability than the comps imply.
- What's the recent tenant-quality profile in this submarket — average credit score on applications, eviction rate, late-payment / NSF rate, and stable-employment percentage? A property-management company in the area should have these aggregated.
- How much new for-sale + rental construction is in the pipeline within 1–3 miles? Heavy new supply typically softens prices + rents 12–24 months out; constrained supply supports both.
Investment metrics
- 1% rule
- 2.94% ✓
- Cap rate
- 26.57%
- Cash-on-cash
- 72.41%
- DSCR
- 4.22
- GRM
- 2.8
CMA / ARV
No comps found within radius.
Projected returns pro-forma
-3.0% appreciation · 3.93% rent growth · sell at horizon
- IRR
- 73.1%
- Equity multiple
- 4.36×
- Total profit
- $63,575
- Equity at exit
- $10,064
- IRR
- 77.2%
- Equity multiple
- 9.29×
- Total profit
- $156,746
- Equity at exit
- $5,836
Cash invested: $18,900 (down + closing). Projections, not guarantees.
Landlord ↔ Tenant lean methodology
- Overall (STATE)
- 90 Strongly Landlord-Friendly
- State South Carolina
- 90 Strongly Landlord-Friendly · R+6
- County
- — inherits STATE
- City
- — inherits STATE
ZIP-level market 29485
- Rents YoY
- 3.9%
- Active inventory
- 691
- Price-to-rent
- 2.8×
Monthly cashflow live
- Estimated rent
- $1,984 high interval (Pro) →
- Mortgage (P&I)
- −$354
- Tax from tax record
- −$45 /mo · $540/yr
- Insurance
- −$28
- HOA
- −$0
- Vacancy / Maint / Mgmt
- −$417
- Net cashflow
- $1,140
Break-even live
UW: 25.0% down · 7.5% · 30yr · 1.5% tax · 5.0% vac · 8.0% maint · 8.0% mgmt
Financing live
Cash to close
- Down payment
- $16,875
- Closing costs
- $2,025
- Reserves months
- —
- Total cash needed
- —
Loan-product check · same deal, 3 products live
Conventional
25% down · 7.5% · 30yr
- Down + closing
- —
- Monthly P&I
- —
- Monthly cashflow
- —
- DSCR
- —
- Eligible?
- —
Personal DTI + credit; lowest rate.
DSCR
20% down · 8.5% · 30yr
- Down + closing
- —
- Monthly P&I
- —
- Monthly cashflow
- —
- DSCR
- —
- Eligible?
- —
No personal income docs; deal must DSCR.
Hard money
10% down · 12.0% · 12mo
- Down + closing
- —
- Monthly P&I
- —
- Monthly cashflow
- —
- DSCR
- —
- Eligible?
- —
Short-term bridge; refi at stabilization.
Rent comps 39 comps
| Address | Beds | Baths | Sqft | Rent | $/sqft | DOM | Units | Dist |
|---|---|---|---|---|---|---|---|---|
| 451 Martins Creek Blvd Summerville, SC | 3.0 | 2.5 | 1285 | $2,150 | $1.67 | 23d | 1 | 0.21mi |
| 463 Martins Creek Blvd Summerville, SC | 3.0 | 2.5 | 1285 | $2,050 | $1.60 | 2d | 1 | 0.22mi |
| 465 Martins Creek Blvd Summerville, SC | 3.0 | 2.5 | 1285 | $2,050 | $1.60 | 2d | 1 | 0.22mi |
| 467 Martins Creek Blvd Summerville, SC | 3.0 | 2.5 | 1285 | $2,050 | $1.60 | 2d | 1 | 0.23mi |
| 305 Chessington Cir Summerville, SC | 3.0 | 2.0 | 1472 | $1,995 | $1.36 | 10d | 1 | 0.27mi |
| 700 Martins Creek Blvd Summerville, SC | 1.0–2.0 | 1.0–2.0 | 895 | $1,673 | $1.87 | 2d | 20 | 0.28mi |
| 136 Susan Dr Unit A Summerville, SC | 2.0 | 1.5 | 922 | $1,495 | $1.62 | 2d | 1 | 0.47mi |
| 137 Susan Dr Unit A Summerville, SC | 2.0 | 1.5 | 922 | $1,400 | $1.52 | 23d | 1 | 0.49mi |
| 137 Susan Dr Unit B Summerville, SC | 3.0 | 2.5 | 1300 | $1,550 | $1.19 | 23d | 1 | 0.49mi |
| 137 Susan Dr Summerville, SC | 3.0 | 3.0 | 1300 | $1,550 | $1.19 | 23d | 1 | 0.49mi |
| 109 Terry Ave Summerville, SC | 3.0 | 2.0 | 1450 | $2,061 | $1.42 | 18d | 1 | 0.58mi |
| 163 Rosefield Ct Summerville, SC | 3.0 | 2.5 | 1436 | $2,000 | $1.39 | 23d | 1 | 0.69mi |
| 101 Bridge Pointe Ln Summerville, SC | 3.0 | 3.0 | 1668 | $2,267 | $1.36 | 14d | 1 | 0.81mi |
| 101 Bridge Pointe Ln Summerville, SC | 2.0 | 3.0 | 1181 | $2,040 | $1.73 | 23d | 1 | 0.81mi |
| 101 Bridge Pointe Ln Summerville, SC | 2.0 | 2.0 | 1154 | $1,598 | $1.38 | 2d | 1 | 0.81mi |
| 226 Saint Catherines CT Summerville, SC | 2.0–3.0 | 2.5 | 1421 | $2,275 | $1.60 | 2d | 8 | 0.82mi |
| 1425 Old Trolley Rd Summerville, SC | 1.0–2.0 | 1.0–2.0 | 875 | $1,631 | $1.86 | 2d | 10 | 0.91mi |
| 124 Miley Dr Summerville, SC | 3.0 | 2.0 | 1460 | $1,900 | $1.30 | 23d | 1 | 0.91mi |
| 300 Miles Jamison Rd Summerville, SC | 2.0 | 1.5 | 1200 | $1,425 | $1.19 | 23d | 1 | 0.92mi |
| 117 Lynches River Dr Summerville, SC | 3.0 | 2.5 | 1470 | $1,999 | $1.36 | 23d | 1 | 0.97mi |
| 1 Bosquet Ct Summerville, SC | 1.0–3.0 | 1.0–1.5 | 940 | $1,823 | $1.94 | 2d | 15 | 1.03mi |
| 211 Congaree River Dr Summerville, SC | 3.0 | 2.5 | 1650 | $2,995 | $1.82 | 23d | 1 | 1.04mi |
| 160 Wainwright Mnr Summerville, SC | 3.0 | 2.5 | 1867 | $2,500 | $1.34 | 23d | 1 | 1.13mi |
| 202 Seneca River Dr Summerville, SC | 3.0 | 2.5 | 1680 | $2,295 | $1.37 | 11d | 1 | 1.24mi |
| 112 Stewart Pl Summerville, SC | 2.0 | 2.0 | 979 | $1,700 | $1.74 | 23d | 1 | 1.26mi |
| 950 Travelers Blvd Summerville, SC | 2.0 | 1.0 | 695 | $1,509 | $2.17 | 2d | 4 | 1.29mi |
| 106 Kimeran Ln Summerville, SC | 2.0 | 1.5 | 1000 | $1,350 | $1.35 | 18d | 1 | 1.41mi |
| 101 Timber Ln Unit C Summerville, SC | 2.0 | 1.5 | 1000 | $1,375 | $1.38 | 23d | 1 | 1.42mi |
| 903 Peacock Pl Unit 1 Summerville, SC | 3.0 | 2.0 | 1156 | $1,850 | $1.60 | 11d | 1 | 1.42mi |
| 903 Peacock Pl Unit 1 Summerville, SC | 3.0 | 2.0 | 1156 | $1,850 | $1.60 | 23d | 1 | 1.42mi |
| 125 Tiffany Ln Summerville, SC | 4.0 | 2.0 | 1365 | $2,000 | $1.47 | 2d | 1 | 1.43mi |
| 114 Jedi Ln Unit A Summerville, SC | 3.0 | 2.0 | 1200 | $1,695 | $1.41 | 2d | 1 | 1.44mi |
| 328 Seneca River Dr Summerville, SC | 3.0 | 2.0 | 1270 | $2,000 | $1.57 | 2d | 1 | 1.45mi |
| 101 Langley Dr Unit C Summerville, SC | 3.0 | 2.5 | 1315 | $1,800 | $1.37 | 2d | 1 | 1.46mi |
| 101 Langley Dr Unit C Summerville, SC | 3.0 | 2.5 | 1320 | $1,800 | $1.36 | 23d | 1 | 1.46mi |
| 1925 Bacons Bridge Rd Summerville, SC | 3.0 | 2.0 | 1152 | $1,524 | $1.32 | 2d | 1 | 1.46mi |
| 101 Langley Dr Unit D Summerville, SC | 3.0 | 2.5 | 1315 | $1,900 | $1.44 | 23d | 1 | 1.46mi |
| 325 Midland Pkwy Summerville, SC | 1.0–3.0 | 1.0–2.0 | 1040 | $2,039 | $1.96 | 2d | 21 | 1.46mi |
| 236 Spencer Cir Summerville, SC | 4.0 | 3.0 | 1542 | $2,225 | $1.44 | 23d | 1 | 1.50mi |
Listing history 14 events
-
2026-06-18days on market $67,500 Active 37 DOM
-
2026-06-17days on market $67,500 Active 36 DOM
-
2026-06-16days on market $67,500 Active 35 DOM
-
2026-06-15days on market $67,500 Active 34 DOM
-
2026-06-13days on market $67,500 Active 32 DOM
-
2026-06-13days on market $67,500 Active 31 DOM
-
2026-06-10days on market $67,500 Active 29 DOM
-
2026-06-09days on market $67,500 Active 28 DOM
-
2026-06-08days on market $67,500 Active 27 DOM
-
2026-06-07days on market $67,500 Active 26 DOM
-
2026-06-03days on market $67,500 Active 22 DOM
-
2026-06-01days on market $67,500 Active 20 DOM
-
2026-05-31days on market $67,500 Active 19 DOM
-
2026-05-12$67,500 Active
ⓘ Source: listings_history table (triggers on properties + properties_extension) + one-shot
backfill from property_details.listing_events for pre-trigger history.
Tax reassessment forecast SC · Resets to sale price
- Current annual tax
- $540 · $45/mo
- Projected year-2 tax
- $540 · $45/mo
- Expected delta
- $0/yr ($0/mo · 0.0%)
ⓘ Screening estimate from a state-policy table — verify with the county assessor before closing.
Climate risk First Street
- Flood 1/10 Low FEMA zone X (unshaded) · 0% chance over 30 yrs
- Wildfire 3/10 Moderate
- Heat 9/10 Extreme 7 d/yr ≥108°F today · 17 d/yr by 30 yrs out
- Wind 8/10 Severe 98% chance of damaging wind over 30 yrs
- Air quality 3/10 Moderate 3 unhealthy d/yr today · 3 by 30 yrs out
Nearby sold comps map
Loading sold comps map…
Walkable amenities ~0.75 mi
Loading nearby amenities…
Taxation est. · year 1
- Rental income
- $23,810
- − Mortgage interest
- −$3,781
- − Property taxes
- −$540
- − Insurance
- −$338
- − Repairs & maintenance
- −$1,905
- − Management
- −$1,905
- − Depreciation
- −$1,964
- Taxable income
- $13,378
- Est. tax owed @ 24.0%
- −$3,211
- After-tax cash flow
- $10,474/yr
For passive investors: Depreciation is non-cash, so a rental often shows a tax loss while cash-flowing — sheltering income. Rental losses are passive: they offset passive income freely, and up to $25,000/yr can offset ordinary (W-2) income if you actively participate and your MAGI is under $100k (phasing out to $0 by $150k); unused losses carry forward. On sale, claimed depreciation is recaptured at up to 25%, and gains may owe capital-gains tax (a 1031 exchange can defer both). Figures are a year-1 estimate at your 24.0% rate — not tax advice; consult a CPA.
Schools (NCES district)
- District
- Dorchester 02
- NCES district ID
- 4502010
- Math proficiency
- 40% ▼ -13.00%
- Reading proficiency
- 55% ▼ -4.00%
- Median HH income
- $57,937
- Composite
- 41.41/100
- National rank
- #3475
- State rank
- #12 of 80 in SC
Livability — Summerville
- Score
- 63/100
- State rank
- #167
- US rank
- #15058
Category grades
Schools grade is shown separately in the Schools card above.
Census & demographics
- Census place
- Summerville, SC
- County
- Dorchester County · 182,866 people
- City population
- 171,668
- Metro
- Charleston-North Charleston, SC
- Population (ZIP)
- 58,507
- Household income
- $82,987
- Rent vs Own
- Severe rent burden
- 1302.0
Population outlook (Dorchester County) Hauer SSP2
- Today (2025)
- 186,982 people
- By 2030
- 203,967 · +9.1%
- By 2040
- 237,160 · +26.8%
- By 2050
- 267,479 · +43.1%
- By 2075
- 333,025 · +78.1%
- By 2100
- 366,560 · +96.0%
Race, ethnicity, and origin ACS 2023
- Neighborhood character
- Diverse neighborhood (Simpson 0.57)
- Race & ethnicity
- White 61% Black 23% Hispanic / Latino 7% Two or more races 7% Asian 3% Pacific Islander 2%
- Hispanic origin (detail)
- Mexican 4% Puerto Rican 1%
- Common ancestry
- Slovak 3% Italian 2% Lithuanian 2%
- Foreign-born
- 7% · Canada, China, Vietnam
- Languages at home
- 92% English-only · Spanish 4% Chinese 1% Russian/Polish/Slavic 1%
Political lean MEDSL · Dorchester
- 2024 margin
- R (+14.6) · D 41.8% · R 56.4% · Other 1.9%
- 2008→2024 swing
- +0.9pp no change · 2008: -15.5pp · 2024: -14.6pp
- All cycles
- 2024: R+14.6 2020: R+10.5 2016: R+17.5 2012: R+16.0 2008: R+15.5
Not yet ingested
- Civics
- —
Market trends
- HPI YoY
- ▼ -305.43%
- Current HPI
- 210.8607
- Rent YoY
- ▲ 3.93%
- Metro
- Charleston-North Charleston, SC
- State GDP YoY
- ▲ 4.51%
- F500 in state
- 2
Industry mix (Fortune 500 HQ in SC)
| Industry | F500 HQs | Revenue |
|---|---|---|
| Packaging | 1 | $7B |
|
||
Price history
1 event — show timeline
- 2026-05-12 Listed $67,500 FSBO.com
Property tax history
+1.5%/yrLatest (2017): $540 · +3.8% YoY. Source: county tax records.
Cash-flow waterfall
monthlySold comps — $/sqft
last 12 mo · ≤1 miLoading sold comps…