5115 Del Monte Dr Unit 4/D · Houston, TX
Flood risk 5/10 · Moderate
- FEMA flood zone
- X (unshaded)
- Chance of flooding over 30 yrs
- 0.65%
- Est. flood insurance / yr
- $507 – $1,088
Fire risk 1/10 · Minimal
- Est. fire insurance / yr
- $1,222 – $2,270
Heat risk 9/10 · Severe
- Hot days now (above 109°F)
- 7 days/yr
- Hot days in 30 yrs
- 24 days/yr
Wind risk 9/10 · Severe
- Chance of severe wind over 30 yrs
- 99.0%
Air-quality risk 2/10 · Minimal
- Unhealthy air days now
- 2 days/yr
- Unhealthy air days in 30 yrs
- 2 days/yr
Risk factors via First Street. Map © Google.
Why this score? — see what drove the C- grade
The composite is a weighted blend of 9 inputs, each scored 0–100. Each bar is that input's sub-score; the figure is the points it added to the 100-point composite (weight × sub-score).
- Cash flow +18.9/30.0
- ARV discount +10.9/15.0
- DSCR +5.9/10.0
- 1% rule +5.7/10.0
- Condition / age +4.0/5.0
- Livability +3.7/5.0
- Schools +2.7/10.0
- Rent growth +2.1/5.0
- Appreciation +0.0/10.0
$259,000
🖨 Deal sheet 📄 Offer letter ✓ Due diligence
Listing remarks MLS
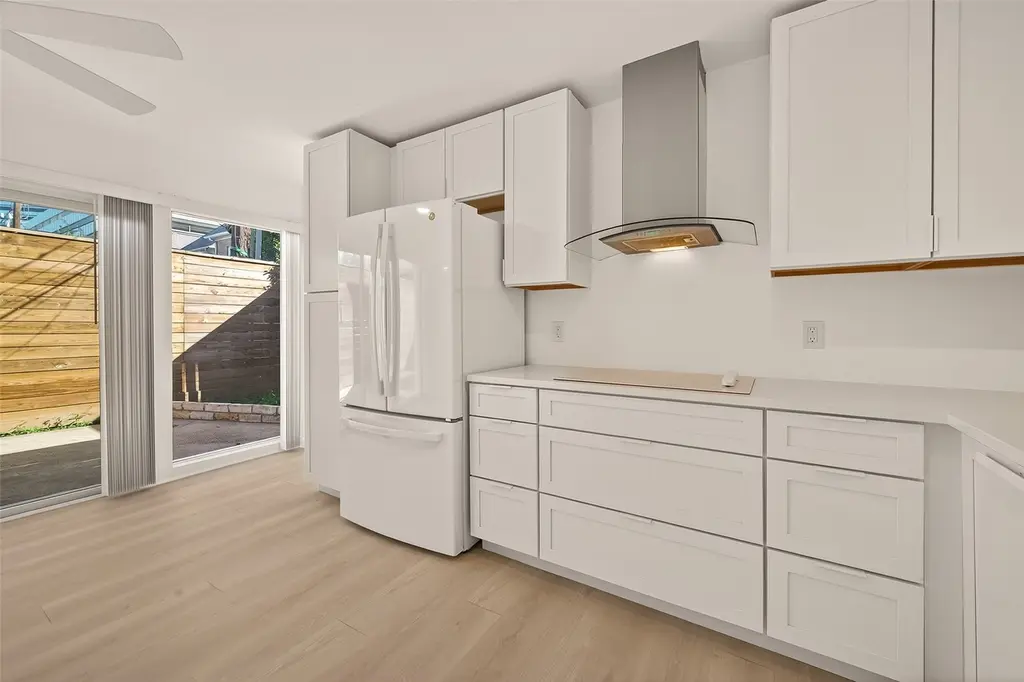
This hidden 3-Bedroom gem at a Mid- Century Modern building located two blocks north of the Galleria Mall has been FULLY REMODELED including: NEW A/C/Hi-Eff Heat Pump, new Plumbing fixtures, new Electrical, and recently new Roof!. Also new kitchen appliances, new bathroom fixtures, and new washer/dryer. First floor open plan living room/ dining area, kitchen, and powder room, lots of natural light throughout overlooking spacious patio with planting area and private gate. Conveniently located to Galleria Area schools, restaurants, stores, grocery stores,pharmacy, office buildings, and more! *Measurements/dimensions can be verified by the buyer. Schedule you private tour today!
Key facts
- Fully remodeled
- New electrical
- New roof
Tags
Neighborhood map
What this means for you Summary
Snapshot
- This is a 3-bed/1.5-bath condo listed at $259k. Condition is rated good.
Deal economics
- At list price, monthly cash flow is $264 ($3k/yr) — positive.
- The deal already cash-flows at list — no discount required.
- Meets the 1% rule at list price ($3k rent vs $259k).
- Recommended offer: $236k (9.0% below list) — sets the bar for market timing.
- Cap rate 7.5% vs local median 3.2% in Houston — top-decile yield for the area; either an underpriced asset or a hidden risk that comps aren't pricing in. Stress-test before assuming the spread holds.
Location & tenants
- Location reads 74/100 on livability (#184 in TX, #4,771 nationally) — a middle-class / working-renter tenant base. Strengths: amenities A+, cost of living A+, housing A+; Watch: schools D, crime F.
- Houston ISD (urban): math 27% / reading 35% proficiency, ranked #593 of 826 in TX (top 72%) — families likely to look elsewhere, expect single-tenant / working-renter base with shorter leases; 71% free/reduced lunch — lower-income household profile, screen leases tightly.
- Market conditions: Rents soft (-1.7%/yr); 313 active listings in the ZIP; 40 comparable units currently listed for rent nearby; rentals leasing fast (median 8d on market — plan ~1-2 weeks tenant-placement turnaround); solid renter incomes; 29,883 units permitted in Harris County in 2024 (8,621 in 5+ unit buildings).
- This rent runs 36% of the median local income ($93k/yr) — at the standard rent-burdened threshold; future hikes will face affordability resistance.
Forward outlook
- Local home prices are declining (-3.0%/yr); year-one equity from $2k of loan paydown is wiped out by about $8k of value loss. Plan a longer hold.
- Harris County population projected at +47% by 2050 — long-run rental-demand tailwind backs the buy-and-hold thesis.
Negotiation context
- It's been on market 108 days — a 9% lower offer ($236k) is reasonable based on typical stale-listing flexibility.
- 2 sale attempts; this cycle's ask has dropped $18k (6%) from the opening price — seller is motivated, your offer sets the floor, not the list.
Risks & watch-outs
- Climate carrying-cost: moderate flood risk; severe wind risk, 99% chance of damaging wind over 30y; extreme-heat days projected 7→24/yr by 2055 (HVAC capex compounding) — expect insurance premiums to compound above CPI over the hold.
Questions for the listing agent
- It's been on market 108 days. Have you received any prior offers? Is the seller open to a 9% concession, seller financing, or rate buy-down credit?
- Built in 1964 — when were the roof, HVAC, electrical panel, plumbing, and water heater last replaced?
- What does the HOA fee cover, when was the last increase, and are there any pending special assessments or reserve-fund shortfalls?
- Any open or pending special assessments — roof, HVAC, plumbing, elevator, façade? What's the per-unit balance and payoff schedule, and is the seller paying it off at close or rolling it to the buyer?
- Why hasn't it sold? Are there any deal-killer items the seller is aware of (foundation, flood, title, zoning, code violations)?
- Is there a deadline driving the sale (1031 exchange, divorce, estate, relocation)? That informs how much negotiation room exists.
- Schools are D-rated, which usually means shorter tenancies and higher turnover. Who's the typical renter profile here, and what's been the actual vacancy rate?
- Crime grade is F in this area — have there been break-ins, vandalism, or insurance claims at this property in the last 3 years? What carrier currently insures it and at what premium?
- What's the average days-on-market for RENTAL listings here right now (not sales)? A rising rental-DOM trend means longer vacancies and softer asking-rent achievability than the comps imply.
- What's the recent tenant-quality profile in this submarket — average credit score on applications, eviction rate, late-payment / NSF rate, and stable-employment percentage? A property-management company in the area should have these aggregated.
- How much new apartment / multifamily construction is in the pipeline within 1–3 miles? Heavy new supply (>2% of stock underway) typically softens rents 12–24 months out; light construction supports rent growth.
Investment metrics
- 1% rule
- 1.07% ✓
- Cap rate
- 7.52%
- Cash-on-cash
- 4.37%
- DSCR
- 1.19
- GRM
- 7.8
CMA / ARV
- ARV (median comp)
- $280,210
- List price
- $259,000
- Delta
- -7.57%
- Verdict
- FAIR
- Comps
- 20 within 1.0 mi
Projected returns pro-forma
-3.0% appreciation · 0.0% rent growth · sell at horizon
- IRR
- -13.1%
- Equity multiple
- 0.54×
- Total profit
- $-33,165
- Equity at exit
- $38,618
- IRR
- -10.1%
- Equity multiple
- 0.47×
- Total profit
- $-38,168
- Equity at exit
- $22,394
Cash invested: $72,520 (down + closing). Projections, not guarantees.
Landlord ↔ Tenant lean methodology
- Overall (STATE)
- 87 Strongly Landlord-Friendly
- State Texas
- 87 Strongly Landlord-Friendly · R+5
- County
- — inherits STATE
- City
- — inherits STATE
ZIP-level market 77056
- Rents YoY
- -1.7%
- Active inventory
- 313
- Price-to-rent
- 7.8×
Monthly cashflow live
- Estimated rent
- $2,778 high interval (Pro) →
- Mortgage (P&I)
- −$1,358
- Tax est. 1.5%
- −$324 /mo · $3,885/yr
- Insurance
- −$108
- HOA
- −$141
- Vacancy / Maint / Mgmt
- −$583
- Net cashflow
- $264
Break-even live
UW: 25.0% down · 7.5% · 30yr · 1.5% tax · 5.0% vac · 8.0% maint · 8.0% mgmt
Financing live
Cash to close
- Down payment
- $64,750
- Closing costs
- $7,770
- Reserves months
- —
- Total cash needed
- —
Loan-product check · same deal, 3 products live
Conventional
25% down · 7.5% · 30yr
- Down + closing
- —
- Monthly P&I
- —
- Monthly cashflow
- —
- DSCR
- —
- Eligible?
- —
Personal DTI + credit; lowest rate.
DSCR
20% down · 8.5% · 30yr
- Down + closing
- —
- Monthly P&I
- —
- Monthly cashflow
- —
- DSCR
- —
- Eligible?
- —
No personal income docs; deal must DSCR.
Hard money
10% down · 12.0% · 12mo
- Down + closing
- —
- Monthly P&I
- —
- Monthly cashflow
- —
- DSCR
- —
- Eligible?
- —
Short-term bridge; refi at stabilization.
Rent comps 40 comps
| Address | Beds | Baths | Sqft | Rent | $/sqft | DOM | Units | Dist |
|---|---|---|---|---|---|---|---|---|
| 1770 S Post Oak Ln Unit 1793 Houston, TX | 2.0 | 2.0 | 1328 | $3,417 | $2.57 | 11d | 1 | 0.11mi |
| 1770 S Post Oak Ln Unit 2162 Houston, TX | 2.0 | 2.0 | 1328 | $3,393 | $2.55 | 5d | 1 | 0.11mi |
| 1770 S Post Oak Ln Unit 422 Houston, TX | 2.0 | 2.0 | 1328 | $3,393 | $2.55 | 7d | 1 | 0.11mi |
| 1770 S Post Oak Ln Unit 425 Houston, TX | 2.0 | 2.0 | 1328 | $3,385 | $2.55 | 3d | 1 | 0.11mi |
| 2300 McCue Rd Houston, TX | 1.0–2.0 | 1.0–2.0 | 1007 | $1,788 | $1.77 | 2d | 19 | 0.12mi |
| 1750 Sky Lark Ln Unit 2162 Houston, TX | 2.0 | 2.0 | 1361 | $3,066 | $2.25 | 5d | 1 | 0.14mi |
| 1750 Sky Lark Ln Unit 422 Houston, TX | 2.0 | 2.0 | 1361 | $3,066 | $2.25 | 7d | 1 | 0.14mi |
| 1750 Sky Lark Ln Unit 2187 Houston, TX | 2.0 | 2.0 | 1361 | $3,058 | $2.25 | 3d | 1 | 0.14mi |
| 1750 Sky Lark Ln Unit 1773 Houston, TX | 2.0 | 2.0 | 1361 | $3,090 | $2.27 | 11d | 1 | 0.15mi |
| 2306 McCue Rd Houston, TX | 1.0–2.0 | 1.0–2.0 | 907 | $1,650 | $1.82 | 2d | 5 | 0.18mi |
| 2323 McCue Rd Houston, TX | 3.0 | 1.0–3.0 | 1540 | $4,850 | $3.15 | 1d | 16 | 0.21mi |
| 2345 Sage Rd Houston, TX | 1.0–3.0 | 1.0–3.0 | 1203 | $2,520 | $2.09 | 2d | 39 | 0.23mi |
| 1919 Post Oak Blvd Unit 104 Houston, TX | 2.0 | 2.0 | 1322 | $2,100 | $1.59 | 43d | 1 | 0.25mi |
| 2525 McCue Rd Houston, TX | 1.0–3.0 | 1.0–2.0 | 1035 | $2,507 | $2.42 | 2d | 22 | 0.25mi |
| 1901 Post Oak Blvd Houston, TX | 1.0–3.0 | 1.0–3.5 | 1342 | $5,450 | $4.06 | 44d | 11 | 0.28mi |
| 1901 Post Oak Blvd Houston, TX | 1.0–3.0 | 1.0–3.5 | 1342 | $5,450 | $4.06 | 43d | 10 | 0.28mi |
| 1697 Sage Rd Unit APO2 Houston, TX | 2.0 | 2.0 | 1209 | $3,650 | $3.02 | 24d | 1 | 0.28mi |
| 1697 Sage Rd Houston, TX | 2.0 | 2.0 | 1209 | $3,650 | $3.02 | 18d | 1 | 0.28mi |
| 2425 Sage Rd Houston, TX | 1.0–3.0 | 1.0–2.0 | 1050 | $1,485 | $1.41 | 1d | 18 | 0.31mi |
| 1901 Post Oak Blvd Unit 112 Houston, TX | 2.0 | 2.0 | 1302 | $1,925 | $1.48 | 43d | 1 | 0.31mi |
| 1901 Post Oak Blvd Unit 2258 Houston, TX | 2.0 | 2.0 | 1384 | $1,985 | $1.43 | 43d | 1 | 0.31mi |
| 1616 Post Oak Blvd Unit 2162 Houston, TX | 2.0 | 2.0 | 1317 | $3,769 | $2.86 | 5d | 1 | 0.33mi |
| 1616 Post Oak Blvd Unit 2187 Houston, TX | 2.0 | 2.0 | 1317 | $3,761 | $2.86 | 3d | 1 | 0.33mi |
| 1616 Post Oak Blvd Unit 421 Houston, TX | 2.0 | 2.0 | 1317 | $3,769 | $2.86 | 7d | 1 | 0.34mi |
| 1616 Post Oak Blvd Unit 1639 Houston, TX | 2.0 | 2.0 | 1317 | $3,793 | $2.88 | 11d | 1 | 0.34mi |
| 1616 Post Oak Blvd Houston, TX | 2.0 | 2.0 | 1209 | $3,650 | $3.02 | 43d | 1 | 0.35mi |
| 1900 Yorktown St Houston, TX | 1.0–2.0 | 1.0–2.0 | 1102 | $2,665 | $2.42 | 3d | 14 | 0.37mi |
| 2541 Sage Rd Houston, TX | 3.0 | 2.0 | 1290 | $1,480 | $1.15 | 12d | 1 | 0.38mi |
| 2541 Sage Rd Houston, TX | 2.0 | 2.0 | 1226 | $1,190 | $0.97 | 20d | 1 | 0.38mi |
| 2541 Sage Rd Houston, TX | 3.0 | 2.0 | 1290 | $1,480 | $1.15 | 22d | 1 | 0.38mi |
| 2531 McCue Rd Unit 136 Houston, TX | 2.0 | 2.0 | 1027 | $1,780 | $1.73 | 43d | 1 | 0.39mi |
| 2400 Yorktown St Houston, TX | 1.0–3.0 | 1.0–2.0 | 1032 | $1,619 | $1.57 | 1d | 38 | 0.42mi |
| 2400 Yorktown Dr Unit 2187 Houston, TX | 2.0 | 2.0 | 1050 | $976 | $0.93 | 3d | 1 | 0.42mi |
| 2400 Yorktown Dr Unit 2162 Houston, TX | 2.0 | 2.0 | 1050 | $984 | $0.94 | 5d | 1 | 0.42mi |
| 2400 Yorktown Dr Unit 3187 Houston, TX | 3.0 | 2.0 | 1385 | $1,478 | $1.07 | 3d | 1 | 0.42mi |
| 2400 Yorktown Dr Unit 2433 Houston, TX | 3.0 | 2.0 | 1385 | $1,510 | $1.09 | 11d | 1 | 0.42mi |
| 2400 Yorktown Dr Unit 421 Houston, TX | 2.0 | 2.0 | 1050 | $984 | $0.94 | 7d | 1 | 0.42mi |
| 2406 Yorktown St Houston, TX | 2.0 | 2.0 | 1050 | $1,500 | $1.43 | 19d | 1 | 0.44mi |
| 2406 Yorktown St Houston, TX | 2.0 | 2.0 | 1050 | $1,500 | $1.43 | 13d | 1 | 0.44mi |
| 2406 Yorktown St Houston, TX | 3.0 | 2.0 | 1385 | $1,662 | $1.20 | 20d | 1 | 0.44mi |
HOA detail condo
- Monthly dues
- $141 · $1,692/yr
- Likely covers
- electric
- Assessments
- None detected in remarks — confirm with the listing agent.
Listing history 14 events
-
2026-06-18days on market $259,000 Active 108 DOM
-
2026-06-17days on market $259,000 Active 107 DOM
-
2026-06-16days on market $259,000 Active 106 DOM
-
2026-06-15days on market $259,000 Active 105 DOM
-
2026-06-13days on market $259,000 Active 103 DOM
-
2026-06-10days on market $259,000 Active 99 DOM
-
2026-06-08days on market $259,000 Active 98 DOM
-
2026-06-07days on market $259,000 Active 97 DOM
-
2026-06-04days on market $259,000 Active 94 DOM
-
2026-06-01days on market $259,000 Active 91 DOM
-
2026-05-31days on market $259,000 Active 90 DOM
-
2026-03-02$277,000 Active 689-char remark
Show marketing remark (689 chars)
This hidden 3-Bedroom gem at a Mid- Century Modern building located two blocks north of the Galleria Mall has been FULLY REMODELED including: NEW A/C/Hi-Eff Heat Pump, new Plumbing fixtures, new Electrical, and recently new Roof!. Also new kitchen appliances, new bathroom fixtures, and new washer/dryer. First floor open plan living room/ dining area, kitchen, and powder room, lots of natural light throughout overlooking spacious patio with planting area and private gate. Conveniently located to Galleria Area schools, restaurants, stores, grocery stores,pharmacy, office buildings, and more! *Measurements/dimensions can be verified by the buyer. Schedule you private tour today!
-
2026-01-02historical
-
2025-11-11$295,000 Active
ⓘ Source: listings_history table (triggers on properties + properties_extension) + one-shot
backfill from property_details.listing_events for pre-trigger history.
Climate risk First Street
- Flood 5/10 Major FEMA zone X (unshaded) · 65% chance over 30 yrs
- Wildfire 1/10 Low
- Heat 9/10 Extreme 7 d/yr ≥109°F today · 24 d/yr by 30 yrs out
- Wind 9/10 Extreme 99% chance of damaging wind over 30 yrs
- Air quality 2/10 Low 2 unhealthy d/yr today · 2 by 30 yrs out
Nearby sold comps map
Loading sold comps map…
Walkable amenities ~0.75 mi
Loading nearby amenities…
Taxation est. · year 1
- Rental income
- $33,341
- − Mortgage interest
- −$14,508
- − Property taxes
- −$3,885
- − Insurance
- −$1,295
- − Repairs & maintenance
- −$2,667
- − Management
- −$2,667
- − HOA
- −$1,692
- − Depreciation
- −$7,535
- Taxable loss
- −$908
- Est. tax savings @ 24.0%
- +$218
- After-tax cash flow
- $3,387/yr
For passive investors: Depreciation is non-cash, so a rental often shows a tax loss while cash-flowing — sheltering income. Rental losses are passive: they offset passive income freely, and up to $25,000/yr can offset ordinary (W-2) income if you actively participate and your MAGI is under $100k (phasing out to $0 by $150k); unused losses carry forward. On sale, claimed depreciation is recaptured at up to 25%, and gains may owe capital-gains tax (a 1031 exchange can defer both). Figures are a year-1 estimate at your 24.0% rate — not tax advice; consult a CPA.
Condition & rehab AI · 12 photos
This fully remodeled 3-bedroom condo is move-in ready with new appliances, fixtures, and systems. It offers a spacious open floor plan and a private patio with landscaping. Smart home integration and energy-efficient updates would further enhance its value.
Value-add opportunities
- Both Landscaping and patio area — Enhances curb appeal and outdoor living space.
- Both Smart home integration — Improves convenience and energy efficiency.
- Both Smart thermostat — Saves energy and improves comfort.
Renovation cost estimate screening
Value-add ROI direction
- Both Landscaping and patio area — Enhances curb appeal and outdoor living space. ↑
- Both Smart home integration — Improves convenience and energy efficiency. ↑
- Both Smart thermostat — Saves energy and improves comfort. ↑
ⓘ Cost ranges are severity-bucket heuristics (US national rule-of-thumb). Get contractor quotes + a written scope before underwriting a rehab budget.
Schools (NCES district)
- District
- Houston ISD
- NCES district ID
- 4823640
- Math proficiency
- 27% ▼ -18.00%
- Reading proficiency
- 35% ▼ -6.00%
- Median HH income
- $46,054
- Composite
- 26.63/100
- National rank
- #7173
- State rank
- #593 of 826 in TX
Livability — Houston
- Score
- 74/100
- State rank
- #184
- US rank
- #4771
Category grades
Schools grade is shown separately in the Schools card above.
Census & demographics
- Census place
- Houston, TX
- County
- Harris County · 4,702,590 people
- City population
- 3,226,434
- Metro
- Houston-The Woodlands-Sugar Land, TX
- Population (ZIP)
- 22,877
- Household income
- $93,499
- Rent vs Own
- Severe rent burden
- 2132.0
Population outlook (Harris County) Hauer SSP2
- Today (2025)
- 5,571,493 people
- By 2030
- 6,089,821 · +9.3%
- By 2040
- 7,142,806 · +28.2%
- By 2050
- 8,185,864 · +46.9%
- By 2075
- 10,574,329 · +89.8%
- By 2100
- 12,109,958 · +117.4%
Race, ethnicity, and origin ACS 2023
- Neighborhood character
- Diverse neighborhood (Simpson 0.64)
- Race & ethnicity
- White 54% Hispanic / Latino 22% Asian 14% Two or more races 13% Black 8%
- Hispanic origin (detail)
- Mexican 11% Puerto Rican 1% Salvadoran 1%
- Common ancestry
- Lithuanian 3% Slovak 2% Italian 2%
- Foreign-born
- 29% · Canada, Jamaica, China
- Languages at home
- 60% English-only · Spanish 20% Other Indo-European 7% Other Asian/Pacific 2%
Political lean MEDSL · Harris
- 2024 margin
- Lean D (+5.5) · D 52.0% · R 46.4% · Other 1.6%
- 2008→2024 swing
- +3.9pp toward D · 2008: 1.6pp · 2024: 5.5pp
- All cycles
- 2024: D+5.5 2020: D+13.3 2016: D+12.4 2012: D+0.1 2008: D+1.6
Not yet ingested
- Civics
- —
Market trends
- HPI YoY
- ▼ -127.46%
- Current HPI
- 175.1726
- Rent YoY
- ▼ -1.70%
- Metro
- Houston-The Woodlands-Sugar Land, TX
- State GDP YoY
- ▲ 3.95%
- F500 in state
- 110
Industry mix (Fortune 500 HQ in TX)
| Industry | F500 HQs | Revenue |
|---|---|---|
| Energy | 16 | $1,198B |
|
||
| Technology | 5 | $198B |
|
||
| Engineering / Construction | 4 | $72B |
|
||
| Energy Services | 3 | $60B |
|
||
| Utilities | 3 | $41B |
|
||
| Healthcare | 2 | $330B |
|
||
Price history
-6.1% since first listed3 events — show timeline
- 2026-03-02 Listed $277,000 HARMLS
- 2026-01-02 Listing Removed — HARMLS
- 2025-11-11 Listed $295,000 HARMLS
Cash-flow waterfall
monthlySold comps — $/sqft
last 12 mo · ≤1 miLoading sold comps…