1345 Charleston Square Dr #102 · Naples Park, FL
Flood risk 7/10 · Major
- FEMA flood zone
- X (shaded)
- Chance of flooding over 30 yrs
- 0.76%
- Est. flood insurance / yr
- $507 – $1,088
Fire risk 3/10 · Minor
- Est. fire insurance / yr
- $947 – $1,759
Heat risk 10/10 · Severe
- Hot days now (above 107°F)
- 7 days/yr
- Hot days in 30 yrs
- 30 days/yr
Wind risk 10/10 · Severe
- Chance of severe wind over 30 yrs
- 99.0%
Air-quality risk 2/10 · Minimal
- Unhealthy air days now
- 1 days/yr
- Unhealthy air days in 30 yrs
- 1 days/yr
Risk factors via First Street. Map © Google.
Why this score? — see what drove the C grade
The composite is a weighted blend of 9 inputs, each scored 0–100. Each bar is that input's sub-score; the figure is the points it added to the 100-point composite (weight × sub-score).
- Cash flow +22.0/30.0
- ARV discount +7.5/15.0
- 1% rule +7.3/10.0
- DSCR +7.0/10.0
- Schools +5.0/10.0
- Livability +3.2/5.0
- Condition / age +2.5/5.0
- Rent growth +2.2/5.0
- Appreciation +0.0/10.0
$385,000
🖨 Deal sheet (PDF) 📄 Offer letter ✓ Due diligence
Listing remarks MLS
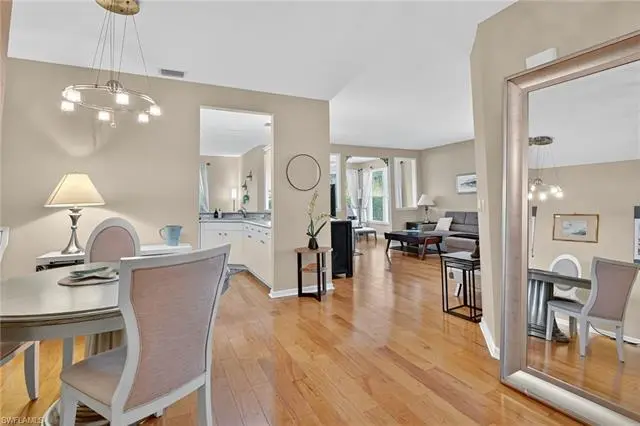
INCREDIBLE UNIT!!! lots of windows, natural light 2 bedrooms plus den first floor end unit with a 1-car garage. Tastefully decorated with many upgrades including wood floors in foyer, dining, living, kitchen, and sun room area, master bath and guest bath REDO, designer lighting and window treatments. This unit is larger than most at 1643 sq under air. There is a spacious and open floor plan with large room sizes throughout. This unit is a must see and is price to sell. IMPERIAL GOLF ESTATES is sought after guard gated GOLF COMMUNITY offering private and social memberships with unbelievable association fees. PRIME NORTH NAPLES LOCATION near shopping malls, grocery stores, NCH Hospital, dinning, beaches and 5 min form Mercato.
Key facts
- Gated community
- Open concept living
- Tranquil preserve
Tags
Property features AI
Other
- Location: Located in the Charleston Square sub-community
- Possession: Possession at closing
- Multi-unit information: One unit per floor; 37 units in the complex; 4 units in the building; Single-story building
Finance
- HOA & community: Mandatory condo association; Quarterly condo fee; Condo fee covers cable, internet/Wi‑Fi, lawn/land maintenance, pest control (interior & exterior), repairs, street maintenance and lights, trash removal, water, management and accounting/legal; Community amenities include private beach access, bike & jog path, bike storage, community pool, internet access, sidewalks and streetlights; Gated community with golf equity; Total annual recurring fees listed; One-time fees listed
Exterior
- Parking: Detached 1-car garage; Paved driveway; Guest parking available
- Security: Guarded gate
- Utilities: Water assessment paid; Sewer assessment paid; Electric service for heat and cooling (central)
- Home design: Residential low-rise (1–3 stories); Corner end-unit; Rear exposure faces north; Built in 1998; Located in the gated golf-course community Imperial Golf Estates
- Construction: Concrete block construction
- Exterior features: Patio; Stucco exterior; Impact-resistant windows; Impact-resistant storm protection; Shingle roof; Landscaped area view; Assessment-paid irrigation
Interior
- Kitchen: Pantry; Breakfast bar; Eat-in kitchen / dining area; Electric cooktop; Self-cleaning oven; Microwave; Dishwasher; Disposal; Refrigerator / freezer; Refrigerator with icemaker
- Bedrooms: 2 bedrooms; Primary/one bedroom located on the first floor
- Flooring: Tile; Wood
- Bathrooms: 2 full bathrooms; Primary bath with dual sinks and shower (no tub)
- Heating & cooling: Central electric heat; Central electric air conditioning; Cable available
- Interior features: Built-in cabinets; Cable prewire / high-speed available; Foyer; Pantry; Smoke detectors; Walk-in closet; Glass porch; Guest bathroom; Guest room; Laundry in residence; Partially furnished
- Laundry & utility: Washer and dryer in unit; Auto garage door opener
Neighborhood map
What this means for you Summary
Snapshot
- This is a 2-bed/2.0-bath condo listed at $385k.
Deal economics
- At list price, monthly cash flow is $545 ($7k/yr) — positive.
- The deal already cash-flows at list — no discount required.
- Meets the 1% rule at list price ($5k rent vs $385k).
- Recommended offer: $373k (3.0% below list) — sets the bar for market timing.
Location & tenants
- Location reads 64/100 on livability (#696 in FL) — a middle-class / working-renter tenant base. Strengths: crime A+, housing A-, employment B+; Watch: health & safety D, schools F, amenities F.
- Collier (suburban): math 60% / reading 56% proficiency, ranked #16 of 73 in FL (top 22%) — acceptable for families but not a draw, mixed tenant base, ~2y average lease.
- Market conditions: Rents soft (-1.1%/yr); 595 active listings in the ZIP; 40 comparable units currently listed for rent nearby; rentals at typical pace (median 24d on market — plan ~3-4 weeks tenant-placement turnaround); solid renter incomes; 3,520 units permitted in Collier County in 2024 (959 in 5+ unit buildings).
- At $4,739/mo this rent would consume 58% of the median local household income ($98k/yr) (locally 1006% of renters already pay >50% of income on rent) — very limited rent-growth headroom before tenants either downsize or default.
Forward outlook
- Local home prices are declining (-3.0%/yr); year-one equity from $3k of loan paydown is wiped out by about $12k of value loss. Plan a longer hold.
- Collier County population projected at +30% by 2050 — long-run rental-demand tailwind backs the buy-and-hold thesis.
Negotiation context
- It's been on market 48 days — a 3% lower offer ($373k) is reasonable based on typical stale-listing flexibility.
- 6 sale attempts since 18y ago with the ask held roughly flat each time — persistent listings suggest the price (not the market) is what's stuck; bring a comps-based counter.
- Current owner paid $209k; list at $385k implies a 84% gain — meaningful room to come down on a strong offer.
Risks & watch-outs
- Watch-outs: flood insurance adds $66/mo.
- Climate carrying-cost: major flood risk; severe wind risk, 99% chance of damaging wind over 30y; extreme-heat days projected 7→30/yr by 2055 (HVAC capex compounding) — expect insurance premiums to compound above CPI over the hold.
Questions for the listing agent
- It's been on market 48 days. Have you received any prior offers? Is the seller open to a 3% concession, seller financing, or rate buy-down credit?
- What's the actual annual flood-insurance premium (NFIP or private), and is the property in a SFHA with mandatory coverage?
- What does the HOA fee cover, when was the last increase, and are there any pending special assessments or reserve-fund shortfalls?
- Any open or pending special assessments — roof, HVAC, plumbing, elevator, façade? What's the per-unit balance and payoff schedule, and is the seller paying it off at close or rolling it to the buyer?
- Is there a deadline driving the sale (1031 exchange, divorce, estate, relocation)? That informs how much negotiation room exists.
- Schools are F-rated, which usually means shorter tenancies and higher turnover. Who's the typical renter profile here, and what's been the actual vacancy rate?
- What's the average days-on-market for RENTAL listings here right now (not sales)? A rising rental-DOM trend means longer vacancies and softer asking-rent achievability than the comps imply.
- What's the recent tenant-quality profile in this submarket — average credit score on applications, eviction rate, late-payment / NSF rate, and stable-employment percentage? A property-management company in the area should have these aggregated.
- How much new apartment / multifamily construction is in the pipeline within 1–3 miles? Heavy new supply (>2% of stock underway) typically softens rents 12–24 months out; light construction supports rent growth.
Investment metrics
- 1% rule
- 1.23% ✓
- Cap rate
- 8.20%
- Cash-on-cash
- 6.80%
- DSCR
- 1.30
- GRM
- 6.8
CMA / ARV
No comps found within radius.
Projected returns pro-forma
-3.0% appreciation · 0.0% rent growth · sell at horizon
- IRR
- -10.9%
- Equity multiple
- 0.62×
- Total profit
- $-41,178
- Equity at exit
- $57,405
- IRR
- -7.5%
- Equity multiple
- 0.60×
- Total profit
- $-43,217
- Equity at exit
- $33,288
Cash invested: $107,800 (down + closing). Projections, not guarantees.
Landlord ↔ Tenant lean methodology
- Overall (STATE)
- 87 Strongly Landlord-Friendly
- State Florida
- 87 Strongly Landlord-Friendly · R+3
- County
- — inherits STATE
- City
- — inherits STATE
ZIP-level market 34110
- Rents YoY
- -1.1%
- Active inventory
- 595
- Price-to-rent
- 6.8×
Monthly cashflow live
- Estimated rent
- $4,739 high interval (Pro) →
- Mortgage (P&I)
- −$2,019
- Tax from tax record
- −$259 /mo · $3,107/yr
- Insurance
- −$160
- Flood insurance flood zone
- −$66 /mo · $798/yr
- HOA
- −$694
- Vacancy / Maint / Mgmt
- −$995
- Net cashflow
- $545
Break-even live
Sensitivity live
| Price | -10% $763 | -5% $654 | +0% $545 | +5% $436 | +10% $327 |
|---|---|---|---|---|---|
| Rent | -10% $170 | -5% $358 | +0% $545 | +5% $732 | +10% $919 |
| Rate | -1.0pp $739 | -0.5pp $643 | base $545 | +0.5pp $445 | +1.0pp $343 |
UW: 25.0% down · 7.5% · 30yr · 1.5% tax · 5.0% vac · 8.0% maint · 8.0% mgmt
Financing live
Cash to close
- Down payment
- $96,250
- Closing costs
- $11,550
- Reserves months
- —
- Total cash needed
- —
Loan-product check · same deal, 3 products live
Conventional
25% down · 7.5% · 30yr
- Down + closing
- —
- Monthly P&I
- —
- Monthly cashflow
- —
- DSCR
- —
- Eligible?
- —
Personal DTI + credit; lowest rate.
DSCR
20% down · 8.5% · 30yr
- Down + closing
- —
- Monthly P&I
- —
- Monthly cashflow
- —
- DSCR
- —
- Eligible?
- —
No personal income docs; deal must DSCR.
Hard money
10% down · 12.0% · 12mo
- Down + closing
- —
- Monthly P&I
- —
- Monthly cashflow
- —
- DSCR
- —
- Eligible?
- —
Short-term bridge; refi at stabilization.
Rent comps 40 comps
| Address | Beds | Baths | Sqft | Rent | $/sqft | DOM | Units | Dist |
|---|---|---|---|---|---|---|---|---|
| 1290 Yesica Ann Cir Unit G203 Naples, FL | 2.0 | 2.0 | 1245 | $6,000 | $4.82 | 14d | 1 | 0.14mi |
| 1290 Yesica Ann Cir Unit G-105 Naples, FL | 2.0 | 2.0 | 1168 | $5,500 | $4.71 | 14d | 1 | 0.14mi |
| 1245 Imperial Dr Naples, FL | 3.0 | 3.0 | 1848 | $13,000 | $7.03 | 24d | 1 | 0.18mi |
| 1190 Yesica Ann Cir Unit B101 Naples, FL | 2.0 | 2.0 | 1245 | $2,500 | $2.01 | 14d | 1 | 0.21mi |
| 1150 Yesica Ann Cir Unit A205 Naples, FL | 2.0 | 2.0 | 1300 | $6,000 | $4.62 | 14d | 1 | 0.25mi |
| 1351 Park Lake Dr Unit 14R Naples, FL | 2.0 | 2.0 | 1400 | $2,200 | $1.57 | 14d | 1 | 0.26mi |
| 1120 Sarah Jean Cir Unit B205 Naples, FL | 3.0 | 2.0 | 1370 | $2,300 | $1.68 | 14d | 1 | 0.34mi |
| 1530 Imperial Golf Course Blvd #321 Naples, FL | 2.0 | 2.0 | 1400 | $2,100 | $1.50 | 24d | 1 | 0.38mi |
| 1520 Imperial Golf Course Blvd #211 Naples, FL | 2.0 | 2.0 | 1357 | $5,000 | $3.68 | 24d | 1 | 0.43mi |
| 953 Bunker Hill Dr Naples, FL | 2.0 | 2.0 | 1100 | $3,200 | $2.91 | 14d | 1 | 0.49mi |
| 13093 Castle Harbour Dr Unit L10 Naples, FL | 2.0 | 2.0 | 1531 | $2,595 | $1.69 | 21d | 1 | 0.52mi |
| 13093 Castle Harbour Dr Unit L10 Naples, FL | 2.0 | 2.0 | 1531 | $2,595 | $1.69 | 24d | 1 | 0.52mi |
| 13131 Castle Harbour Dr Unit M3 Naples, FL | 2.0 | 2.0 | 1531 | $5,000 | $3.27 | 24d | 1 | 0.53mi |
| 1790 Imperial Golf Course Blvd Unit A205 Naples, FL | 2.0 | 2.0 | 1183 | $2,300 | $1.94 | 14d | 1 | 0.55mi |
| 13140 Hamilton Harbour Dr Unit F4 Naples, FL | 2.0 | 2.0 | 1340 | $5,500 | $4.10 | 24d | 1 | 0.66mi |
| 1337 Center Ln Naples, FL | 3.0 | 2.0 | 1500 | $4,300 | $2.87 | 24d | 1 | 0.74mi |
| 975 Tarpon Cove Dr #204 Naples, FL | 3.0 | 2.0 | 1340 | $5,500 | $4.10 | 14d | 1 | 0.80mi |
| 1296 Grand Canal Dr Naples, FL | 3.0 | 2.0 | 1614 | $8,000 | $4.96 | 24d | 1 | 0.85mi |
| 752 Wiggins Lake Dr #102 Naples, FL | 2.0 | 2.0 | 1402 | $2,375 | $1.69 | 21d | 1 | 0.89mi |
| 757 Wiggins Lake Dr #106 Naples, FL | 3.0 | 2.0 | 1374 | $6,000 | $4.37 | 14d | 1 | 0.90mi |
| 757 Wiggins Lake Dr #106 Naples, FL | 3.0 | 2.0 | 1374 | $6,000 | $4.37 | 24d | 1 | 0.90mi |
| 1025 Tarpon Cove Dr #203 Naples, FL | 2.0 | 2.0 | 1225 | $5,500 | $4.49 | 14d | 1 | 0.91mi |
| 760 Wiggins Lake Dr #205 Naples, FL | 2.0 | 2.0 | 1179 | $5,500 | $4.66 | 24d | 1 | 0.92mi |
| 1284 Rainbow Ct Naples, FL | 2.0 | 2.0 | 1572 | $4,200 | $2.67 | 21d | 1 | 0.93mi |
| 1911 Princess Ct Naples, FL | 3.0 | 2.0 | 1978 | $3,995 | $2.02 | 24d | 1 | 0.96mi |
| 784 Carrick Bend Cir #101 Naples, FL | 3.0 | 2.0 | 1515 | $3,500 | $2.31 | 24d | 1 | 0.98mi |
| 1282 Belaire Ct Naples, FL | 3.0 | 3.5 | 1495 | $9,500 | $6.35 | 24d | 1 | 0.99mi |
| 437 Wiggins Lake Ct #201 Naples, FL | 2.0 | 2.0 | 1283 | $4,500 | $3.51 | 24d | 1 | 1.00mi |
| 14478 Sterling Oaks Dr Naples, FL | 3.0 | 3.0 | 2173 | $4,000 | $1.84 | 24d | 1 | 1.00mi |
| 774 Wiggins Lake Dr #106 Naples, FL | 3.0 | 2.0 | 1374 | $6,500 | $4.73 | 24d | 1 | 1.02mi |
| 651 Wiggins Lake Dr #102 Naples, FL | 2.0 | 2.0 | 1487 | $6,500 | $4.37 | 24d | 1 | 1.07mi |
| 817 Carrick Bend Cir #101 Naples, FL | 3.0 | 2.0 | 1660 | $5,995 | $3.61 | 14d | 1 | 1.07mi |
| 1680 Sanctuary Pointe Ct Naples, FL | 3.0 | 2.0 | 1888 | $5,900 | $3.12 | 24d | 1 | 1.12mi |
| 241 Palm River Blvd Unit C202 Naples, FL | 2.0 | 2.0 | 1430 | $3,500 | $2.45 | 24d | 1 | 1.23mi |
| 480 Bermuda Cove Way Unit 1-104 Naples, FL | 2.0 | 2.0 | 1372 | $4,250 | $3.10 | 24d | 1 | 1.27mi |
| 240 Palm River Blvd Unit C102 Naples, FL | 2.0 | 2.0 | 1440 | $2,995 | $2.08 | 24d | 1 | 1.28mi |
| 425 Cove Tower Dr #902 Naples, FL | 2.0 | 2.0 | 1854 | $9,400 | $5.07 | 24d | 1 | 1.29mi |
| 430 Cove Tower Dr #302 Naples, FL | 3.0 | 2.0 | 1623 | $6,500 | $4.00 | 24d | 1 | 1.29mi |
| 430 Cove Tower Dr #1202 Naples, FL | 3.0 | 2.0 | 1519 | $7,800 | $5.13 | 24d | 1 | 1.29mi |
| 1315 Remington Way #1201 Naples, FL | 3.0 | 2.0 | 2105 | $4,900 | $2.33 | 14d | 1 | 1.31mi |
HOA detail condo
- Monthly dues
- $694 · $8,328/yr
- Likely covers
- security
- Assessments
- None detected in remarks — confirm with the listing agent.
Listing history 12 events
-
2026-06-18days on market $385,000 Active 48 DOM
-
2026-06-17days on market $385,000 Active 47 DOM
-
2026-06-16days on market $385,000 Active 46 DOM
-
2026-06-15days on market $385,000 Active 45 DOM
-
2026-06-14days on market $385,000 Active 43 DOM
-
2026-06-10days on market $385,000 Active 40 DOM
-
2026-06-09days on market $385,000 Active 39 DOM
-
2026-06-08days on market $385,000 Active 38 DOM
-
2026-06-07days on market $385,000 Active 37 DOM
-
2026-06-03days on market $385,000 Active 33 DOM
-
2026-06-03remarks 687-char remark
-
2026-06-03$385,000 Active 32 DOM
ⓘ Source: listings_history table (triggers on properties + properties_extension) + one-shot
backfill from property_details.listing_events for pre-trigger history.
Tax reassessment forecast FL · Resets to sale price
- Current annual tax
- $3,107 · $259/mo
- Projected year-2 tax
- $3,196 · $266/mo
- Expected delta
- +$88/yr (+$7/mo · 2.8%)
ⓘ Screening estimate from a state-policy table — verify with the county assessor before closing.
Climate risk First Street
- Flood 7/10 Severe FEMA zone X (shaded) · 76% chance over 30 yrs
- Wildfire 3/10 Moderate
- Heat 10/10 Extreme 7 d/yr ≥107°F today · 30 d/yr by 30 yrs out
- Wind 10/10 Extreme 99% chance of damaging wind over 30 yrs
- Air quality 2/10 Low 1 unhealthy d/yr today · 1 by 30 yrs out
Nearby sold comps map
Loading sold comps map…
Walkable amenities ~0.75 mi
Loading nearby amenities…
Taxation est. · year 1
- Rental income
- $56,863
- − Mortgage interest
- −$21,566
- − Property taxes
- −$3,107
- − Insurance
- −$2,722
- − Repairs & maintenance
- −$4,549
- − Management
- −$4,549
- − HOA
- −$8,328
- − Depreciation
- −$11,200
- Taxable income
- $842
- Est. tax owed @ 24.0%
- −$202
- After-tax cash flow
- $6,335/yr
For passive investors: Depreciation is non-cash, so a rental often shows a tax loss while cash-flowing — sheltering income. Rental losses are passive: they offset passive income freely, and up to $25,000/yr can offset ordinary (W-2) income if you actively participate and your MAGI is under $100k (phasing out to $0 by $150k); unused losses carry forward. On sale, claimed depreciation is recaptured at up to 25%, and gains may owe capital-gains tax (a 1031 exchange can defer both). Figures are a year-1 estimate at your 24.0% rate — not tax advice; consult a CPA.
Schools (NCES district)
- District
- Collier
- NCES district ID
- 1200330
- Math proficiency
- 60% ▼ -4.00%
- Reading proficiency
- 56% ▼ -2.00%
- Median HH income
- $58,275
- Composite
- 50.23/100
- National rank
- #1892
- State rank
- #16 of 73 in FL
Livability — Naples Park
- Score
- 64/100
- State rank
- #696
- US rank
- #14564
Category grades
Schools grade is shown separately in the Schools card above.
Census & demographics
- County
- Collier County · 396,295 people
- Metro
- Naples-Marco Island, FL
- Population (ZIP)
- 25,630
- Household income
- $97,564
- Rent vs Own
- Severe rent burden
- 1006.0
Population outlook (Collier County) Hauer SSP2
- Today (2025)
- 420,858 people
- By 2030
- 450,054 · +6.9%
- By 2040
- 502,232 · +19.3%
- By 2050
- 544,932 · +29.5%
- By 2075
- 627,203 · +49.0%
- By 2100
- 659,015 · +56.6%
Race, ethnicity, and origin ACS 2023
- Neighborhood character
- Predominantly White (84%)
- Race & ethnicity
- White 84% Hispanic / Latino 10% Two or more races 9% Asian 2% Black 1%
- Hispanic origin (detail)
- Mexican 2% Puerto Rican 1% Cuban 3%
- Common ancestry
- Romanian 4% Lithuanian 3% Slovak 2%
- Foreign-born
- 11% · Canada, South Korea
- Languages at home
- 87% English-only · Spanish 7% Other Indo-European 3% French/Haitian/Cajun 1%
Political lean MEDSL · Collier
- 2024 margin
- Solid R (+33.1) · D 33.1% · R 66.2%
- 2008→2024 swing
- -10.6pp toward R · 2008: -22.5pp · 2024: -33.1pp
- All cycles
- 2024: R+33.1 2020: R+24.7 2016: R+26.0 2012: R+30.1 2008: R+22.5
Not yet ingested
- Civics
- —
Market trends
- HPI YoY
- ▼ -172.68%
- Current HPI
- 267.4644
- Rent YoY
- ▼ -1.06%
- Metro
- Naples-Marco Island, FL
- State GDP YoY
- ▲ 3.28%
- F500 in state
- 36
Industry mix (Fortune 500 HQ in FL)
| Industry | F500 HQs | Revenue |
|---|---|---|
| Industrial Technology | 2 | $29B |
|
||
| Insurance | 2 | $17B |
|
||
| Retail | 1 | $60B |
|
||
| Technology Distribution | 1 | $58B |
|
||
| Homebuilding | 1 | $35B |
|
||
| Technology Manufacturing | 1 | $35B |
|
||
Price history
+209.2% since first listed15 events — show timeline
- 2026-05-02 Listed $385,000 NAPLESMLS
- 2024-11-14 Rental Removed $2,750 NAPLESMLS
- 2024-05-23 Listed for Rent $2,750 NAPLESMLS
- 2019-06-25 Sold (Public Records) $209,000 Public Records
- 2019-06-21 Sold (MLS) $209,000 NAPLESMLS
- 2019-06-03 Pending — NAPLESMLS
- 2019-05-20 Relisted — NAPLESMLS
- 2019-03-25 Listing Removed — NAPLESMLS
- 2019-03-01 Listed $212,900 NAPLESMLS
- 2018-05-17 Listing Removed — NAPLESMLS
- 2018-04-25 Listed $217,900 NAPLESMLS
- 2009-09-15 Sold (Public Records) $159,500 Public Records
- 2009-07-29 Sold (MLS) $159,500 NAPLESMLS
- 2008-08-05 Listed $169,900 NAPLESMLS
- 1999-01-22 Sold (Public Records) $124,500 Public Records
Property tax history
+11.0%/yrLatest (2025): $3,107 · -0.4% YoY. Source: county tax records.
Cash-flow waterfall
monthlySold comps — $/sqft
last 12 mo · ≤1 miLoading sold comps…