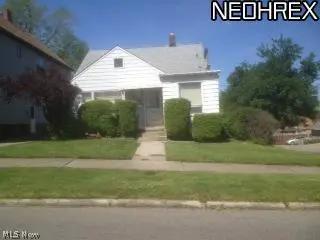
4904 E 90th St · Garfield Heights, OH
Flood risk 1/10 · Minimal
- FEMA flood zone
- X (unshaded)
- Chance of flooding over 30 yrs
- 0.0%
- Est. flood insurance / yr
- $473 – $860
Fire risk 1/10 · Minimal
- Est. fire insurance / yr
- $713 – $1,323
Heat risk 3/10 · Minor
- Hot days now (above 96°F)
- 7 days/yr
- Hot days in 30 yrs
- 17 days/yr
Wind risk 1/10 · Minimal
- Chance of severe wind over 30 yrs
- —
Air-quality risk 3/10 · Minor
- Unhealthy air days now
- 2 days/yr
- Unhealthy air days in 30 yrs
- 3 days/yr
Risk factors via First Street. Map © Google.
Why this score? — see what drove the C grade
The composite is a weighted blend of 9 inputs, each scored 0–100. Each bar is that input's sub-score; the figure is the points it added to the 100-point composite (weight × sub-score).
- Cash flow +19.1/30.0
- ARV discount +15.0/15.0
- 1% rule +6.2/10.0
- DSCR +6.0/10.0
- Rent growth +3.7/5.0
- Livability +3.4/5.0
- Condition / age +2.5/5.0
- Schools +1.3/10.0
- Appreciation +0.0/10.0
$135,000
🖨 Deal sheet 📄 Offer letter ✓ Due diligence
Listing remarks MLS
This is not a bank owned property. Not a short sale. Point of sale inspection ordered.
Key facts
- 6,499 sq ft lot
- Built 1952
- Listed 10 days
Property features AI
Exterior
- Parking: No garage; On-street parking
- Utilities: Public water; Public sewer; Gas heating
- Home design: 2-story home; Facing information not provided; Entry level information not provided; Property updated/remodeled
- Construction: Built according to public records; Aluminum siding; Asphalt roof; Below-grade finished area reported; Above-grade finished area reported
- Exterior features: Public water; Public sewer
Interior
- Kitchen: Cooktop
- Bedrooms: 2 main-level bedrooms
- Bathrooms: 1 full bathroom (main level)
- Heating & cooling: Gas heating
- Interior features: Partially finished basement; Updated/remodeled condition
- Laundry & utility: Laundry in basement
Neighborhood map
What this means for you Summary
Snapshot
- This is a 3-bed/1.0-bath single-family listed at $135k.
Deal economics
- At list price, monthly cash flow is $144 ($2k/yr) — positive.
- The deal already cash-flows at list — no discount required.
- Meets the 1% rule at list price ($2k rent vs $135k).
Location & tenants
- Location reads 67/100 on livability (#593 in OH) — a middle-class / working-renter tenant base. Strengths: cost of living A+, housing A+, health & safety A; Watch: schools C-, crime D-, amenities F.
- Garfield Heights City Schools (suburban): math 8% / reading 22% proficiency, ranked #643 of 656 in OH (top 98%) — low school quality limits family demand, transient renter base, plan for 1-2y turnover; 64% free/reduced lunch — lower-income household profile, screen leases tightly.
- Market conditions: Rents rising fast (+4.8%/yr); 120 active listings in the ZIP; 38 comparable units currently listed for rent nearby; rentals at typical pace (median 18d on market — plan ~3-4 weeks tenant-placement turnaround); 1,441 units permitted in Cuyahoga County in 2024 (700 in 5+ unit buildings).
- This rent runs 32% of the median local income ($57k/yr) — at the standard rent-burdened threshold; future hikes will face affordability resistance.
Forward outlook
- Local home prices are declining (-3.0%/yr); year-one equity from $933 of loan paydown is wiped out by about $4k of value loss. Plan a longer hold.
- Cuyahoga County population projected to shrink 8% by 2050 — rents likely to lag national; underwrite the cash flow, not the appreciation.
Negotiation context
- Only 10 days on market — expect competitive offers; lowballing is unlikely to land.
- 2 sale attempts since 14y ago with the ask held roughly flat each time — persistent listings suggest the price (not the market) is what's stuck; bring a comps-based counter.
- Current owner paid $17k; list at $135k implies a 694% gain — meaningful room to come down on a strong offer.
Risks & watch-outs
- Watch-outs: property tax is 2.6% of price; built in 1952 — expect roof / HVAC / electrical / plumbing capex.
Questions for the listing agent
- Built in 1952 — when were the roof, HVAC, electrical panel, plumbing, and water heater last replaced?
- Property tax is high relative to price — has the assessment been appealed recently, and will the sale trigger a re-assessment?
- Is there a deadline driving the sale (1031 exchange, divorce, estate, relocation)? That informs how much negotiation room exists.
- Crime grade is D in this area — have there been break-ins, vandalism, or insurance claims at this property in the last 3 years? What carrier currently insures it and at what premium?
- What's the average days-on-market for RENTAL listings here right now (not sales)? A rising rental-DOM trend means longer vacancies and softer asking-rent achievability than the comps imply.
- What's the recent tenant-quality profile in this submarket — average credit score on applications, eviction rate, late-payment / NSF rate, and stable-employment percentage? A property-management company in the area should have these aggregated.
- How much new for-sale + rental construction is in the pipeline within 1–3 miles? Heavy new supply typically softens prices + rents 12–24 months out; constrained supply supports both.
Investment metrics
- 1% rule
- 1.12% ✓
- Cap rate
- 7.57%
- Cash-on-cash
- 4.57%
- DSCR
- 1.20
- GRM
- 7.4
CMA / ARV
- ARV (on-the-fly)
- $165,188
- Comps found
- 12
Show comp detail 12 sales within ~0.75 mi
| Address | Dist | Beds/Ba | Sqft | Sold | Price | $/sf | Match |
|---|---|---|---|---|---|---|---|
| 4868 E 88th St | 0.07mi | 3/1.5 | 1,232 (-9%) | 2mo | $75,000 | $61 | 78 |
| 4863 E 93rd St | 0.10mi | 3/1.5 | 1,212 (-10%) | 1mo | $136,000 | $112 | 75 |
| 4690 E 90th St | 0.37mi | 3/1.5 | 1,278 (-6%) | 3mo | $105,000 | $82 | 69 |
| 4729 E 90th St | 0.30mi | 4/2.5 (+1) | 1,387 (+2%) | 4mo | $145,000 | $105 | 68 |
| 4847 E 94th St | 0.16mi | 3/1.5 | 1,173 (-13%) | 2mo | $167,000 | $142 | 67 |
| 4881 E 85th St | 0.14mi | 3/2.0 | 1,160 (-14%) | 1mo | $152,000 | $131 | 65 |
| 10506 Park Heights Ave | 0.64mi | 3/2.0 | 1,348 (-0%) | 1mo | $155,000 | $115 | 65 |
| 4768 Burleigh Rd | 0.48mi | 3/1.0 | 1,188 (-12%) | 2mo | $132,000 | $111 | 56 |
| 5284 E 102nd St | 0.73mi | 3/2.0 | 1,421 (+5%) | 1mo | $227,500 | $160 | 53 |
| 10606 Langton Ave | 0.61mi | 4/1.0 (+1) | 1,248 (-8%) | 1mo | $162,500 | $130 | 53 |
| 5504 Carol Jean Blvd | 0.59mi | 3/1.5 | 1,189 (-12%) | 2mo | $180,000 | $151 | 48 |
| 5288 E 102nd St | 0.74mi | 3/1.5 | 1,204 (-11%) | 1mo | $146,650 | $122 | 44 |
Match score weights: distance 35% · size 25% · config 20% · recency 20%. Top-matched comps best support the ARV.
Projected returns pro-forma
-3.0% appreciation · 4.8% rent growth · sell at horizon
- IRR
- -6.9%
- Equity multiple
- 0.74×
- Total profit
- $-9,821
- Equity at exit
- $20,129
- IRR
- 5.1%
- Equity multiple
- 1.41×
- Total profit
- $15,525
- Equity at exit
- $11,672
Cash invested: $37,800 (down + closing). Projections, not guarantees.
Landlord ↔ Tenant lean methodology
- Overall (STATE)
- 73 Landlord-Friendly
- State Ohio
- 73 Landlord-Friendly · R+6
- County
- — inherits STATE
- City
- — inherits STATE
ZIP-level market 44125
- Rents YoY
- 4.8%
- Active inventory
- 120
- Price-to-rent
- 7.4×
Monthly cashflow live
- Estimated rent
- $1,514 high interval (Pro) →
- Mortgage (P&I)
- −$708
- Tax from tax record
- −$288 /mo · $3,454/yr
- Insurance
- −$56
- HOA
- −$0
- Vacancy / Maint / Mgmt
- −$318
- Net cashflow
- $144
Break-even live
UW: 25.0% down · 7.5% · 30yr · 1.5% tax · 5.0% vac · 8.0% maint · 8.0% mgmt
Financing live
Cash to close
- Down payment
- $33,750
- Closing costs
- $4,050
- Reserves months
- —
- Total cash needed
- —
Loan-product check · same deal, 3 products live
Conventional
25% down · 7.5% · 30yr
- Down + closing
- —
- Monthly P&I
- —
- Monthly cashflow
- —
- DSCR
- —
- Eligible?
- —
Personal DTI + credit; lowest rate.
DSCR
20% down · 8.5% · 30yr
- Down + closing
- —
- Monthly P&I
- —
- Monthly cashflow
- —
- DSCR
- —
- Eligible?
- —
No personal income docs; deal must DSCR.
Hard money
10% down · 12.0% · 12mo
- Down + closing
- —
- Monthly P&I
- —
- Monthly cashflow
- —
- DSCR
- —
- Eligible?
- —
Short-term bridge; refi at stabilization.
Rent comps 38 comps
| Address | Beds | Baths | Sqft | Rent | $/sqft | DOM | Units | Dist |
|---|---|---|---|---|---|---|---|---|
| 4935 E 86th St Cleveland, OH | 3.0 | 1.0 | 1242 | $1,300 | $1.05 | 16d | 1 | 0.08mi |
| 4913 E 85th St Unit down Garfield Heights, OH | 2.0 | 1.0 | 1008 | $950 | $0.94 | 23d | 1 | 0.13mi |
| 4916 E 85th St Cleveland, OH | 3.0 | 1.0 | 1248 | $1,700 | $1.36 | 16d | 1 | 0.16mi |
| 4928 E 84th St Cleveland, OH | 3.0 | 1.0 | 1352 | $1,395 | $1.03 | 12d | 1 | 0.21mi |
| 4874 E 95th St Cleveland, OH | 3.0 | 1.5 | 1352 | $1,774 | $1.31 | 20d | 1 | 0.23mi |
| 4874 E 95th St Cleveland, OH | 3.0 | 1.5 | 1352 | $1,774 | $1.31 | 23d | 1 | 0.23mi |
| 4960 E 84th St Cleveland, OH | 3.0 | 1.5 | 1352 | $1,495 | $1.11 | 7d | 1 | 0.23mi |
| 9309 Garfield Blvd Cleveland, OH | 2.0 | 1.0 | 1056 | $1,400 | $1.33 | 21d | 1 | 0.24mi |
| 4772 E 90th St Unit Down Garfield Heights, OH | 2.0 | 1.0 | 1004 | $950 | $0.95 | 16d | 1 | 0.25mi |
| 5052 E 88th St Cleveland, OH | 3.0 | 1.0 | 1221 | $1,400 | $1.15 | 7d | 1 | 0.26mi |
| 9516 Alexander Rd Cleveland, OH | 3.0 | 1.0 | 1500 | $2,000 | $1.33 | 19d | 1 | 0.27mi |
| 9334 McCracken Blvd Cleveland, OH | 4.0 | 1.0 | 1150 | $1,595 | $1.39 | 16d | 1 | 0.33mi |
| 4859 E 97th St Cleveland, OH | 2.0 | 1.0 | 1000 | $1,150 | $1.15 | 23d | 1 | 0.36mi |
| 4852 E 81st St Cleveland, OH | 3.0 | 1.0 | 1104 | $1,850 | $1.68 | 1d | 1 | 0.38mi |
| 4685 Horton Rd Cleveland, OH | 3.0 | 1.0 | 1174 | $1,400 | $1.19 | 16d | 1 | 0.54mi |
| 10308 Homeworth Ave Unit Down Garfield Heights, OH | 2.0 | 1.0 | 892 | $950 | $1.07 | 23d | 1 | 0.56mi |
| 10401 Homeworth Ave Unit Up Unit Garfield Heights, OH | 2.0 | 1.0 | 1206 | $1,095 | $0.91 | 20d | 1 | 0.57mi |
| 10010 Parkview Ave Garfield Heights, OH | 3.0 | 1.0 | 877 | $1,500 | $1.71 | 17d | 1 | 0.60mi |
| 4633 Warner Rd Unit 2 Garfield Heights, OH | 3.0 | 1.0 | 1120 | $1,500 | $1.34 | 3d | 1 | 0.65mi |
| 4930 E 108th St Unit Down Garfield Heights, OH | 2.0 | 1.0 | 1067 | $925 | $0.87 | 16d | 1 | 0.68mi |
| 10715 Wadsworth Ave Cleveland, OH | 2.0 | 1.0 | 960 | $800 | $0.83 | 23d | 1 | 0.69mi |
| 10722 Edgepark Dr Garfield Heights, OH | 3.0 | 1.0 | 1296 | $1,449 | $1.12 | 17d | 1 | 0.69mi |
| 10720 Edgepark Dr Cleveland, OH | 3.0 | 1.0 | 1296 | $1,449 | $1.12 | 17d | 1 | 0.70mi |
| 10725 Vernon Ave Cleveland, OH | 2.0 | 1.0 | 1092 | $975 | $0.89 | 17d | 1 | 0.70mi |
| 10721 Plymouth Ave Cleveland, OH | 3.0 | 1.0 | 1300 | $2,000 | $1.54 | 1d | 1 | 0.70mi |
| 10717 Park Heights Ave Unit 3 Garfield Heights, OH | 2.0 | 1.0 | 900 | $750 | $0.83 | 23d | 1 | 0.71mi |
| 11006 McCracken Rd Cleveland, OH | 2.0 | 1.0 | 887 | $1,350 | $1.52 | 23d | 1 | 0.84mi |
| 11107 Park Heights Ave Cleveland, OH | 4.0 | 2.0 | 1640 | $2,000 | $1.22 | 1d | 1 | 0.86mi |
| 11110 Vernon Ave Cleveland, OH | 3.0 | 1.0 | 1224 | $1,395 | $1.14 | 23d | 1 | 0.87mi |
| 11213 McCracken Rd Cleveland, OH | 3.0 | 1.0 | 1200 | $1,375 | $1.15 | 7d | 1 | 0.90mi |
| 7133 Bletch Ct Cleveland, OH | 3.0 | 1.5 | 1471 | $2,000 | $1.36 | 44d | 1 | 0.94mi |
| 11303 McCracken Rd Cleveland, OH | 3.0 | 1.0 | 1300 | $1,650 | $1.27 | 4d | 1 | 0.95mi |
| 5145 E 114th St Cleveland, OH | 3.0 | 1.5 | 1174 | $1,620 | $1.38 | 7d | 1 | 1.04mi |
| 5014 E 71st St Cleveland, OH | 2.0 | 1.0 | 900 | $1,200 | $1.33 | 7d | 1 | 1.05mi |
| 11512 Tonsing Dr Cleveland, OH | 2.0 | 1.0 | 1104 | $1,095 | $0.99 | 16d | 1 | 1.31mi |
| 11512 Tonsing Dr Unit 2 UP Garfield Heights, OH | 2.0 | 1.0 | 1145 | $975 | $0.85 | 23d | 1 | 1.31mi |
| 5069 Henry St Cleveland, OH | 3.0 | 2.0 | 1575 | $2,000 | $1.27 | 21d | 1 | 1.31mi |
| 5581 Saxon Dr Cleveland, OH | 3.0 | 2.0 | 1080 | $1,595 | $1.48 | 7d | 1 | 1.36mi |
Listing history 8 events
-
2026-06-18days on market $135,000 Active 10 DOM
-
2026-06-17days on market $135,000 Active 9 DOM
-
2026-06-16days on market $135,000 Active 8 DOM
-
2026-06-15days on market $135,000 Active 7 DOM
-
2026-06-13days on market $135,000 Active 5 DOM
-
2026-06-13days on market $135,000 Active 4 DOM
-
2026-06-08remarks 265-char remark
-
2026-06-08$135,000 Active 1 DOM
ⓘ Source: listings_history table (triggers on properties + properties_extension) + one-shot
backfill from property_details.listing_events for pre-trigger history.
Tax reassessment forecast OH · Partial reset (capped growth)
- Current annual tax
- $3,454 · $288/mo
- Projected year-2 tax
- $3,454 · $288/mo
- Expected delta
- $0/yr ($0/mo · 0.0%)
ⓘ Screening estimate from a state-policy table — verify with the county assessor before closing.
Climate risk First Street
- Flood 1/10 Low FEMA zone X (unshaded) · 0% chance over 30 yrs
- Wildfire 1/10 Low
- Heat 3/10 Moderate 7 d/yr ≥96°F today · 17 d/yr by 30 yrs out
- Wind 1/10 Low
- Air quality 3/10 Moderate 2 unhealthy d/yr today · 3 by 30 yrs out
Nearby sold comps map
Loading sold comps map…
Walkable amenities ~0.75 mi
Loading nearby amenities…
Taxation est. · year 1
- Rental income
- $18,167
- − Mortgage interest
- −$7,562
- − Property taxes
- −$3,454
- − Insurance
- −$675
- − Repairs & maintenance
- −$1,453
- − Management
- −$1,453
- − Depreciation
- −$3,927
- Taxable loss
- −$358
- Est. tax savings @ 24.0%
- +$86
- After-tax cash flow
- $1,813/yr
For passive investors: Depreciation is non-cash, so a rental often shows a tax loss while cash-flowing — sheltering income. Rental losses are passive: they offset passive income freely, and up to $25,000/yr can offset ordinary (W-2) income if you actively participate and your MAGI is under $100k (phasing out to $0 by $150k); unused losses carry forward. On sale, claimed depreciation is recaptured at up to 25%, and gains may owe capital-gains tax (a 1031 exchange can defer both). Figures are a year-1 estimate at your 24.0% rate — not tax advice; consult a CPA.
Schools (NCES district)
- District
- Garfield Heights City Schools
- NCES district ID
- 3904404
- Math proficiency
- 8% ▼ -19.00%
- Reading proficiency
- 22% ▼ -18.00%
- Median HH income
- $41,334
- Composite
- 12.88/100
- National rank
- #9590
- State rank
- #643 of 656 in OH
Livability — Garfield Heights
- Score
- 67/100
- State rank
- #593
- US rank
- #10152
Category grades
Schools grade is shown separately in the Schools card above.
Census & demographics
- Census place
- Garfield Heights, OH
- County
- Cuyahoga County · 1,090,369 people
- City population
- 29,461
- Metro
- Cleveland-Elyria, OH
- Population (ZIP)
- 29,461
- Household income
- $57,363
- Rent vs Own
- Severe rent burden
- 1738.0
Population outlook (Cuyahoga County) Hauer SSP2
- Today (2025)
- 1,244,621 people
- By 2030
- 1,230,093 · -1.2%
- By 2040
- 1,189,108 · -4.5%
- By 2050
- 1,145,706 · -7.9%
- By 2075
- 1,076,557 · -13.5%
- By 2100
- 978,987 · -21.3%
Race, ethnicity, and origin ACS 2023
- Neighborhood character
- Diverse neighborhood (Simpson 0.61)
- Race & ethnicity
- Black 47% White 41% Two or more races 7% Hispanic / Latino 6%
- Hispanic origin (detail)
- Mexican 2% Puerto Rican 3%
- Common ancestry
- Romanian 11% Slovak 1% Lithuanian 1%
- Foreign-born
- 3% · Canada
- Languages at home
- 94% English-only · Spanish 4% Russian/Polish/Slavic 1%
Political lean MEDSL · Cuyahoga
- 2024 margin
- Solid D (+31.5) · D 65.4% · R 33.9%
- 2008→2024 swing
- -7.4pp toward R · 2008: 38.9pp · 2024: 31.5pp
- All cycles
- 2024: D+31.5 2020: D+34.1 2016: D+35.0 2012: D+38.7 2008: D+38.9
Not yet ingested
- Civics
- —
Market trends
- HPI YoY
- ▼ -116.98%
- Current HPI
- 155.1507
- Rent YoY
- ▲ 4.80%
- Metro
- Cleveland-Elyria, OH
- State GDP YoY
- ▲ 1.98%
- F500 in state
- 48
Industry mix (Fortune 500 HQ in OH)
| Industry | F500 HQs | Revenue |
|---|---|---|
| Insurance | 3 | $145B |
|
||
| Industrial Machinery | 3 | $49B |
|
||
| Financial Services | 3 | $24B |
|
||
| Consumer Goods | 2 | $93B |
|
||
| Aerospace / Defense | 2 | $47B |
|
||
| Utilities | 2 | $33B |
|
||
Price history
+578.4% since first listed3 events — show timeline
- 2026-06-08 Listed $135,000 MLSNOW
- 2012-07-23 Sold (MLS) $17,000 MLSNOW
- 2012-05-14 Listed $19,900 MLSNOW
Property tax history
+13.7%/yrLatest (2025): $3,454 · -26.5% YoY. Source: county tax records.
Cash-flow waterfall
monthlySold comps — $/sqft
last 12 mo · ≤1 miLoading sold comps…