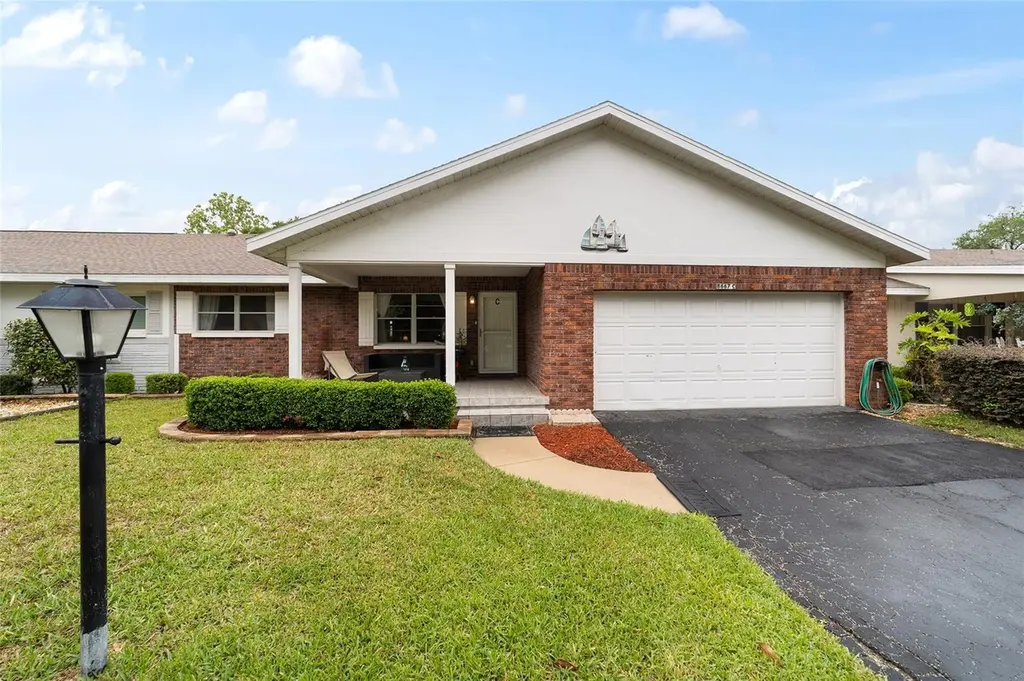
8667 SW 97th St Unit C · On Top of the World, FL
Flood risk 1/10 · Minimal
- FEMA flood zone
- X (unshaded)
- Chance of flooding over 30 yrs
- 0.0%
- Est. flood insurance / yr
- $507 – $1,088
Fire risk 4/10 · Minor
- Est. fire insurance / yr
- $947 – $1,759
Heat risk 8/10 · Major
- Hot days now (above 107°F)
- 7 days/yr
- Hot days in 30 yrs
- 22 days/yr
Wind risk 9/10 · Severe
- Chance of severe wind over 30 yrs
- 99.0%
Air-quality risk 3/10 · Minor
- Unhealthy air days now
- 3 days/yr
- Unhealthy air days in 30 yrs
- 3 days/yr
Risk factors via First Street. Map © Google.
Why this score? — see what drove the D grade
The composite is a weighted blend of 9 inputs, each scored 0–100. Each bar is that input's sub-score; the figure is the points it added to the 100-point composite (weight × sub-score).
- ARV discount +15.0/15.0
- Cash flow +7.1/30.0
- 1% rule +5.8/10.0
- Schools +3.6/10.0
- Rent growth +2.5/5.0
- Livability +2.5/5.0
- Condition / age +2.5/5.0
- DSCR +1.3/10.0
- Appreciation +0.0/10.0
$149,900
🖨 Deal sheet (PDF) 📄 Offer letter ✓ Due diligence
Listing remarks MLS
This popular 2 bedroom, 2 bathroom Bostonian is conveniently located in On Top of the World. The large front porch overlooks a park-like setting and is close to the main entrance which allows for an easy commute to the amenities as well as shopping. The main bedroom has a large walk in closet and updated ensuite bathroom. The spacious kitchen features an abundance of cabinets and has a unique design with a peninsula eating area which can accommodate bar stools. The lanai is the perfect three seasons room with vinyl enclosed windows. This home also features a spacious 2 car garage. Roof was replaced in 2018.
Key facts
- Front porch
- Park-like setting
- Walk in closet
Tags
Neighborhood map
What this means for you Summary
Snapshot
- This is a 2-bed/2.0-bath condo listed at $150k.
Deal economics
- At list price, monthly cash flow is $-210 ($-3k/yr) — negative.
- To cash-flow at today's rent, offer at most $113k (24.8% below list).
- Meets the 1% rule at list price ($2k rent vs $150k).
- Recommended offer: $113k (24.8% below list) — sets the bar for cash-flow.
- Cap rate 4.6% vs local median 2.9% in On Top of the World — top-decile yield for the area; either an underpriced asset or a hidden risk that comps aren't pricing in. Stress-test before assuming the spread holds.
Location & tenants
- Location reads: area grade D — affects rentability + tenant quality, not the cash-flow math above.
- Marion (rural): math 42% / reading 43% proficiency, ranked #61 of 73 in FL (top 84%) — families likely to look elsewhere, expect single-tenant / working-renter base with shorter leases; 61% free/reduced lunch — lower-income household profile, screen leases tightly.
- Zoned schools: Hammett Bowen Jr. Elementary School (math 56% / reading 56%, grade C+, #832 of 2,144 statewide, top 40%, 867 students, 54% FRL); Liberty Middle School (math 40% / reading 41%, grade F, #360 of 571 statewide, top 64%, 1,365 students, 54% FRL); West Port High School (math 34% / reading 52%, grade F, #255 of 667 statewide, top 39%, 2,906 students, 52% FRL).
- Market conditions: 1161 active listings in the ZIP; 34 comparable units currently listed for rent nearby; rentals at typical pace (median 23d on market — plan ~3-4 weeks tenant-placement turnaround); 7,071 units permitted in Marion County in 2024 (534 in 5+ unit buildings).
- This rent runs 34% of the median local income ($57k/yr) — at the standard rent-burdened threshold; future hikes will face affordability resistance.
Forward outlook
- Local home prices are declining (-3.0%/yr); year-one equity from $1k of loan paydown is wiped out by about $4k of value loss. Plan a longer hold.
- Marion County population projected at +13% by 2050 — modest demand growth; plan on rents tracking national, not racing it.
Negotiation context
- It's been on market 73 days — a 6% lower offer ($141k) is reasonable based on typical stale-listing flexibility.
- 3 sale attempts since 6y ago; this cycle's ask has dropped $10k (6%) from the opening price — seller is motivated, your offer sets the floor, not the list.
- Current owner paid $115k; 30% above their basis — modest negotiation headroom, anchor on the comps not their cost.
Risks & watch-outs
- Watch-outs: HOA is 31% of rent.
- Climate carrying-cost: severe wind risk, 99% chance of damaging wind over 30y; extreme-heat days projected 7→22/yr by 2055 (HVAC capex compounding) — expect insurance premiums to compound above CPI over the hold.
Questions for the listing agent
- What do current leases actually rent for vs. the listed asking? Can we see a recent rent roll and the last 12 months of T-12 income?
- It's been on market 73 days. Have you received any prior offers? Is the seller open to a 25% concession, seller financing, or rate buy-down credit?
- What does the HOA fee cover, when was the last increase, and are there any pending special assessments or reserve-fund shortfalls?
- Any open or pending special assessments — roof, HVAC, plumbing, elevator, façade? What's the per-unit balance and payoff schedule, and is the seller paying it off at close or rolling it to the buyer?
- Why hasn't it sold? Are there any deal-killer items the seller is aware of (foundation, flood, title, zoning, code violations)?
- Is there a deadline driving the sale (1031 exchange, divorce, estate, relocation)? That informs how much negotiation room exists.
- The area grade is low — what's the realistic commute time and amenity access for the typical tenant pool here? Any planned neighborhood developments (good or bad) we should know about?
- What's the average days-on-market for RENTAL listings here right now (not sales)? A rising rental-DOM trend means longer vacancies and softer asking-rent achievability than the comps imply.
- What's the recent tenant-quality profile in this submarket — average credit score on applications, eviction rate, late-payment / NSF rate, and stable-employment percentage? A property-management company in the area should have these aggregated.
- How much new apartment / multifamily construction is in the pipeline within 1–3 miles? Heavy new supply (>2% of stock underway) typically softens rents 12–24 months out; light construction supports rent growth.
Investment metrics
- 1% rule
- 1.08% ✓
- Cap rate
- 4.61%
- Cash-on-cash
- -6.01%
- DSCR
- 0.73
- GRM
- 7.7
CMA / ARV
- ARV (median comp)
- $179,948
- List price
- $149,900
- Delta
- -16.70%
- Verdict
- UNDERPRICED
- Comps
- 20 within 1.0 mi
Projected returns pro-forma
-3.0% appreciation · 3.0% rent growth · sell at horizon
- IRR
- -26.3%
- Equity multiple
- 0.11×
- Total profit
- $-37,374
- Equity at exit
- $22,351
- IRR
- -22.5%
- Equity multiple
- -0.16×
- Total profit
- $-48,558
- Equity at exit
- $12,961
Cash invested: $41,972 (down + closing). Projections, not guarantees.
Landlord ↔ Tenant lean methodology
- Overall (STATE)
- 87 Strongly Landlord-Friendly
- State Florida
- 87 Strongly Landlord-Friendly · R+3
- County
- — inherits STATE
- City
- — inherits STATE
ZIP-level market 34481
- Home prices YoY
- -25.2%
- Active inventory
- 1161
- Price-to-rent
- 7.7×
Monthly cashflow live
- Estimated rent
- $1,614 high interval (Pro) →
- Mortgage (P&I)
- −$786
- Tax from tax record
- −$143 /mo · $1,721/yr
- Insurance
- −$62
- HOA
- −$493
- Vacancy / Maint / Mgmt
- −$339
- Net cashflow
- $-210
Break-even live
Sensitivity live
| Price | -10% $-125 | -5% $-168 | +0% $-210 | +5% $-253 | +10% $-295 |
|---|---|---|---|---|---|
| Rent | -10% $-338 | -5% $-274 | +0% $-210 | +5% $-146 | +10% $-83 |
| Rate | -1.0pp $-135 | -0.5pp $-172 | base $-210 | +0.5pp $-249 | +1.0pp $-288 |
UW: 25.0% down · 7.5% · 30yr · 1.5% tax · 5.0% vac · 8.0% maint · 8.0% mgmt
Financing live
Cash to close
- Down payment
- $37,475
- Closing costs
- $4,497
- Reserves months
- —
- Total cash needed
- —
Loan-product check · same deal, 3 products live
Conventional
25% down · 7.5% · 30yr
- Down + closing
- —
- Monthly P&I
- —
- Monthly cashflow
- —
- DSCR
- —
- Eligible?
- —
Personal DTI + credit; lowest rate.
DSCR
20% down · 8.5% · 30yr
- Down + closing
- —
- Monthly P&I
- —
- Monthly cashflow
- —
- DSCR
- —
- Eligible?
- —
No personal income docs; deal must DSCR.
Hard money
10% down · 12.0% · 12mo
- Down + closing
- —
- Monthly P&I
- —
- Monthly cashflow
- —
- DSCR
- —
- Eligible?
- —
Short-term bridge; refi at stabilization.
Rent comps 34 comps
| Address | Beds | Baths | Sqft | Rent | $/sqft | DOM | Units | Dist |
|---|---|---|---|---|---|---|---|---|
| 8671 SW 97th St Unit C Ocala, FL | 2.0 | 2.0 | 1341 | $1,474 | $1.10 | 15d | 1 | 0.07mi |
| 8670 SW 97th St Unit A Ocala, FL | 2.0 | 2.0 | 1341 | $1,600 | $1.19 | 23d | 1 | 0.09mi |
| 8655 SW 98th Street Rd Unit G Ocala, FL | 2.0 | 2.0 | 1424 | $1,500 | $1.05 | 23d | 1 | 0.10mi |
| 8680 SW 94th Ln Unit G Ocala, FL | 3.0 | 2.0 | 1409 | $1,550 | $1.10 | 23d | 1 | 0.20mi |
| 8665 SW 94th St Unit C Ocala, FL | 2.0 | 2.0 | 1589 | $1,600 | $1.01 | 23d | 1 | 0.26mi |
| 8757 SW 97th Lane Rd Unit C Ocala, FL | 2.0 | 2.0 | 1490 | $1,600 | $1.07 | 15d | 1 | 0.32mi |
| 8666 SW 92nd Ln Unit F Ocala, FL | 2.0 | 2.0 | 1748 | $2,000 | $1.14 | 23d | 1 | 0.37mi |
| 9257 SW 82nd Ter Unit H Ocala, FL | 2.0 | 2.0 | 1748 | $1,600 | $0.92 | 23d | 1 | 0.57mi |
| 8430 SW 90th Ln Unit D Ocala, FL | 2.0 | 2.0 | 1454 | $1,600 | $1.10 | 23d | 1 | 0.62mi |
| 8935 SW 102nd Pl Ocala, FL | 2.0 | 2.0 | 1144 | $1,500 | $1.31 | 23d | 1 | 0.63mi |
| 8431 SW 90th Ln Ocala, FL | 2.0 | 2.0 | 1366 | $1,395 | $1.02 | 23d | 1 | 0.65mi |
| 9013 SW 91st Cir Ocala, FL | 2.0 | 2.0 | 1494 | $1,900 | $1.27 | 15d | 1 | 0.76mi |
| 9289 SW 92nd Ln Ocala, FL | 2.0 | 2.0 | 1600 | $1,350 | $0.84 | 23d | 1 | 0.80mi |
| 10441 SW 85th Ct Ocala, FL | 2.0 | 2.0 | 1090 | $1,495 | $1.37 | 23d | 1 | 0.80mi |
| 7750 SW 100th St Ocala, FL | 3.0 | 2.0 | 1805 | $1,750 | $0.97 | 15d | 1 | 0.88mi |
| 7750 SW 100th St Ocala, FL | 3.0 | 2.0 | 1805 | $1,795 | $0.99 | 23d | 1 | 0.88mi |
| 10211 SW 93rd Ct Ocala, FL | 3.0 | 2.0 | 1456 | $1,495 | $1.03 | 23d | 1 | 0.91mi |
| 9513 SW 92nd Place Rd Ocala, FL | 2.0 | 2.0 | 1651 | $2,000 | $1.21 | 15d | 1 | 1.11mi |
| 8701 SW 83rd Cir Ocala, FL | 3.0 | 2.0 | 1726 | $2,200 | $1.27 | 15d | 1 | 1.12mi |
| 9748 SW 97th St Ocala, FL | 2.0 | 2.0 | 1105 | $1,500 | $1.36 | 23d | 1 | 1.16mi |
| 9758 SW 96th St Ocala, FL | 2.0 | 2.0 | 1219 | $1,400 | $1.15 | 23d | 1 | 1.17mi |
| 10061 SW 74th Ter Ocala, FL | 3.0 | 2.0 | 1894 | $1,995 | $1.05 | 15d | 1 | 1.17mi |
| 9794 SW 96th St Ocala, FL | 2.0 | 2.0 | 1201 | $1,700 | $1.42 | 23d | 1 | 1.21mi |
| 9791 SW 96th St Ocala, FL | 2.0 | 2.0 | 1906 | $1,800 | $0.94 | 23d | 1 | 1.21mi |
| 8744 SW 108th Lane Rd Ocala, FL | 3.0 | 2.0 | 1614 | $2,200 | $1.36 | 23d | 1 | 1.25mi |
| 9760 SW 101st Ln Ocala, FL | 2.0 | 2.0 | 1360 | $1,500 | $1.10 | 23d | 1 | 1.28mi |
| 7754 SW 86th Loop Ocala, FL | 2.0 | 2.0 | 1460 | $1,800 | $1.23 | 23d | 1 | 1.29mi |
| 10819 SW 83rd Ct Ocala, FL | 3.0 | 2.0 | 1601 | $1,495 | $0.93 | 23d | 1 | 1.36mi |
| 8714 SW 83rd Loop Ocala, FL | 2.0 | 2.0 | 1658 | $1,900 | $1.15 | 15d | 1 | 1.38mi |
| 8947 SW 108th Pl Ocala, FL | 2.0 | 2.0 | 1096 | $1,500 | $1.37 | 23d | 1 | 1.38mi |
| 8669 SW 108th Ln Ocala, FL | 2.0 | 1.0 | 1152 | $1,250 | $1.09 | 23d | 1 | 1.39mi |
| 9201 SW 108th Pl Ocala, FL | 2.0 | 2.0 | 1170 | $1,475 | $1.26 | 23d | 15 | 1.41mi |
| 8130 SW 108th Street Rd Ocala, FL | 2.0 | 2.0 | 1084 | $1,975 | $1.82 | 23d | 1 | 1.42mi |
| 9770 SW 92nd Place Rd Ocala, FL | 2.0 | 2.0 | 1399 | $2,200 | $1.57 | 23d | 1 | 1.46mi |
HOA detail condo
- Monthly dues
- $493 · $5,916/yr
- Assessments
- None detected in remarks — confirm with the listing agent.
Listing history 24 events
-
2026-06-21days on market $149,900 Active 73 DOM
-
2026-06-18days on market $149,900 Active 70 DOM
-
2026-06-17days on market $149,900 Active 69 DOM
-
2026-06-16days on market $149,900 Active 68 DOM
-
2026-06-15days on market $149,900 Active 67 DOM
-
2026-06-14days on market $149,900 Active 65 DOM
-
2026-06-13days on market $149,900 Active 64 DOM
-
2026-06-10days on market $149,900 Active 62 DOM
-
2026-06-09days on market $149,900 Active 61 DOM
-
2026-06-08days on market $149,900 Active 60 DOM
-
2026-06-07days on market $149,900 Active 59 DOM
-
2026-06-03days on market $149,900 Active 55 DOM
-
2026-06-03price $149,900 Active 54 DOM
-
2026-06-02days on market $160,000 Active 54 DOM
-
2026-06-01days on market $160,000 Active 53 DOM
-
2026-05-31days on market $160,000 Active 52 DOM
-
2026-05-30days on market $160,000 Active 51 DOM
-
2026-04-09$160,000 Active 614-char remark
Show marketing remark (614 chars)
This popular 2 bedroom, 2 bathroom Bostonian is conveniently located in On Top of the World. The large front porch overlooks a park-like setting and is close to the main entrance which allows for an easy commute to the amenities as well as shopping. The main bedroom has a large walk in closet and updated ensuite bathroom. The spacious kitchen features an abundance of cabinets and has a unique design with a peninsula eating area which can accommodate bar stools. The lanai is the perfect three seasons room with vinyl enclosed windows. This home also features a spacious 2 car garage. Roof was replaced in 2018.
-
2023-07-01historical
-
2023-05-28$249,900 Active
-
2020-11-18soldstatus $115,000
-
2020-11-03soldstatus $115,000
-
2020-09-14$120,500
-
1986-02-01soldstatus $67,800
ⓘ Source: listings_history table (triggers on properties + properties_extension) + one-shot
backfill from property_details.listing_events for pre-trigger history.
Tax reassessment forecast FL · Resets to sale price
- Current annual tax
- $1,721 · $143/mo
- Projected year-2 tax
- $1,721 · $143/mo
- Expected delta
- $0/yr ($0/mo · 0.0%)
ⓘ Screening estimate from a state-policy table — verify with the county assessor before closing.
Climate risk First Street
- Flood 1/10 Low FEMA zone X (unshaded) · 0% chance over 30 yrs
- Wildfire 4/10 Moderate
- Heat 8/10 Severe 7 d/yr ≥107°F today · 22 d/yr by 30 yrs out
- Wind 9/10 Extreme 99% chance of damaging wind over 30 yrs
- Air quality 3/10 Moderate 3 unhealthy d/yr today · 3 by 30 yrs out
Nearby sold comps map
Loading sold comps map…
Walkable amenities ~0.75 mi
Loading nearby amenities…
Taxation est. · year 1
- Rental income
- $19,364
- − Mortgage interest
- −$8,397
- − Property taxes
- −$1,721
- − Insurance
- −$750
- − Repairs & maintenance
- −$1,549
- − Management
- −$1,549
- − HOA
- −$5,916
- − Depreciation
- −$4,361
- Taxable loss
- −$4,878
- Est. tax savings @ 24.0%
- +$1,171
- After-tax cash flow
- $-1,351/yr
For passive investors: Depreciation is non-cash, so a rental often shows a tax loss while cash-flowing — sheltering income. Rental losses are passive: they offset passive income freely, and up to $25,000/yr can offset ordinary (W-2) income if you actively participate and your MAGI is under $100k (phasing out to $0 by $150k); unused losses carry forward. On sale, claimed depreciation is recaptured at up to 25%, and gains may owe capital-gains tax (a 1031 exchange can defer both). Figures are a year-1 estimate at your 24.0% rate — not tax advice; consult a CPA.
Schools (NCES district)
- District
- Marion
- NCES district ID
- 1201260
- Math proficiency
- 42% ▼ -7.00%
- Reading proficiency
- 43% ▼ -4.00%
- Median HH income
- $40,015
- Composite
- 35.61/100
- National rank
- #4890
- State rank
- #61 of 73 in FL
Livability — On Top of the World
No livability data for this city. (Only ~50 U.S. cities are tracked.)
Census & demographics
- Census place
- On Top of the World, FL
- County
- Marion County · 315,796 people
- City population
- 25,668
- Metro
- Ocala, FL
- Population (ZIP)
- 26,782
- Household income
- $57,324
- Rent vs Own
- Severe rent burden
- 313.0
Population outlook (Marion County) Hauer SSP2
- Today (2025)
- 365,905 people
- By 2030
- 376,768 · +3.0%
- By 2040
- 396,555 · +8.4%
- By 2050
- 412,723 · +12.8%
- By 2075
- 446,090 · +21.9%
- By 2100
- 436,193 · +19.2%
Race, ethnicity, and origin ACS 2023
- Neighborhood character
- Predominantly White (80%)
- Race & ethnicity
- White 80% Hispanic / Latino 11% Black 7% Two or more races 5%
- Hispanic origin (detail)
- Mexican 4% Puerto Rican 4% Cuban 1%
- Common ancestry
- Romanian 7% Lithuanian 3% Slovak 2%
- Foreign-born
- 8% · Canada, Jamaica
- Languages at home
- 88% English-only · Spanish 9% French/Haitian/Cajun 1% German/W. Germanic 1%
Political lean MEDSL · Marion
- 2024 margin
- Solid R (+31.6) · D 33.8% · R 65.5%
- 2008→2024 swing
- -20.0pp toward R · 2008: -11.6pp · 2024: -31.6pp
- All cycles
- 2024: R+31.6 2020: R+25.9 2016: R+26.2 2012: R+16.2 2008: R+11.6
Not yet ingested
- Civics
- —
Market trends
- HPI YoY
- ▼ -67.48%
- Current HPI
- 199.986
- Rent YoY
- —
- Metro
- Ocala, FL
- State GDP YoY
- ▲ 3.28%
- F500 in state
- 36
Industry mix (Fortune 500 HQ in FL)
| Industry | F500 HQs | Revenue |
|---|---|---|
| Industrial Technology | 2 | $29B |
|
||
| Insurance | 2 | $17B |
|
||
| Retail | 1 | $60B |
|
||
| Technology Distribution | 1 | $58B |
|
||
| Homebuilding | 1 | $35B |
|
||
| Technology Manufacturing | 1 | $35B |
|
||
Price history
+136.0% since first listed7 events — show timeline
- 2026-04-09 Listed $160,000 Stellar MLS as Distributed by MLS Grid
- 2023-07-01 Listing Removed — Stellar MLS as Distributed by MLS Grid
- 2023-05-28 Listed $249,900 Stellar MLS as Distributed by MLS Grid
- 2020-11-18 Sold (Public Records) $115,000 Public Records
- 2020-11-03 Sold (MLS) $115,000 Stellar MLS as Distributed by MLS Grid
- 2020-09-14 Listed $120,500 Stellar MLS as Distributed by MLS Grid
- 1986-02-01 Sold (Public Records) $67,800 Public Records
Property tax history
+13.8%/yrLatest (2025): $1,721 · +16.1% YoY. Source: county tax records.
Cash-flow waterfall
monthlySold comps — $/sqft
last 12 mo · ≤1 miLoading sold comps…