 🏷️ Likely Rental
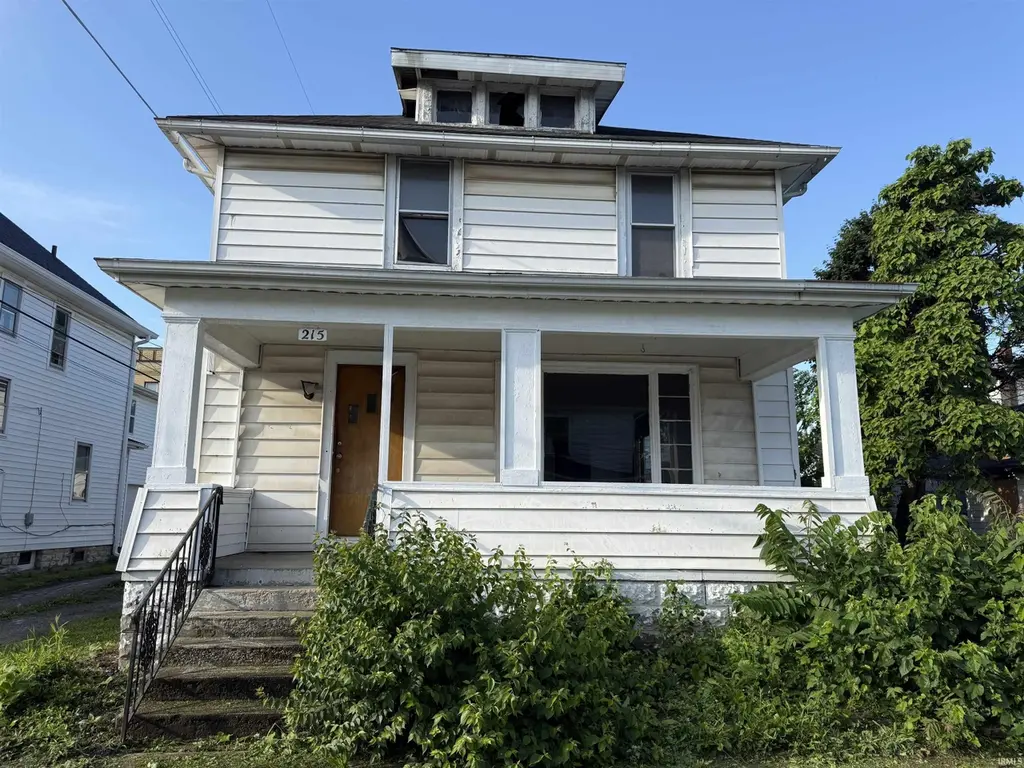
215 W 7th St · Marion, IN
Flood risk 1/10 · Minimal
- FEMA flood zone
- X (unshaded)
- Chance of flooding over 30 yrs
- 0.0%
- Est. flood insurance / yr
- $473 – $860
Fire risk 1/10 · Minimal
- Est. fire insurance / yr
- $717 – $1,331
Heat risk 3/10 · Minor
- Hot days now (above 100°F)
- 7 days/yr
- Hot days in 30 yrs
- 18 days/yr
Wind risk 2/10 · Minimal
- Chance of severe wind over 30 yrs
- —
Air-quality risk 2/10 · Minimal
- Unhealthy air days now
- 1 days/yr
- Unhealthy air days in 30 yrs
- 3 days/yr
Risk factors via First Street. Map © Google.
Why this score? — see what drove the D+ grade
The composite is a weighted blend of 9 inputs, each scored 0–100. Each bar is that input's sub-score; the figure is the points it added to the 100-point composite (weight × sub-score).
- Cash flow +15.0/30.0
- ARV discount +15.0/15.0
- 1% rule +5.0/10.0
- DSCR +5.0/10.0
- Livability +3.2/5.0
- Rent growth +2.5/5.0
- Condition / age +2.5/5.0
- Schools +1.7/10.0
- Appreciation +0.0/10.0
$49,900
🖨 Deal sheet 📄 Offer letter ✓ Due diligence
Multi-family units
County records classify this as Multi-Family (2-4 Unit). Listing-text estimate: 2 units. confirmed
Listing remarks MLS
Motivated Seller ~~ Great Investment Opportunity! This duplex has been vacant for over a year and is ready for your vision and updates. One side features 2 bedrooms and 2 full bathrooms, offering spacious living potential, while the other side includes 1 bedroom and 1 bathroom—perfect for a tenant or guest suite. Whether you're looking to renovate and rent both units or live in one and lease the other, this property offers flexibility and income potential
Key facts
- 2,134 sq ft lot
- 2 parking spots
- Built 1900
Neighborhood map
What this means for you Summary
Snapshot
- This is a 2 × 3-bed/3.0-bath units multifamily listed at $50k.
Deal economics
- At list price, monthly cash flow is $1k ($17k/yr) — positive. Per door: $691/mo.
- The deal already cash-flows at list — no discount required.
- Meets the 1% rule at list price ($2k rent vs $50k).
- Recommended offer: $44k (12.0% below list) — sets the bar for market timing.
- Cap rate 39.5% vs local median 8.7% in Marion — top-decile yield for the area; either an underpriced asset or a hidden risk that comps aren't pricing in. Stress-test before assuming the spread holds.
Location & tenants
- Location reads 65/100 on livability (#337 in IN) — a middle-class / working-renter tenant base. Strengths: crime A+, cost of living A+, housing A+; Watch: schools F, amenities F, commute F.
- Marion Community Schools (town): math 18% / reading 24% proficiency, ranked #277 of 301 in IN (top 92%) — low school quality limits family demand, transient renter base, plan for 1-2y turnover; 67% free/reduced lunch — lower-income household profile, screen leases tightly.
- Market conditions: 124 active listings in the ZIP; 2 comparable units currently listed for rent nearby; 52 units permitted in Grant County in 2024 (8 in 5+ unit buildings).
- At $2,173/mo this rent would consume 49% of the median local household income ($53k/yr) (locally 662% of renters already pay >50% of income on rent) — very limited rent-growth headroom before tenants either downsize or default.
Forward outlook
- Local home prices are declining (-3.0%/yr); year-one equity from $345 of loan paydown is wiped out by about $1k of value loss. Plan a longer hold.
- Grant County population projected at -18% by 2050 — secular population decline; favor cash flow + early exit over multi-decade hold.
- At projected returns (-3.0% appreciation + 3.0% rent growth), your $14k cash investment doubles in ~1 year — after that, you're playing with house money.
Negotiation context
- It's been on market 360 days — a 12% lower offer ($44k) is reasonable based on typical stale-listing flexibility.
Risks & watch-outs
- Watch-outs: built in 1900 — expect roof / HVAC / electrical / plumbing capex.
Questions for the listing agent
- It's been on market 360 days. Have you received any prior offers? Is the seller open to a 12% concession, seller financing, or rate buy-down credit?
- Can we see the unit-by-unit rent roll, current vacancy, and any below-market leases? What's the average tenancy length?
- What capital expenditures (roof, boiler, parking lot, exteriors) have been made in the last 5 years, and what's planned in the next 2?
- Built in 1900 — when were the roof, HVAC, electrical panel, plumbing, and water heater last replaced?
- Why hasn't it sold? Are there any deal-killer items the seller is aware of (foundation, flood, title, zoning, code violations)?
- Is there a deadline driving the sale (1031 exchange, divorce, estate, relocation)? That informs how much negotiation room exists.
- Schools are F-rated, which usually means shorter tenancies and higher turnover. Who's the typical renter profile here, and what's been the actual vacancy rate?
- The area grade is low — what's the realistic commute time and amenity access for the typical tenant pool here? Any planned neighborhood developments (good or bad) we should know about?
- What's the average days-on-market for RENTAL listings here right now (not sales)? A rising rental-DOM trend means longer vacancies and softer asking-rent achievability than the comps imply.
- What's the recent tenant-quality profile in this submarket — average credit score on applications, eviction rate, late-payment / NSF rate, and stable-employment percentage? A property-management company in the area should have these aggregated.
- How much new apartment / multifamily construction is in the pipeline within 1–3 miles? Heavy new supply (>2% of stock underway) typically softens rents 12–24 months out; light construction supports rent growth.
Investment metrics
- 1% rule
- 4.35% ✓
- Cap rate
- 39.55%
- Cash-on-cash
- 118.77%
- DSCR
- 6.28
- GRM
- 1.9
CMA / ARV
- ARV (median comp)
- $71,540
- List price
- $49,900
- Delta
- -30.25%
- Verdict
- UNDERPRICED
- Comps
- 19 within 1.0 mi
Show comp detail 3 sales within ~0.75 mi
| Address | Dist | Beds/Ba | Sqft | Sold | Price | $/sf | Match |
|---|---|---|---|---|---|---|---|
| 920 W 5th St | 0.47mi | 3/2.0 (+1) | 1,896 (-4%) | 2mo | $44,800 | $24 | 60 |
| 1608 S Washington St | 0.61mi | 3/2.0 (+1) | 1,848 (-7%) | 2mo | $55,900 | $30 | 50 |
| 225 N E St | 0.70mi | 3/2.5 (+1) | 2,008 (+1%) | 11mo | $90,008 | $45 | 50 |
Match score weights: distance 35% · size 25% · config 20% · recency 20%. Top-matched comps best support the ARV.
Projected returns pro-forma
-3.0% appreciation · 3.0% rent growth · sell at horizon
- IRR
- —
- Equity multiple
- 6.73×
- Total profit
- $80,015
- Equity at exit
- $7,440
- IRR
- —
- Equity multiple
- 14.11×
- Total profit
- $183,193
- Equity at exit
- $4,314
Cash invested: $13,972 (down + closing). Projections, not guarantees.
Landlord ↔ Tenant lean methodology
- Overall (STATE)
- 90 Strongly Landlord-Friendly
- State Indiana
- 90 Strongly Landlord-Friendly · R+11
- County
- — inherits STATE
- City
- — inherits STATE
ZIP-level market 46952
- Home prices YoY
- -29.9%
- Active inventory
- 124
- Price-to-rent
- 3.8×
Monthly cashflow live
- Estimated rent
- $2,173 medium interval (Pro) →
- Mortgage (P&I)
- −$262
- Tax from tax record
- −$51 /mo · $616/yr
- Insurance
- −$21
- HOA
- −$0
- Vacancy / Maint / Mgmt
- −$456
- Net cashflow
- $1,383
Break-even live
2-unit breakdown (identical units grouped — click to expand)
| Units | Beds | Baths | Est. rent |
|---|---|---|---|
| 2× units | 3 | 3 | $2,172 |
| #1 | 3 | 3 | $1,086 |
| #2 | 3 | 3 | $1,086 |
| Total (2 units) | $2,173 | ||
UW: 25.0% down · 7.5% · 30yr · 1.5% tax · 5.0% vac · 8.0% maint · 8.0% mgmt
Financing live
Cash to close
- Down payment
- $12,475
- Closing costs
- $1,497
- Reserves months
- —
- Total cash needed
- —
Loan-product check · same deal, 3 products live
Conventional
25% down · 7.5% · 30yr
- Down + closing
- —
- Monthly P&I
- —
- Monthly cashflow
- —
- DSCR
- —
- Eligible?
- —
Personal DTI + credit; lowest rate.
DSCR
20% down · 8.5% · 30yr
- Down + closing
- —
- Monthly P&I
- —
- Monthly cashflow
- —
- DSCR
- —
- Eligible?
- —
No personal income docs; deal must DSCR.
Hard money
10% down · 12.0% · 12mo
- Down + closing
- —
- Monthly P&I
- —
- Monthly cashflow
- —
- DSCR
- —
- Eligible?
- —
Short-term bridge; refi at stabilization.
Rent comps 2 comps
| Address | Beds | Baths | Sqft | Rent | $/sqft | DOM | Units | Dist |
|---|---|---|---|---|---|---|---|---|
| 610 S Gallatin St Marion, IN | 1.0 | 1.0 | 2554 | $530 | $0.21 | 43d | 1 | 0.05mi |
| 511 W Buckingham Dr Marion, IN | 3.0 | 2.0 | 1942 | $2,000 | $1.03 | 43d | 1 | 1.12mi |
Listing history 19 events
-
2026-06-19days on market $49,900 Active 360 DOM
-
2026-06-18days on market $49,900 Active 359 DOM
-
2026-06-17days on market $49,900 Active 358 DOM
-
2026-06-16days on market $49,900 Active 357 DOM
-
2026-06-15days on market $49,900 Active 356 DOM
-
2026-06-14days on market $49,900 Active 354 DOM
-
2026-06-12days on market $49,900 Active 353 DOM
-
2026-06-09days on market $49,900 Active 350 DOM
-
2026-06-08days on market $49,900 Active 349 DOM
-
2026-06-07days on market $49,900 Active 348 DOM
-
2026-06-02days on market $49,900 Active 343 DOM
-
2026-06-01days on market $49,900 Active 342 DOM
-
2026-05-31days on market $49,900 Active 341 DOM
-
2026-05-30days on market $49,900 Active 340 DOM
-
2026-04-14price $49,900 465-char remark
Show marketing remark (465 chars)
Motivated Seller ~~ Great Investment Opportunity! This duplex has been vacant for over a year and is ready for your vision and updates. One side features 2 bedrooms and 2 full bathrooms, offering spacious living potential, while the other side includes 1 bedroom and 1 bathroom—perfect for a tenant or guest suite. Whether you're looking to renovate and rent both units or live in one and lease the other, this property offers flexibility and income potential
-
2026-03-30price $52,000 465-char remark
Show marketing remark (465 chars)
Motivated Seller ~~ Great Investment Opportunity! This duplex has been vacant for over a year and is ready for your vision and updates. One side features 2 bedrooms and 2 full bathrooms, offering spacious living potential, while the other side includes 1 bedroom and 1 bathroom—perfect for a tenant or guest suite. Whether you're looking to renovate and rent both units or live in one and lease the other, this property offers flexibility and income potential
-
2026-03-12price $59,000 465-char remark
Show marketing remark (465 chars)
Motivated Seller ~~ Great Investment Opportunity! This duplex has been vacant for over a year and is ready for your vision and updates. One side features 2 bedrooms and 2 full bathrooms, offering spacious living potential, while the other side includes 1 bedroom and 1 bathroom—perfect for a tenant or guest suite. Whether you're looking to renovate and rent both units or live in one and lease the other, this property offers flexibility and income potential
-
2025-08-08price $64,900 465-char remark
Show marketing remark (465 chars)
Motivated Seller ~~ Great Investment Opportunity! This duplex has been vacant for over a year and is ready for your vision and updates. One side features 2 bedrooms and 2 full bathrooms, offering spacious living potential, while the other side includes 1 bedroom and 1 bathroom—perfect for a tenant or guest suite. Whether you're looking to renovate and rent both units or live in one and lease the other, this property offers flexibility and income potential
-
2025-06-24$75,000 Active 465-char remark
Show marketing remark (465 chars)
Motivated Seller ~~ Great Investment Opportunity! This duplex has been vacant for over a year and is ready for your vision and updates. One side features 2 bedrooms and 2 full bathrooms, offering spacious living potential, while the other side includes 1 bedroom and 1 bathroom—perfect for a tenant or guest suite. Whether you're looking to renovate and rent both units or live in one and lease the other, this property offers flexibility and income potential
ⓘ Source: listings_history table (triggers on properties + properties_extension) + one-shot
backfill from property_details.listing_events for pre-trigger history.
Tax reassessment forecast IN · Partial reset (capped growth)
- Current annual tax
- $616 · $51/mo
- Projected year-2 tax
- $616 · $51/mo
- Expected delta
- $0/yr ($0/mo · 0.0%)
ⓘ Screening estimate from a state-policy table — verify with the county assessor before closing.
Climate risk First Street
- Flood 1/10 Low FEMA zone X (unshaded) · 0% chance over 30 yrs
- Wildfire 1/10 Low
- Heat 3/10 Moderate 7 d/yr ≥100°F today · 18 d/yr by 30 yrs out
- Wind 2/10 Low
- Air quality 2/10 Low 1 unhealthy d/yr today · 3 by 30 yrs out
Nearby sold comps map
Loading sold comps map…
Walkable amenities ~0.75 mi
Loading nearby amenities…
Taxation est. · year 1
- Rental income
- $26,076
- − Mortgage interest
- −$2,795
- − Property taxes
- −$616
- − Insurance
- −$250
- − Repairs & maintenance
- −$2,086
- − Management
- −$2,086
- − Depreciation
- −$1,452
- Taxable income
- $16,792
- Est. tax owed @ 24.0%
- −$4,030
- After-tax cash flow
- $12,564/yr
For passive investors: Depreciation is non-cash, so a rental often shows a tax loss while cash-flowing — sheltering income. Rental losses are passive: they offset passive income freely, and up to $25,000/yr can offset ordinary (W-2) income if you actively participate and your MAGI is under $100k (phasing out to $0 by $150k); unused losses carry forward. On sale, claimed depreciation is recaptured at up to 25%, and gains may owe capital-gains tax (a 1031 exchange can defer both). Figures are a year-1 estimate at your 24.0% rate — not tax advice; consult a CPA.
Schools (NCES district)
- District
- Marion Community Schools
- NCES district ID
- 1806390
- Math proficiency
- 18% ▼ -9.00%
- Reading proficiency
- 24% ▼ -6.00%
- Median HH income
- $33,415
- Composite
- 17.13/100
- National rank
- #9115
- State rank
- #277 of 301 in IN
Livability — Marion
- Score
- 65/100
- State rank
- #337
- US rank
- #13006
Category grades
Schools grade is shown separately in the Schools card above.
Census & demographics
- Census place
- Marion, IN
- County
- Grant County · 41,561 people
- City population
- 41,561
- Metro
- Marion, IN
- Population (ZIP)
- 18,189
- Household income
- $52,880
- Rent vs Own
- Severe rent burden
- 662.0
Population outlook (Grant County) Hauer SSP2
- Today (2025)
- 64,394 people
- By 2030
- 62,145 · -3.5%
- By 2040
- 57,252 · -11.1%
- By 2050
- 52,968 · -17.7%
- By 2075
- 45,986 · -28.6%
- By 2100
- 39,400 · -38.8%
Race, ethnicity, and origin ACS 2023
- Neighborhood character
- Predominantly White (84%)
- Race & ethnicity
- White 84% Two or more races 7% Hispanic / Latino 5% Black 4% Asian 1%
- Hispanic origin (detail)
- Mexican 4%
- Common ancestry
- Italian 3% Romanian 1% Iranian 1%
- Foreign-born
- 4% · Canada
- Languages at home
- 96% English-only · Spanish 3%
Political lean MEDSL · Grant
- 2024 margin
- Solid R (+41.8) · D 28.2% · R 70.0% · Other 1.9%
- 2008→2024 swing
- -28.7pp toward R · 2008: -13.1pp · 2024: -41.8pp
- All cycles
- 2024: R+41.8 2020: R+38.8 2016: R+39.5 2012: R+22.0 2008: R+13.1
Not yet ingested
- Civics
- —
Market trends
- HPI YoY
- ▼ -76.69%
- Current HPI
- 180.1174
- Rent YoY
- —
- Metro
- Marion, IN
- State GDP YoY
- ▲ 2.90%
- F500 in state
- 18
Industry mix (Fortune 500 HQ in IN)
| Industry | F500 HQs | Revenue |
|---|---|---|
| Industrial Machinery | 2 | $37B |
|
||
| Healthcare | 1 | $177B |
|
||
| Pharmaceuticals | 1 | $45B |
|
||
| Metals / Steel | 1 | $18B |
|
||
| Agriculture | 1 | $17B |
|
||
| Packaging | 1 | $12B |
|
||
Price history
-33.5% since first listed5 events — show timeline
- 2026-04-14 Price Changed $49,900 IRMLS
- 2026-03-30 Price Changed $52,000 IRMLS
- 2026-03-12 Price Changed $59,000 IRMLS
- 2025-08-08 Price Changed $64,900 IRMLS
- 2025-06-24 Listed $75,000 IRMLS
Property tax history
-2.2%/yrLatest (2025): $616 · +6.9% YoY. Source: county tax records.
Cash-flow waterfall
monthlySold comps — $/sqft
last 12 mo · ≤1 miLoading sold comps…