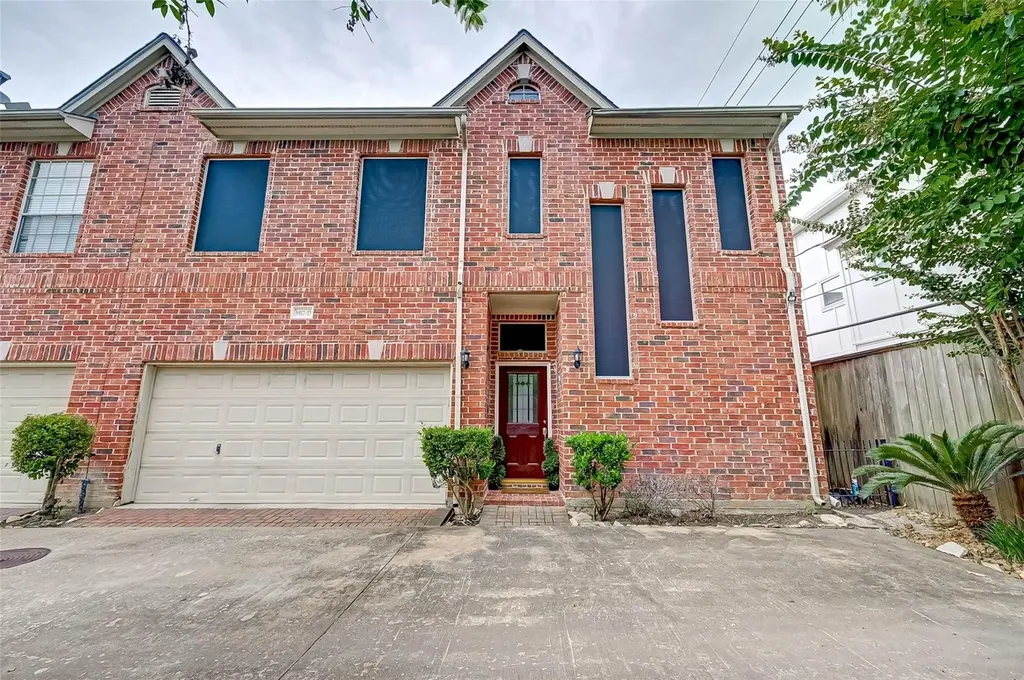
5917 Dolores St Unit D · Houston, TX
Flood risk 3/10 · Minor
- FEMA flood zone
- X (unshaded)
- Chance of flooding over 30 yrs
- 0.1%
- Est. flood insurance / yr
- $507 – $1,088
Fire risk 1/10 · Minimal
- Est. fire insurance / yr
- $1,222 – $2,270
Heat risk 9/10 · Severe
- Hot days now (above 109°F)
- 7 days/yr
- Hot days in 30 yrs
- 24 days/yr
Wind risk 9/10 · Severe
- Chance of severe wind over 30 yrs
- 99.0%
Air-quality risk 2/10 · Minimal
- Unhealthy air days now
- 2 days/yr
- Unhealthy air days in 30 yrs
- 2 days/yr
Risk factors via First Street. Map © Google.
Why this score? — see what drove the D grade
The composite is a weighted blend of 9 inputs, each scored 0–100. Each bar is that input's sub-score; the figure is the points it added to the 100-point composite (weight × sub-score).
- ARV discount +15.0/15.0
- Cash flow +6.8/30.0
- Appreciation +4.4/10.0
- Livability +3.7/5.0
- 1% rule +2.8/10.0
- Schools +2.7/10.0
- Condition / age +2.5/5.0
- Rent growth +2.0/5.0
- DSCR +1.0/10.0
$380,000
🖨 Deal sheet (PDF) 📄 Offer letter ✓ Due diligence
Listing remarks MLS
5917 Dolores St Unit D, Houston, TX 77057 offers a beautifully maintained residence in the highly desirable Galleria/Uptown area, combining comfort, convenience, and modern living. This spacious multi-level home features an open-concept living and dining area filled with natural light, an updated kitchen with modern and ample cabinetry, and generously sized bedrooms with excellent closet space. The property also includes a private garage and is located within a well-maintained community with easy access to major highways, including I-610 and Westheimer, making commuting simple. Just minutes from premier shopping, dining, and entertainment at the Galleria, this home is ideal for both homeowners and investors seeking strong value in a prime Houston location. All the measurements are proximate.
Key facts
- Open concept living
- Private garage
- Updated kitchen
Tags
Neighborhood map
What this means for you Summary
Snapshot
- This is a 3-bed/2.5-bath townhouse listed at $380k.
Deal economics
- At list price, monthly cash flow is $-595 ($-7k/yr) — negative.
- To cash-flow at today's rent, offer at most $275k (27.7% below list).
- To meet the 1% rule (rent ≥ 1% of price), the offer needs to be $297k (21.8% below list).
- Recommended offer: $275k (27.7% below list) — sets the bar for cash-flow.
- Cap rate 4.4% vs local median 3.2% in Houston — top-decile yield for the area; either an underpriced asset or a hidden risk that comps aren't pricing in. Stress-test before assuming the spread holds.
Location & tenants
- Location reads 74/100 on livability (#184 in TX, #4,771 nationally) — a middle-class / working-renter tenant base. Strengths: amenities A+, cost of living A+, housing A+; Watch: crime F.
- Houston ISD (urban): math 27% / reading 35% proficiency, ranked #593 of 826 in TX (top 72%) — families likely to look elsewhere, expect single-tenant / working-renter base with shorter leases; 71% free/reduced lunch — lower-income household profile, screen leases tightly.
- Zoned schools: School At St George Place (math 34% / reading 46%, grade F, #1,514 of 4,322 statewide, top 36%, 782 students, 55% FRL); Tanglewood Middle (math 29% / reading 42%, grade F, #827 of 1,662 statewide, top 51%, 808 students, 62% FRL); Wisdom H S (math 17% / reading 16%, grade F, #1,497 of 1,632 statewide, top 92%, 2,260 students, 97% FRL) — zoned schools at 71% FRL track the district average.
- Market conditions: Rents soft (-1.8%/yr); 392 active listings in the ZIP; 37 comparable units currently listed for rent nearby; rentals at typical pace (median 26d on market — plan ~3-4 weeks tenant-placement turnaround); 46% of comp listings sitting > 30 days — soft ceiling on asking rent; 29,883 units permitted in Harris County in 2024 (8,621 in 5+ unit buildings).
- At $2,970/mo this rent would consume 53% of the median local household income ($67k/yr) (locally 3533% of renters already pay >50% of income on rent) — very limited rent-growth headroom before tenants either downsize or default.
Forward outlook
- Local home prices are declining (-1.2%/yr); year-one equity from $3k of loan paydown is wiped out by about $5k of value loss. Plan a longer hold.
- Harris County population projected at +47% by 2050 — long-run rental-demand tailwind backs the buy-and-hold thesis.
Negotiation context
- It's been on market 66 days — a 6% lower offer ($357k) is reasonable based on typical stale-listing flexibility.
- 7 sale attempts since 24y ago; this cycle's ask has dropped $35k (8%) from the opening price — seller is motivated, your offer sets the floor, not the list.
- Current owner paid $226k; list at $380k implies a 68% gain — meaningful room to come down on a strong offer.
Risks & watch-outs
- Climate carrying-cost: severe wind risk, 99% chance of damaging wind over 30y; extreme-heat days projected 7→24/yr by 2055 (HVAC capex compounding) — expect insurance premiums to compound above CPI over the hold.
Questions for the listing agent
- What do current leases actually rent for vs. the listed asking? Can we see a recent rent roll and the last 12 months of T-12 income?
- It's been on market 66 days. Have you received any prior offers? Is the seller open to a 28% concession, seller financing, or rate buy-down credit?
- What does the HOA fee cover, when was the last increase, and are there any pending special assessments or reserve-fund shortfalls?
- Why hasn't it sold? Are there any deal-killer items the seller is aware of (foundation, flood, title, zoning, code violations)?
- Is there a deadline driving the sale (1031 exchange, divorce, estate, relocation)? That informs how much negotiation room exists.
- Schools are D-rated, which usually means shorter tenancies and higher turnover. Who's the typical renter profile here, and what's been the actual vacancy rate?
- Crime grade is F in this area — have there been break-ins, vandalism, or insurance claims at this property in the last 3 years? What carrier currently insures it and at what premium?
- The area grade is low — what's the realistic commute time and amenity access for the typical tenant pool here? Any planned neighborhood developments (good or bad) we should know about?
- What's the average days-on-market for RENTAL listings here right now (not sales)? A rising rental-DOM trend means longer vacancies and softer asking-rent achievability than the comps imply.
- What's the recent tenant-quality profile in this submarket — average credit score on applications, eviction rate, late-payment / NSF rate, and stable-employment percentage? A property-management company in the area should have these aggregated.
- How much new for-sale + rental construction is in the pipeline within 1–3 miles? Heavy new supply typically softens prices + rents 12–24 months out; constrained supply supports both.
Investment metrics
- 1% rule
- 0.78% ✗
- Cap rate
- 4.41%
- Cash-on-cash
- -6.71%
- DSCR
- 0.70
- GRM
- 10.7
CMA / ARV
- ARV (median comp)
- $492,743
- List price
- $380,000
- Delta
- -22.88%
- Verdict
- UNDERPRICED
- Comps
- 20 within 1.0 mi
Show comp detail 12 sales within ~0.75 mi
| Address | Dist | Beds/Ba | Sqft | Sold | Price | $/sf | Match |
|---|---|---|---|---|---|---|---|
| 2945 Sandcastle Ln | 0.22mi | 3/2.5 | 2,377 (-4%) | 1mo | $349,000 | $147 | 83 |
| 2820 Bering Dr | 0.19mi | 3/2.5 | 2,192 (-11%) | 7mo | $399,900 | $182 | 67 |
| 5563 Beverlyhill St | 0.53mi | 3/2.5 | 2,334 (-5%) | 7mo | $449,900 | $193 | 61 |
| 2464 Bering Dr #2464 | 0.54mi | 2/2.5 (-1) | 2,370 (-4%) | 6mo | $270,000 | $114 | 58 |
| 2527 Potomac Dr Unit B | 0.50mi | 3/2.5 | 2,336 (-5%) | 13mo | $549,999 | $235 | 57 |
| 5591 Beverlyhill St | 0.50mi | 3/2.5 | 2,334 (-5%) | 14mo | $625,000 | $268 | 56 |
| 2506 Potomac Dr Unit A | 0.58mi | 3/2.5 | 2,690 (+9%) | 2mo | $535,000 | $199 | 56 |
| 5583 Beverlyhill St | 0.51mi | 3/2.5 | 2,334 (-5%) | 18mo | $499,900 | $214 | 52 |
| 2309 Nantucket Dr Unit A | 0.67mi | 3/2.5 | 2,427 (-2%) | 16mo | $425,000 | $175 | 52 |
| 2435 Nantucket Dr | 0.53mi | 3/2.5 | 2,259 (-8%) | 20mo | $535,000 | $237 | 45 |
| 2421 Potomac Dr Unit C | 0.60mi | 3/2.5 | 2,113 (-14%) | 7mo | $510,000 | $241 | 42 |
| 3001 Falls At Fairdale | 0.62mi | 4/3.5 (+1) | 2,754 (+12%) | 18mo | $415,000 | $151 | 27 |
Match score weights: distance 35% · size 25% · config 20% · recency 20%. Top-matched comps best support the ARV.
Projected returns pro-forma
-1.23% appreciation · 0.0% rent growth · sell at horizon
- IRR
- -18.3%
- Equity multiple
- 0.26×
- Total profit
- $-78,931
- Equity at exit
- $87,516
- IRR
- -15.1%
- Equity multiple
- -0.16×
- Total profit
- $-123,284
- Equity at exit
- $88,357
Cash invested: $106,400 (down + closing). Projections, not guarantees.
Landlord ↔ Tenant lean methodology
- Overall (STATE)
- 87 Strongly Landlord-Friendly
- State Texas
- 87 Strongly Landlord-Friendly · R+5
- County
- — inherits STATE
- City
- — inherits STATE
ZIP-level market 77057
- Home prices YoY
- -0.7%
- Rents YoY
- -1.8%
- Active inventory
- 392
- Price-to-rent
- 10.7×
Monthly cashflow live
- Estimated rent
- $2,970 high interval (Pro) →
- Mortgage (P&I)
- −$1,993
- Tax from tax record
- −$660 /mo · $7,926/yr
- Insurance
- −$158
- HOA
- −$130
- Vacancy / Maint / Mgmt
- −$624
- Net cashflow
- $-595
Break-even live
Sensitivity live
| Price | -10% $-380 | -5% $-487 | +0% $-595 | +5% $-703 | +10% $-810 |
|---|---|---|---|---|---|
| Rent | -10% $-830 | -5% $-712 | +0% $-595 | +5% $-478 | +10% $-360 |
| Rate | -1.0pp $-404 | -0.5pp $-498 | base $-595 | +0.5pp $-693 | +1.0pp $-794 |
UW: 25.0% down · 7.5% · 30yr · 1.5% tax · 5.0% vac · 8.0% maint · 8.0% mgmt
Financing live
Cash to close
- Down payment
- $95,000
- Closing costs
- $11,400
- Reserves months
- —
- Total cash needed
- —
Loan-product check · same deal, 3 products live
Conventional
25% down · 7.5% · 30yr
- Down + closing
- —
- Monthly P&I
- —
- Monthly cashflow
- —
- DSCR
- —
- Eligible?
- —
Personal DTI + credit; lowest rate.
DSCR
20% down · 8.5% · 30yr
- Down + closing
- —
- Monthly P&I
- —
- Monthly cashflow
- —
- DSCR
- —
- Eligible?
- —
No personal income docs; deal must DSCR.
Hard money
10% down · 12.0% · 12mo
- Down + closing
- —
- Monthly P&I
- —
- Monthly cashflow
- —
- DSCR
- —
- Eligible?
- —
Short-term bridge; refi at stabilization.
Rent comps 37 comps
| Address | Beds | Baths | Sqft | Rent | $/sqft | DOM | Units | Dist |
|---|---|---|---|---|---|---|---|---|
| 5815 Fairdale Ln Houston, TX | 3.0 | 4.0 | 2047 | $2,800 | $1.37 | 45d | 1 | 0.13mi |
| 5733 Winsome Ln Houston, TX | 3.0 | 3.5 | 2481 | $4,000 | $1.61 | 14d | 1 | 0.19mi |
| 5914 Val Verde St Houston, TX | 3.0 | 4.0 | 2036 | $3,900 | $1.92 | 45d | 1 | 0.20mi |
| 5640 Dolores St Houston, TX | 3.0 | 4.0 | 2144 | $3,999 | $1.87 | 45d | 1 | 0.27mi |
| 5625 Dolores St Houston, TX | 4.0 | 4.0 | 2935 | $4,500 | $1.53 | 45d | 1 | 0.30mi |
| 5615 Winsome Ln Houston, TX | 4.0 | 4.0 | 3150 | $3,195 | $1.01 | 45d | 1 | 0.33mi |
| 2425 Fountain View Dr Unit 210 Houston, TX | 2.0 | 1.0 | 2410 | $2,000 | $0.83 | 45d | 1 | 0.40mi |
| 2468 Bering Dr Houston, TX | 2.0 | 3.0 | 1808 | $2,200 | $1.22 | 45d | 1 | 0.52mi |
| 2454 Bering Dr Houston, TX | 3.0 | 2.5 | 2150 | $2,800 | $1.30 | 45d | 1 | 0.52mi |
| 2380 Bering Dr Houston, TX | 2.0 | 2.0 | 1720 | $2,357 | $1.37 | 45d | 1 | 0.57mi |
| 2351 Bering Dr Houston, TX | 3.0 | 3.0 | 1776 | $2,440 | $1.37 | 24d | 1 | 0.59mi |
| 2351 Bering Dr Houston, TX | 3.0 | 3.0 | 1776 | $2,440 | $1.37 | 45d | 1 | 0.59mi |
| 2345 Bering Dr Houston, TX | 1.0–3.0 | 1.0–3.0 | 1313 | $2,329 | $1.77 | 4d | 17 | 0.59mi |
| 2226 Nantucket Dr Unit A Houston, TX | 3.0 | 2.5 | 2304 | $2,600 | $1.13 | 26d | 1 | 0.71mi |
| 6353 Richmond Ave Houston, TX | 3.0 | 2.0–2.5 | 1666 | $2,224 | $1.33 | 45d | 3 | 0.73mi |
| 6353 Richmond Ave Houston, TX | 3.0 | 2.0–2.5 | 1666 | $2,197 | $1.32 | 26d | 2 | 0.73mi |
| 6353 Richmond Ave Houston, TX | 3.0 | 2.0–2.5 | 1666 | $2,197 | $1.32 | 0d | 2 | 0.73mi |
| 5421 Judalon Ln Houston, TX | 3.0 | 2.0 | 1740 | $3,600 | $2.07 | 45d | 1 | 0.77mi |
| 5331 Beverly Hill St Houston, TX | 1.0–4.0 | 1.0–2.5 | 1420 | $1,688 | $1.19 | 0d | 86 | 0.77mi |
| 6130 Southwest Fwy Houston, TX | 4.0 | 1.0–2.0 | 1170 | $1,875 | $1.60 | 15d | 20 | 0.81mi |
| 2927 El Fenice Ln Houston, TX | 3.0 | 3.0 | 2181 | $3,200 | $1.47 | 45d | 1 | 0.81mi |
| 2909 El Fenice Ln Unit 1538926P Houston, TX | 3.0 | 2.5 | 2249 | $7,906 | $3.52 | 17d | 1 | 0.81mi |
| 2914 El Fenice Ln Unit 1538927P Houston, TX | 3.0 | 2.5 | 2249 | $7,906 | $3.52 | 16d | 1 | 0.83mi |
| 2926 El Fenice Ln Unit 1514060P Houston, TX | 3.0 | 2.5 | 2174 | $6,326 | $2.91 | 1d | 1 | 0.83mi |
| 2926 El Fenice Ln Unit 1514061P Houston, TX | 3.0 | 2.5 | 2292 | $6,039 | $2.63 | 45d | 1 | 0.83mi |
| 2910 El Fenice Ln Unit 1538928P Houston, TX | 3.0 | 2.5 | 2249 | $6,426 | $2.86 | 7d | 1 | 0.83mi |
| 2912 El Fenice Ln Unit 1538929P Houston, TX | 3.0 | 2.5 | 2249 | $7,906 | $3.52 | 22d | 1 | 0.83mi |
| 2908 El Fenice Ln Unit 1538925P Houston, TX | 3.0 | 2.5 | 2249 | $7,906 | $3.52 | 16d | 1 | 0.83mi |
| 3319 Bingham Manor Ln Houston, TX | 3.0 | 4.0 | 2866 | $2,900 | $1.01 | 45d | 1 | 0.90mi |
| 3000 Sage Rd Houston, TX | 1.0–2.0 | 1.0–2.0 | 1225 | $1,870 | $1.53 | 1d | 33 | 0.94mi |
| 6463 Burgoyne Rd #35 Houston, TX | 2.0 | 2.5 | 1596 | $1,980 | $1.24 | 45d | 1 | 1.10mi |
| 2345 Sage Rd Houston, TX | 1.0–3.0 | 1.0–3.0 | 1203 | $2,520 | $2.09 | 4d | 39 | 1.22mi |
| 1441 Bering Dr Houston, TX | 2.0 | 2.5 | 1767 | $2,312 | $1.31 | 3d | 3 | 1.27mi |
| 2525 McCue Rd Unit 354 Houston, TX | 3.0 | 2.0 | 1750 | $1,900 | $1.09 | 45d | 1 | 1.34mi |
| 2525 McCue Rd Houston, TX | 1.0–3.0 | 1.0–2.0 | 1235 | $2,545 | $2.06 | 1d | 23 | 1.34mi |
| 2323 McCue Rd Houston, TX | 3.0 | 1.0–3.0 | 1540 | $4,850 | $3.15 | 0d | 12 | 1.35mi |
| 1112 Bering Dr #67 Houston, TX | 2.0 | 2.5 | 1610 | $2,200 | $1.37 | 26d | 1 | 1.39mi |
HOA detail
- Monthly dues
- $130 · $1,560/yr
Listing history 33 events
-
2026-06-21days on market $380,000 Active 66 DOM
-
2026-06-18days on market $380,000 Active 63 DOM
-
2026-06-17days on market $380,000 Active 62 DOM
-
2026-06-16days on market $380,000 Active 61 DOM
-
2026-06-15days on market $380,000 Active 60 DOM
-
2026-06-13days on market $380,000 Active 58 DOM
-
2026-06-10days on market $380,000 Active 54 DOM
-
2026-06-08days on market $380,000 Active 53 DOM
-
2026-06-07pricedays on market $380,000 Active 52 DOM
-
2026-06-04days on market $395,000 Active 49 DOM
-
2026-06-01days on market $395,000 Active 46 DOM
-
2026-05-31days on market $395,000 Active 45 DOM
-
2026-05-02price $395,000 803-char remark
Show marketing remark (803 chars)
5917 Dolores St Unit D, Houston, TX 77057 offers a beautifully maintained residence in the highly desirable Galleria/Uptown area, combining comfort, convenience, and modern living. This spacious multi-level home features an open-concept living and dining area filled with natural light, an updated kitchen with modern and ample cabinetry, and generously sized bedrooms with excellent closet space. The property also includes a private garage and is located within a well-maintained community with easy access to major highways, including I-610 and Westheimer, making commuting simple. Just minutes from premier shopping, dining, and entertainment at the Galleria, this home is ideal for both homeowners and investors seeking strong value in a prime Houston location. All the measurements are proximate.
-
2026-04-16$415,000 Active 803-char remark
Show marketing remark (803 chars)
5917 Dolores St Unit D, Houston, TX 77057 offers a beautifully maintained residence in the highly desirable Galleria/Uptown area, combining comfort, convenience, and modern living. This spacious multi-level home features an open-concept living and dining area filled with natural light, an updated kitchen with modern and ample cabinetry, and generously sized bedrooms with excellent closet space. The property also includes a private garage and is located within a well-maintained community with easy access to major highways, including I-610 and Westheimer, making commuting simple. Just minutes from premier shopping, dining, and entertainment at the Galleria, this home is ideal for both homeowners and investors seeking strong value in a prime Houston location. All the measurements are proximate.
-
2021-10-08historical
-
2021-10-01price $344,900
-
2021-09-05status Active
-
2021-09-04status Option Pending
-
2021-08-14price $349,900
-
2021-08-07$359,000 Active
-
2020-07-05historical
-
2020-02-02price $324,900
-
2019-12-19price $329,000
-
2019-11-01$333,000 Active
-
2019-01-04historical
-
2018-10-18$345,000 Active
-
2017-09-10historical
-
2017-07-08price $375,000
-
2017-06-09$382,000 Active
-
2002-03-12historical
-
2002-03-08$264,900
-
2000-01-01soldstatus
-
1999-08-01soldstatus $225,900
ⓘ Source: listings_history table (triggers on properties + properties_extension) + one-shot
backfill from property_details.listing_events for pre-trigger history.
Tax reassessment forecast TX · Resets to sale price
- Current annual tax
- $7,926 · $660/mo
- Projected year-2 tax
- $7,926 · $660/mo
- Expected delta
- $0/yr ($0/mo · 0.0%)
ⓘ Screening estimate from a state-policy table — verify with the county assessor before closing.
Climate risk First Street
- Flood 3/10 Moderate FEMA zone X (unshaded) · 10% chance over 30 yrs
- Wildfire 1/10 Low
- Heat 9/10 Extreme 7 d/yr ≥109°F today · 24 d/yr by 30 yrs out
- Wind 9/10 Extreme 99% chance of damaging wind over 30 yrs
- Air quality 2/10 Low 2 unhealthy d/yr today · 2 by 30 yrs out
Nearby sold comps map
Loading sold comps map…
Walkable amenities ~0.75 mi
Loading nearby amenities…
Taxation est. · year 1
- Rental income
- $35,645
- − Mortgage interest
- −$21,286
- − Property taxes
- −$7,926
- − Insurance
- −$1,900
- − Repairs & maintenance
- −$2,852
- − Management
- −$2,852
- − HOA
- −$1,560
- − Depreciation
- −$11,055
- Taxable loss
- −$13,785
- Est. tax savings @ 24.0%
- +$3,308
- After-tax cash flow
- $-3,831/yr
For passive investors: Depreciation is non-cash, so a rental often shows a tax loss while cash-flowing — sheltering income. Rental losses are passive: they offset passive income freely, and up to $25,000/yr can offset ordinary (W-2) income if you actively participate and your MAGI is under $100k (phasing out to $0 by $150k); unused losses carry forward. On sale, claimed depreciation is recaptured at up to 25%, and gains may owe capital-gains tax (a 1031 exchange can defer both). Figures are a year-1 estimate at your 24.0% rate — not tax advice; consult a CPA.
Schools (NCES district)
- District
- Houston ISD
- NCES district ID
- 4823640
- Math proficiency
- 27% ▼ -18.00%
- Reading proficiency
- 35% ▼ -6.00%
- Median HH income
- $46,054
- Composite
- 26.63/100
- National rank
- #7173
- State rank
- #593 of 826 in TX
Livability — Houston
- Score
- 74/100
- State rank
- #184
- US rank
- #4771
Category grades
Schools grade is shown separately in the Schools card above.
Census & demographics
- Census place
- Houston, TX
- County
- Harris County · 4,702,590 people
- City population
- 3,226,434
- Metro
- Houston-The Woodlands-Sugar Land, TX
- Population (ZIP)
- 46,569
- Household income
- $66,971
- Rent vs Own
- Severe rent burden
- 3533.0
Population outlook (Harris County) Hauer SSP2
- Today (2025)
- 5,571,493 people
- By 2030
- 6,089,821 · +9.3%
- By 2040
- 7,142,806 · +28.2%
- By 2050
- 8,185,864 · +46.9%
- By 2075
- 10,574,329 · +89.8%
- By 2100
- 12,109,958 · +117.4%
Race, ethnicity, and origin ACS 2023
- Neighborhood character
- Diverse neighborhood (Simpson 0.69)
- Race & ethnicity
- Hispanic / Latino 38% White 37% Two or more races 22% Black 12% Asian 10% Native American 1%
- Hispanic origin (detail)
- Mexican 13% Cuban 1%
- Common ancestry
- Italian 3% Lithuanian 2% Slovak 1%
- Foreign-born
- 38% · Canada, China, Jamaica
- Languages at home
- 50% English-only · Spanish 33% Other Indo-European 6% Other Asian/Pacific 3%
Political lean MEDSL · Harris
- 2024 margin
- Lean D (+5.5) · D 52.0% · R 46.4% · Other 1.6%
- 2008→2024 swing
- +3.9pp toward D · 2008: 1.6pp · 2024: 5.5pp
- All cycles
- 2024: D+5.5 2020: D+13.3 2016: D+12.4 2012: D+0.1 2008: D+1.6
Not yet ingested
- Civics
- —
Market trends
- HPI YoY
- ▼ -1.23%
- Current HPI
- 167.8863
- Rent YoY
- ▼ -1.83%
- Metro
- Houston-The Woodlands-Sugar Land, TX
- State GDP YoY
- ▲ 3.95%
- F500 in state
- 110
Industry mix (Fortune 500 HQ in TX)
| Industry | F500 HQs | Revenue |
|---|---|---|
| Energy | 16 | $1,198B |
|
||
| Technology | 5 | $198B |
|
||
| Engineering / Construction | 4 | $72B |
|
||
| Energy Services | 3 | $60B |
|
||
| Utilities | 3 | $41B |
|
||
| Healthcare | 2 | $330B |
|
||
Price history
+74.9% since first listed21 events — show timeline
- 2026-05-02 Price Changed $395,000 HARMLS
- 2026-04-16 Listed $415,000 HARMLS
- 2021-10-08 Listing Removed — HARMLS
- 2021-10-01 Price Changed $344,900 HARMLS
- 2021-09-05 Relisted — HARMLS
- 2021-09-04 Pending — HARMLS
- 2021-08-14 Price Changed $349,900 HARMLS
- 2021-08-07 Listed $359,000 HARMLS
- 2020-07-05 Listing Removed — HARMLS
- 2020-02-02 Price Changed $324,900 HARMLS
- 2019-12-19 Price Changed $329,000 HARMLS
- 2019-11-01 Listed $333,000 HARMLS
- 2019-01-04 Listing Removed — HARMLS
- 2018-10-18 Listed $345,000 HARMLS
- 2017-09-10 Listing Removed — HARMLS
- 2017-07-08 Price Changed $375,000 HARMLS
- 2017-06-09 Listed $382,000 HARMLS
- 2002-03-12 Listing Removed — HARMLS
- 2002-03-08 Listed $264,900 HARMLS
- 2000-01-01 Sold (Public Records) — Public Records
- 1999-08-01 Sold (Public Records) $225,900 Public Records
Property tax history
+0.4%/yrLatest (2025): $7,926 · +0.3% YoY. Source: county tax records.
Cash-flow waterfall
monthlySold comps — $/sqft
last 12 mo · ≤1 miLoading sold comps…