 Duplex
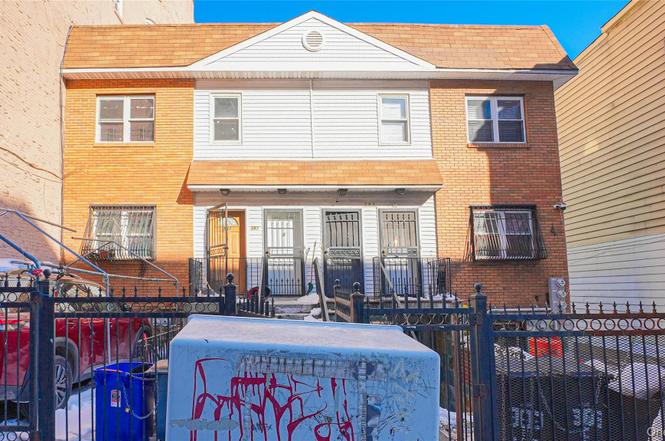
381 E 152nd St · New York, NY
Flood risk 1/10 · Minimal
- FEMA flood zone
- X (unshaded)
- Chance of flooding over 30 yrs
- 0.0%
- Est. flood insurance / yr
- $507 – $1,088
Fire risk 1/10 · Minimal
- Est. fire insurance / yr
- $691 – $1,283
Heat risk 6/10 · Moderate
- Hot days now (above 99°F)
- 7 days/yr
- Hot days in 30 yrs
- 15 days/yr
Wind risk 6/10 · Moderate
- Chance of severe wind over 30 yrs
- 27.0%
Air-quality risk 4/10 · Minor
- Unhealthy air days now
- 5 days/yr
- Unhealthy air days in 30 yrs
- 6 days/yr
Risk factors via First Street. Map © Google.
Why this score? — see what drove the C grade
The composite is a weighted blend of 9 inputs, each scored 0–100. Each bar is that input's sub-score; the figure is the points it added to the 100-point composite (weight × sub-score).
- Cash flow +21.4/30.0
- DSCR +6.8/10.0
- ARV discount +6.8/15.0
- Appreciation +6.1/10.0
- 1% rule +5.0/10.0
- Schools +5.0/10.0
- Livability +3.8/5.0
- Rent growth +2.5/5.0
- Condition / age +2.5/5.0
$920,000
🖨 Deal sheet 📄 Offer letter ✓ Due diligence
Multi-family units
County records classify this as Multi-Family (2-4 Unit). Listing-text estimate: 2 units. confirmed
Listing remarks
Well-maintained two-family home in the Melrose section of the Bronx featuring two spacious units, modern construction, and excellent income potential. Built in 2001, this property offers approximately 2,800+ sq ft of living space, separate layouts, forced-air heating, and a private lot. Conveniently located near transportation, shopping, and neighborhood amenities, this is a fantastic opportunity for investors or owner-occupants seeking rental income. Don’t miss this turnkey multi-family gem!
Key facts
- Modern construction
- Private lot
- Two family home
Tags
Property features AI
Exterior
- Parking: Driveway
- Utilities: Public sewer; Electricity connected; Natural gas connected; Sewer connected; Water connected
- Home design: Duplex
- Construction: Insulated concrete form (ICF) construction; Vinyl siding
- Exterior features: Not waterfront
Interior
- Bedrooms: Bedroom on the first floor
- Bathrooms: Full bathroom on the first floor
- Heating & cooling: Natural gas heating; Wall/window air conditioning units
- Interior features: First-floor bedroom; First-floor full bathroom; Common basement
Neighborhood map
What this means for you Summary
Snapshot
- This is a 2 × 2-bed/?-bath units multifamily listed at $920k.
Deal economics
- At list price, monthly cash flow is $1k ($16k/yr) — positive. Per door: $685/mo.
- The deal already cash-flows at list — no discount required.
- To meet the 1% rule (rent ≥ 1% of price), the offer needs to be $916k (0.4% below list).
- Recommended offer: $810k (12.0% below list) — sets the bar for market timing.
- Cap rate 8.1% vs local median 2.6% in New York — top-decile yield for the area; either an underpriced asset or a hidden risk that comps aren't pricing in. Stress-test before assuming the spread holds.
Location & tenants
- Location reads 75/100 on livability (#268 in NY, #4,188 nationally) — a middle-class / working-renter tenant base. Strengths: amenities A+, commute A+, health & safety A; Watch: crime F, cost of living F.
- Market conditions: 26 active listings in the ZIP; 2 comparable units currently listed for rent nearby; 6,929 units permitted in Bronx County in 2024 (6,829 in 5+ unit buildings).
Forward outlook
- In year one you build about $26k of equity ($6k loan paydown + $20k appreciation (2.1% local appreciation)).
- Bronx County population projected at +21% by 2050 — long-run rental-demand tailwind backs the buy-and-hold thesis.
- At projected returns (2.1% appreciation + 3.0% rent growth), your $258k cash investment doubles in ~6 years — after that, you're playing with house money.
- By year 3, paydown + projected appreciation supports a ~$66k cash-out refi (75% LTV) — recoverable capital for the next deal without selling this one.
Negotiation context
- It's been on market 136 days — a 12% lower offer ($810k) is reasonable based on typical stale-listing flexibility.
Risks & watch-outs
- Climate carrying-cost: major wind risk, 27% chance of damaging wind over 30y; extreme-heat days projected 7→15/yr by 2055 (HVAC capex compounding) — expect insurance premiums to compound above CPI over the hold.
Questions for the listing agent
- It's been on market 136 days. Have you received any prior offers? Is the seller open to a 12% concession, seller financing, or rate buy-down credit?
- Can we see the unit-by-unit rent roll, current vacancy, and any below-market leases? What's the average tenancy length?
- What capital expenditures (roof, boiler, parking lot, exteriors) have been made in the last 5 years, and what's planned in the next 2?
- Why hasn't it sold? Are there any deal-killer items the seller is aware of (foundation, flood, title, zoning, code violations)?
- Is there a deadline driving the sale (1031 exchange, divorce, estate, relocation)? That informs how much negotiation room exists.
- Schools are B-rated — typically a magnet for longer-tenancy family renters. What's the average tenant stay here, and is there a school-zone premium baked into asking?
- Crime grade is F in this area — have there been break-ins, vandalism, or insurance claims at this property in the last 3 years? What carrier currently insures it and at what premium?
- What's the average days-on-market for RENTAL listings here right now (not sales)? A rising rental-DOM trend means longer vacancies and softer asking-rent achievability than the comps imply.
- What's the recent tenant-quality profile in this submarket — average credit score on applications, eviction rate, late-payment / NSF rate, and stable-employment percentage? A property-management company in the area should have these aggregated.
- How much new apartment / multifamily construction is in the pipeline within 1–3 miles? Heavy new supply (>2% of stock underway) typically softens rents 12–24 months out; light construction supports rent growth.
Investment metrics
- 1% rule
- 1.00% ✗
- Cap rate
- 8.08%
- Cash-on-cash
- 6.38%
- DSCR
- 1.28
- GRM
- 8.4
CMA / ARV
- ARV (on-the-fly)
- $906,598
- Comps found
- 8
Show comp detail 8 sales within ~0.75 mi
| Address | Dist | Beds/Ba | Sqft | Sold | Price | $/sf | Match |
|---|---|---|---|---|---|---|---|
| 322 E 151st St | 0.13mi | 4/4.0 | 2,880 (+1%) | 8mo | $1,350,000 | $469 | 85 |
| 299 E 150th St | 0.20mi | 7/3.0 | 2,970 (+4%) | 2mo | $875,000 | $295 | 81 |
| 694 Saint Anns Ave | 0.35mi | 5/3.5 | 2,820 (-1%) | 17mo | $975,000 | $346 | 68 |
| 810 Courtlandt Ave | 0.32mi | 3/— | 3,132 (+10%) | 3mo | $1,070,000 | $342 | 66 |
| 644 St Anns Ave | 0.34mi | 5/2.5 | 2,700 (-5%) | 15mo | $787,000 | $291 | 63 |
| 784 Elton Ave | 0.30mi | 7/3.0 | 3,036 (+7%) | 19mo | $920,000 | $303 | 59 |
| 713 Eagle Ave | 0.38mi | 10/3.0 | 2,970 (+4%) | 22mo | $948,200 | $319 | 56 |
| 426 E 159th St | 0.34mi | 5/4.0 | 3,132 (+10%) | 22mo | $999,000 | $319 | 49 |
Match score weights: distance 35% · size 25% · config 20% · recency 20%. Top-matched comps best support the ARV.
Projected returns pro-forma
2.14% appreciation · 3.0% rent growth · sell at horizon
- IRR
- 11.2%
- Equity multiple
- 1.61×
- Total profit
- $156,554
- Equity at exit
- $369,729
- IRR
- 13.9%
- Equity multiple
- 2.90×
- Total profit
- $488,283
- Equity at exit
- $537,733
Cash invested: $257,600 (down + closing). Projections, not guarantees.
Landlord ↔ Tenant lean methodology
- Overall (CITY)
- 0 Strongly Tenant-Friendly
- State New York
- 15 Strongly Tenant-Friendly · D+10
- County
- — inherits STATE
- City New York
- 0 Strongly Tenant-Friendly · D+34
ZIP-level market 10455
- Home prices YoY
- 1.5%
- Active inventory
- 26
- Price-to-rent
- 16.7×
Monthly cashflow live
- Estimated rent
- $9,160 medium interval (Pro) →
- Mortgage (P&I)
- −$4,825
- Tax from tax record
- −$659 /mo · $7,913/yr
- Insurance
- −$383
- HOA
- −$0
- Vacancy / Maint / Mgmt
- −$1,924
- Net cashflow
- $1,369
Break-even live
2-unit breakdown (identical units grouped — click to expand)
| Units | Beds | Baths | Est. rent |
|---|---|---|---|
| 2× units | 2 | — | $9,160 |
| #1 | 2 | — | $4,580 |
| #2 | 2 | — | $4,580 |
| Total (2 units) | $9,160 | ||
UW: 25.0% down · 7.5% · 30yr · 1.5% tax · 5.0% vac · 8.0% maint · 8.0% mgmt
Financing live
Cash to close
- Down payment
- $230,000
- Closing costs
- $27,600
- Reserves months
- —
- Total cash needed
- —
Loan-product check · same deal, 3 products live
Conventional
25% down · 7.5% · 30yr
- Down + closing
- —
- Monthly P&I
- —
- Monthly cashflow
- —
- DSCR
- —
- Eligible?
- —
Personal DTI + credit; lowest rate.
DSCR
20% down · 8.5% · 30yr
- Down + closing
- —
- Monthly P&I
- —
- Monthly cashflow
- —
- DSCR
- —
- Eligible?
- —
No personal income docs; deal must DSCR.
Hard money
10% down · 12.0% · 12mo
- Down + closing
- —
- Monthly P&I
- —
- Monthly cashflow
- —
- DSCR
- —
- Eligible?
- —
Short-term bridge; refi at stabilization.
Rent comps 2 comps
| Address | Beds | Baths | Sqft | Rent | $/sqft | DOM | Units | Dist |
|---|---|---|---|---|---|---|---|---|
| 114 W 131st St Apt 2 New York, NY | 3.0 | 2.0 | 2000 | $6,750 | $3.38 | 24d | 1 | 1.44mi |
| 114 W 131st St Apt 2 New York, NY | 3.0 | 2.0 | 2000 | $6,150 | $3.08 | 17d | 1 | 1.44mi |
Listing history 11 events
-
2026-06-18days on market $920,000 Active 136 DOM
-
2026-06-17days on market $920,000 Active 135 DOM
-
2026-06-15days on market $920,000 Active 133 DOM
-
2026-06-13days on market $920,000 Active 131 DOM
-
2026-06-10days on market $920,000 Active 127 DOM
-
2026-06-08days on market $920,000 Active 126 DOM
-
2026-06-04days on market $920,000 Active 122 DOM
-
2026-06-03days on market $920,000 Active 121 DOM
-
2026-06-01days on market $920,000 Active 119 DOM
-
2026-05-31days on market $920,000 Active 118 DOM
-
2026-01-29$920,000 Active
ⓘ Source: listings_history table (triggers on properties + properties_extension) + one-shot
backfill from property_details.listing_events for pre-trigger history.
Tax reassessment forecast NY · Partial reset (capped growth)
- Current annual tax
- $7,913 · $659/mo
- Projected year-2 tax
- $11,731 · $978/mo
- Expected delta
- +$3,817/yr (+$318/mo · 48.2%)
ⓘ Screening estimate from a state-policy table — verify with the county assessor before closing.
Climate risk First Street
- Flood 1/10 Low FEMA zone X (unshaded) · 0% chance over 30 yrs
- Wildfire 1/10 Low
- Heat 6/10 Major 7 d/yr ≥99°F today · 15 d/yr by 30 yrs out
- Wind 6/10 Major 27% chance of damaging wind over 30 yrs
- Air quality 4/10 Moderate 5 unhealthy d/yr today · 6 by 30 yrs out
Nearby sold comps map
Loading sold comps map…
Walkable amenities ~0.75 mi
Loading nearby amenities…
Taxation est. · year 1
- Rental income
- $109,920
- − Mortgage interest
- −$51,534
- − Property taxes
- −$7,913
- − Insurance
- −$4,600
- − Repairs & maintenance
- −$8,794
- − Management
- −$8,794
- − Depreciation
- −$26,764
- Taxable income
- $1,522
- Est. tax owed @ 24.0%
- −$365
- After-tax cash flow
- $16,064/yr
For passive investors: Depreciation is non-cash, so a rental often shows a tax loss while cash-flowing — sheltering income. Rental losses are passive: they offset passive income freely, and up to $25,000/yr can offset ordinary (W-2) income if you actively participate and your MAGI is under $100k (phasing out to $0 by $150k); unused losses carry forward. On sale, claimed depreciation is recaptured at up to 25%, and gains may owe capital-gains tax (a 1031 exchange can defer both). Figures are a year-1 estimate at your 24.0% rate — not tax advice; consult a CPA.
Schools (NCES district)
No district data.
Livability — New York
- Score
- 75/100
- State rank
- #268
- US rank
- #4188
Category grades
Schools grade is shown separately in the Schools card above.
Census & demographics
- Census place
- New York, NY
- City population
- 7,731,280
- Population (ZIP)
- 42,940
Population outlook (Bronx County) Hauer SSP2
- Today (2025)
- 1,607,353 people
- By 2030
- 1,681,852 · +4.6%
- By 2040
- 1,824,421 · +13.5%
- By 2050
- 1,945,470 · +21.0%
- By 2075
- 2,187,887 · +36.1%
- By 2100
- 2,244,136 · +39.6%
Race, ethnicity, and origin ACS 2023
- Neighborhood character
- Predominantly Hispanic (71%)
- Race & ethnicity
- Hispanic / Latino 71% Black 24% Two or more races 17% White 1% Native American 1%
- Hispanic origin (detail)
- Mexican 15% Puerto Rican 27% Dominican 17%
- Foreign-born
- 24% · Canada
- Languages at home
- 35% English-only · Spanish 60% French/Haitian/Cajun 1%
Political lean MEDSL · Bronx
- 2024 margin
- Solid D (+45.4) · D 72.7% · R 27.3%
- 2008→2024 swing
- -32.3pp toward R · 2008: 77.8pp · 2024: 45.4pp
- All cycles
- 2024: D+45.4 2020: D+67.6 2016: D+79.1 2012: D+82.9 2008: D+77.8
Not yet ingested
- Civics
- —
Market trends
- HPI YoY
- ▲ 2.14%
- Current HPI
- 145.3911
- Rent YoY
- —
- Metro
- —
- State GDP YoY
- ▲ 2.60%
- F500 in state
- 92
Industry mix (Fortune 500 HQ in NY)
| Industry | F500 HQs | Revenue |
|---|---|---|
| Financial Services | 10 | $950B |
|
||
| Consumer Goods | 9 | $162B |
|
||
| Insurance | 4 | $225B |
|
||
| Telecommunications | 2 | $144B |
|
||
| Pharmaceuticals | 2 | $112B |
|
||
| Media / Entertainment | 2 | $69B |
|
||
Price history
1 event — show timeline
- 2026-01-29 Listed $920,000 OneKey® MLS as Distributed by MLS Grid
Property tax history
+5.5%/yrLatest (2025): $7,913 · +5.0% YoY. Source: county tax records.
Cash-flow waterfall
monthlySold comps — $/sqft
last 12 mo · ≤1 miLoading sold comps…