 Multi-family
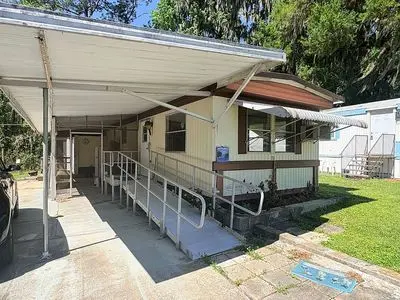
3530 S Pine Ave · Ocala, FL
Flood risk 1/10 · Minimal
- FEMA flood zone
- X (unshaded)
- Chance of flooding over 30 yrs
- 0.0%
- Est. flood insurance / yr
- $507 – $1,088
Fire risk 4/10 · Minor
- Est. fire insurance / yr
- $947 – $1,759
Heat risk 8/10 · Major
- Hot days now (above 108°F)
- 6 days/yr
- Hot days in 30 yrs
- 18 days/yr
Wind risk 9/10 · Severe
- Chance of severe wind over 30 yrs
- 99.0%
Air-quality risk 4/10 · Minor
- Unhealthy air days now
- 5 days/yr
- Unhealthy air days in 30 yrs
- 5 days/yr
Risk factors via First Street. Map © Google.
Why this score? — see what drove the D grade
The composite is a weighted blend of 9 inputs, each scored 0–100. Each bar is that input's sub-score; the figure is the points it added to the 100-point composite (weight × sub-score).
- Cash flow +15.0/30.0
- ARV discount +7.5/15.0
- 1% rule +5.0/10.0
- DSCR +5.0/10.0
- Schools +3.6/10.0
- Livability +3.5/5.0
- Condition / age +2.5/5.0
- Rent growth +2.3/5.0
- Appreciation +0.0/10.0
$8,900
🖨 Deal sheet 📄 Offer letter ✓ Due diligence
Multi-family units
County records classify this as Multi-Family (5+ Unit). Listing-text estimate: 1 unit. estimate disagrees with records
5+ unit building — per-unit beds/baths from public records are typically unavailable; the breakdown below (if shown) is an estimate from the listing text.
Listing remarks
SINGLE WIDE MOBILE HOME LOCATED IN A 55 PLUS PARK. CLOSE TO SHOPPING AND THE DRIVE IN THEATER.
Key facts
- Close to shopping
- Drive in theater
- Listed 23 days
Tags
Neighborhood map
What this means for you Summary
Snapshot
- This is a 2-bed/2.0-bath multifamily listed at $9k.
Deal economics
- At list price, monthly cash flow is $1k ($12k/yr) — positive.
- The deal already cash-flows at list — no discount required.
- Meets the 1% rule at list price ($1k rent vs $9k).
- Recommended offer: $9k (1.5% below list) — sets the bar for market timing.
- Cap rate 144.7% vs local median 4.2% in Ocala — top-decile yield for the area; either an underpriced asset or a hidden risk that comps aren't pricing in. Stress-test before assuming the spread holds.
Location & tenants
- Location reads 69/100 on livability (#476 in FL) — a middle-class / working-renter tenant base. Strengths: cost of living A+, housing A+, health & safety A+; Watch: crime F, amenities F, commute F.
- Marion (rural): math 42% / reading 43% proficiency, ranked #61 of 73 in FL (top 84%) — families likely to look elsewhere, expect single-tenant / working-renter base with shorter leases; 61% free/reduced lunch — lower-income household profile, screen leases tightly.
- Market conditions: Rents soft (-0.6%/yr); 311 active listings in the ZIP; 20 comparable units currently listed for rent nearby; rentals at typical pace (median 21d on market — plan ~3-4 weeks tenant-placement turnaround); 7,071 units permitted in Marion County in 2024 (534 in 5+ unit buildings).
Forward outlook
- Local home prices are declining (-3.0%/yr); year-one equity from $62 of loan paydown is wiped out by about $267 of value loss. Plan a longer hold.
- Marion County population projected at +13% by 2050 — modest demand growth; plan on rents tracking national, not racing it.
- At projected returns (-3.0% appreciation + 0.0% rent growth), your $2k cash investment doubles in ~1 year — after that, you're playing with house money.
Negotiation context
- It's been on market 23 days — a 2% lower offer ($9k) is reasonable based on typical stale-listing flexibility.
- 3 sale attempts since 20y ago with the ask held roughly flat each time — persistent listings suggest the price (not the market) is what's stuck; bring a comps-based counter.
Risks & watch-outs
- Climate carrying-cost: severe wind risk, 99% chance of damaging wind over 30y; extreme-heat days projected 6→18/yr by 2055 (HVAC capex compounding) — expect insurance premiums to compound above CPI over the hold.
Questions for the listing agent
- Is there a deadline driving the sale (1031 exchange, divorce, estate, relocation)? That informs how much negotiation room exists.
- Crime grade is F in this area — have there been break-ins, vandalism, or insurance claims at this property in the last 3 years? What carrier currently insures it and at what premium?
- The area grade is low — what's the realistic commute time and amenity access for the typical tenant pool here? Any planned neighborhood developments (good or bad) we should know about?
- What's the average days-on-market for RENTAL listings here right now (not sales)? A rising rental-DOM trend means longer vacancies and softer asking-rent achievability than the comps imply.
- What's the recent tenant-quality profile in this submarket — average credit score on applications, eviction rate, late-payment / NSF rate, and stable-employment percentage? A property-management company in the area should have these aggregated.
- How much new apartment / multifamily construction is in the pipeline within 1–3 miles? Heavy new supply (>2% of stock underway) typically softens rents 12–24 months out; light construction supports rent growth.
Investment metrics
- 1% rule
- 15.47% ✓
- Cap rate
- 144.70%
- Cash-on-cash
- 494.30%
- DSCR
- 22.99
- GRM
- 0.5
CMA / ARV
No comps found within radius.
Projected returns pro-forma
-3.0% appreciation · 0.0% rent growth · sell at horizon
- IRR
- —
- Equity multiple
- 25.05×
- Total profit
- $59,921
- Equity at exit
- $1,327
- IRR
- —
- Equity multiple
- 49.50×
- Total profit
- $120,850
- Equity at exit
- $770
Cash invested: $2,492 (down + closing). Projections, not guarantees.
Landlord ↔ Tenant lean methodology
- Overall (STATE)
- 87 Strongly Landlord-Friendly
- State Florida
- 87 Strongly Landlord-Friendly · R+3
- County
- — inherits STATE
- City
- — inherits STATE
ZIP-level market 34471
- Rents YoY
- -0.6%
- Active inventory
- 311
- Price-to-rent
- 0.5×
Monthly cashflow live
- Estimated rent
- $1,377 high interval (Pro) →
- Mortgage (P&I)
- −$47
- Tax est. 1.5%
- −$11 /mo · $134/yr
- Insurance
- −$4
- HOA
- −$0
- Vacancy / Maint / Mgmt
- −$289
- Net cashflow
- $1,027
Break-even live
UW: 25.0% down · 7.5% · 30yr · 1.5% tax · 5.0% vac · 8.0% maint · 8.0% mgmt
Financing live
Cash to close
- Down payment
- $2,225
- Closing costs
- $267
- Reserves months
- —
- Total cash needed
- —
Loan-product check · same deal, 3 products live
Conventional
25% down · 7.5% · 30yr
- Down + closing
- —
- Monthly P&I
- —
- Monthly cashflow
- —
- DSCR
- —
- Eligible?
- —
Personal DTI + credit; lowest rate.
DSCR
20% down · 8.5% · 30yr
- Down + closing
- —
- Monthly P&I
- —
- Monthly cashflow
- —
- DSCR
- —
- Eligible?
- —
No personal income docs; deal must DSCR.
Hard money
10% down · 12.0% · 12mo
- Down + closing
- —
- Monthly P&I
- —
- Monthly cashflow
- —
- DSCR
- —
- Eligible?
- —
Short-term bridge; refi at stabilization.
Rent comps 20 comps
| Address | Beds | Baths | Sqft | Rent | $/sqft | DOM | Units | Dist |
|---|---|---|---|---|---|---|---|---|
| 3800 SE 17th Ct Unit B Ocala, FL | 2.0 | 1.0 | 808 | $1,199 | $1.48 | 21d | 1 | 0.57mi |
| 3032 SE 5th Ter Unit D Ocala, FL | 1.0 | 1.0 | 650 | $1,050 | $1.62 | 21d | 1 | 0.62mi |
| 3032 SE 5th Ter Unit F Ocala, FL | 1.0 | 1.0 | 650 | $1,000 | $1.54 | 21d | 1 | 0.62mi |
| 3009 SE 7th Ave Apt D Ocala, FL | 2.0 | 1.0 | 850 | $1,050 | $1.24 | 21d | 1 | 0.63mi |
| 3009 SE 7th Ave Unit C Ocala, FL | 2.0 | 1.0 | 850 | $1,100 | $1.29 | 21d | 1 | 0.63mi |
| 1801 SE 40th Street Rd Ocala, FL | 2.0 | 1.0 | 3233 | $1,300 | $0.40 | 21d | 1 | 0.65mi |
| 3001 SE Lake Weir Ave Ocala, FL | 1.0–3.0 | 1.0–2.0 | 812 | $1,612 | $1.98 | 13d | 16 | 0.65mi |
| 3140 SE 1st Ave Ocala, FL | 1.0–2.0 | 1.0–2.0 | 800 | $1,249 | $1.56 | 13d | 5 | 0.68mi |
| 3950 SE 19th Ave Unit D Ocala, FL | 2.0 | 1.0 | 808 | $1,250 | $1.55 | 21d | 1 | 0.69mi |
| 620 SE 28th Pl Unit A Ocala, FL | 1.0 | 1.0 | — | $950 | — | 21d | 1 | 0.77mi |
| 610 SE 28th Pl Unit D Ocala, FL | 1.0 | 1.0 | — | $950 | — | 21d | 1 | 0.79mi |
| 1610 SE 25th St Unit A Ocala, FL | 1.0 | 1.0 | 669 | $1,174 | $1.75 | 21d | 1 | 0.97mi |
| 908 SE 23rd St Ocala, FL | 3.0 | 2.0 | 1640 | $1,800 | $1.10 | 13d | 1 | 1.05mi |
| 2270 SE 34th St Ocala, FL | 2.0 | 1.5 | 1022 | $1,500 | $1.47 | 13d | 1 | 1.06mi |
| 2201 SE 14th Ave Ocala, FL | 2.0 | 1.5 | 1050 | $1,162 | $1.11 | 13d | 2 | 1.09mi |
| 3821 SW 7th Avenue Rd Ocala, FL | 3.0 | 2.0 | 1673 | $1,800 | $1.08 | 13d | 1 | 1.24mi |
| 1850 SE 18th Ave Ocala, FL | 1.0–3.0 | 1.0–2.0 | 999 | $1,648 | $1.65 | 13d | 51 | 1.28mi |
| 510 SW 28th St Ocala, FL | 3.0 | 2.0 | 1771 | $2,250 | $1.27 | 13d | 1 | 1.30mi |
| 691 SE 19th St Ocala, FL | 3.0 | 2.0 | 1424 | $1,800 | $1.26 | 21d | 1 | 1.33mi |
| 2700 SE 35th St Ocala, FL | 3.0 | 2.0 | 1977 | $2,500 | $1.26 | 21d | 1 | 1.44mi |
Listing history 19 events
-
2026-06-18days on market $8,900 Active 23 DOM
-
2026-06-17days on market $8,900 Active 22 DOM
-
2026-06-16days on market $8,900 Active 21 DOM
-
2026-06-15days on market $8,900 Active 20 DOM
-
2026-06-14days on market $8,900 Active 18 DOM
-
2026-06-13days on market $8,900 Active 17 DOM
-
2026-06-10days on market $8,900 Active 15 DOM
-
2026-06-09days on market $8,900 Active 14 DOM
-
2026-06-08days on market $8,900 Active 13 DOM
-
2026-06-07days on market $8,900 Active 12 DOM
-
2026-06-03days on market $8,900 Active 8 DOM
-
2026-06-02days on market $8,900 Active 7 DOM
-
2026-05-31days on market $8,900 Active 5 DOM
-
2026-05-30days on market $8,900 Active 4 DOM
-
2026-05-26$8,900 Active
-
2011-03-31historical
-
2009-03-06$1,200,000
-
2007-10-31historical
-
2006-11-06$1,495,000
ⓘ Source: listings_history table (triggers on properties + properties_extension) + one-shot
backfill from property_details.listing_events for pre-trigger history.
Climate risk First Street
- Flood 1/10 Low FEMA zone X (unshaded) · 0% chance over 30 yrs
- Wildfire 4/10 Moderate
- Heat 8/10 Severe 6 d/yr ≥108°F today · 18 d/yr by 30 yrs out
- Wind 9/10 Extreme 99% chance of damaging wind over 30 yrs
- Air quality 4/10 Moderate 5 unhealthy d/yr today · 5 by 30 yrs out
Nearby sold comps map
Loading sold comps map…
Walkable amenities ~0.75 mi
Loading nearby amenities…
Taxation est. · year 1
- Rental income
- $16,527
- − Mortgage interest
- −$499
- − Property taxes
- −$134
- − Insurance
- −$44
- − Repairs & maintenance
- −$1,322
- − Management
- −$1,322
- − Depreciation
- −$259
- Taxable income
- $12,947
- Est. tax owed @ 24.0%
- −$3,107
- After-tax cash flow
- $9,211/yr
For passive investors: Depreciation is non-cash, so a rental often shows a tax loss while cash-flowing — sheltering income. Rental losses are passive: they offset passive income freely, and up to $25,000/yr can offset ordinary (W-2) income if you actively participate and your MAGI is under $100k (phasing out to $0 by $150k); unused losses carry forward. On sale, claimed depreciation is recaptured at up to 25%, and gains may owe capital-gains tax (a 1031 exchange can defer both). Figures are a year-1 estimate at your 24.0% rate — not tax advice; consult a CPA.
Schools (NCES district)
- District
- Marion
- NCES district ID
- 1201260
- Math proficiency
- 42% ▼ -7.00%
- Reading proficiency
- 43% ▼ -4.00%
- Median HH income
- $40,015
- Composite
- 35.61/100
- National rank
- #4890
- State rank
- #61 of 73 in FL
Livability — Ocala
- Score
- 69/100
- State rank
- #476
- US rank
- #8461
Category grades
Schools grade is shown separately in the Schools card above.
Census & demographics
- County
- Marion County · 315,796 people
- City population
- 263,375
- Metro
- Ocala, FL
- Population (ZIP)
- 28,342
- Household income
- $65,789
- Rent vs Own
- Severe rent burden
- 1494.0
Population outlook (Marion County) Hauer SSP2
- Today (2025)
- 365,905 people
- By 2030
- 376,768 · +3.0%
- By 2040
- 396,555 · +8.4%
- By 2050
- 412,723 · +12.8%
- By 2075
- 446,090 · +21.9%
- By 2100
- 436,193 · +19.2%
Race, ethnicity, and origin ACS 2023
- Neighborhood character
- Predominantly White (67%)
- Race & ethnicity
- White 67% Hispanic / Latino 16% Two or more races 11% Black 10% Asian 3%
- Hispanic origin (detail)
- Mexican 2% Puerto Rican 6% Cuban 3% Dominican 1%
- Common ancestry
- Slovak 3% Italian 2% Lithuanian 2%
- Foreign-born
- 9% · Canada, Jamaica, Dominican Republic
- Languages at home
- 86% English-only · Spanish 11% Other Asian/Pacific 1%
Political lean MEDSL · Marion
- 2024 margin
- Solid R (+31.6) · D 33.8% · R 65.5%
- 2008→2024 swing
- -20.0pp toward R · 2008: -11.6pp · 2024: -31.6pp
- All cycles
- 2024: R+31.6 2020: R+25.9 2016: R+26.2 2012: R+16.2 2008: R+11.6
Not yet ingested
- Civics
- —
Market trends
- HPI YoY
- ▼ -176.55%
- Current HPI
- 224.1709
- Rent YoY
- ▼ -0.64%
- Metro
- Ocala, FL
- State GDP YoY
- ▲ 3.28%
- F500 in state
- 36
Industry mix (Fortune 500 HQ in FL)
| Industry | F500 HQs | Revenue |
|---|---|---|
| Industrial Technology | 2 | $29B |
|
||
| Insurance | 2 | $17B |
|
||
| Retail | 1 | $60B |
|
||
| Technology Distribution | 1 | $58B |
|
||
| Homebuilding | 1 | $35B |
|
||
| Technology Manufacturing | 1 | $35B |
|
||
Price history
-99.4% since first listed5 events — show timeline
- 2026-05-26 Listed $8,900 FSBO.com
- 2011-03-31 Listing Removed — Stellar MLS as Distributed by MLS Grid
- 2009-03-06 Listed $1,200,000 Stellar MLS as Distributed by MLS Grid
- 2007-10-31 Listing Removed — Stellar MLS as Distributed by MLS Grid
- 2006-11-06 Listed $1,495,000 Stellar MLS as Distributed by MLS Grid
Cash-flow waterfall
monthlySold comps — $/sqft
last 12 mo · ≤1 miLoading sold comps…