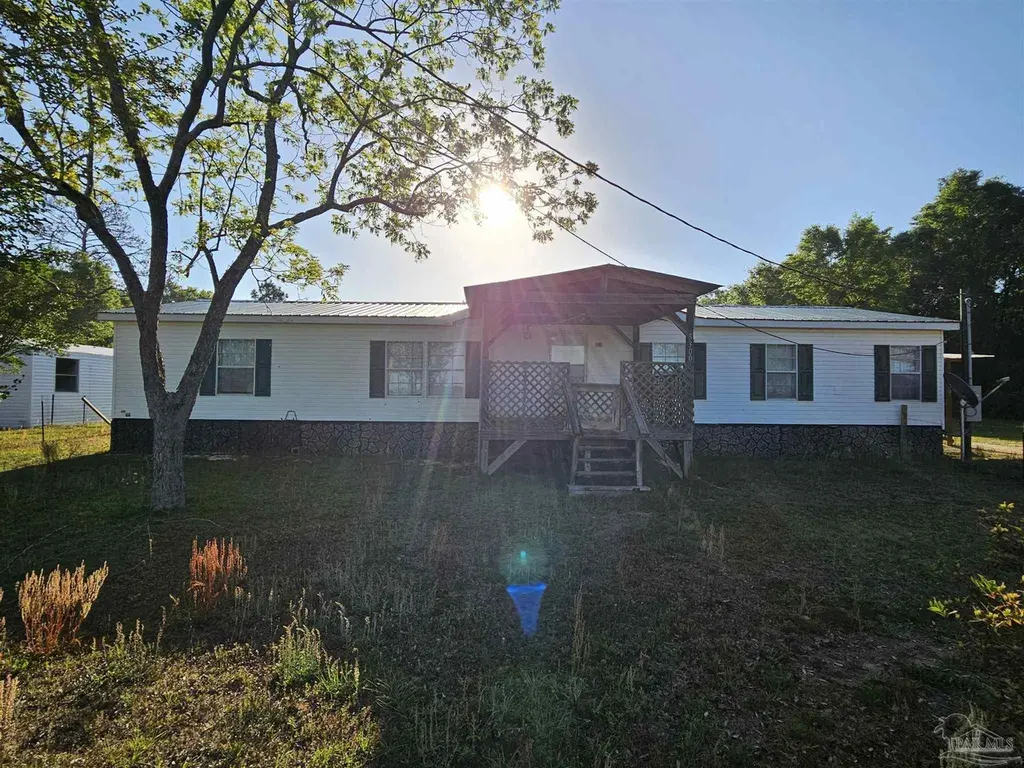
5300 Persimmon Hollow Rd · East Milton, FL
Flood risk 1/10 · Minimal
- FEMA flood zone
- X (unshaded)
- Chance of flooding over 30 yrs
- 0.0%
- Est. flood insurance / yr
- $507 – $1,088
Fire risk 5/10 · Moderate
- Est. fire insurance / yr
- $947 – $1,759
Heat risk 9/10 · Severe
- Hot days now (above 105°F)
- 7 days/yr
- Hot days in 30 yrs
- 21 days/yr
Wind risk 9/10 · Severe
- Chance of severe wind over 30 yrs
- 99.0%
Air-quality risk 2/10 · Minimal
- Unhealthy air days now
- 0 days/yr
- Unhealthy air days in 30 yrs
- 1 days/yr
Risk factors via First Street. Map © Google.
Why this score? — see what drove the B+ grade
The composite is a weighted blend of 9 inputs, each scored 0–100. Each bar is that input's sub-score; the figure is the points it added to the 100-point composite (weight × sub-score).
- Cash flow +30.0/30.0
- ARV discount +15.0/15.0
- DSCR +10.0/10.0
- 1% rule +9.5/10.0
- Schools +5.3/10.0
- Livability +3.9/5.0
- Rent growth +3.6/5.0
- Condition / age +2.5/5.0
- Appreciation +0.0/10.0
$154,900
🖨 Deal sheet 📄 Offer letter ✓ Due diligence
Listing remarks MLS
**Reduced to $105,000*** Bring your offer! 6.2 acre, 3b/2b Double Wide Manufactured Home. Spacious. Equipped with all appliances, matching washer/dryer set and upright freezer. Fruit trees: Asian Plum, Pecan, Pear, Blueberry bushes. Shed and single wide hold no value. ***DO NOT WALK ON FRONT PORCH*** Coldwell Banker Mortgage and Wells Fargo write mortgages on manufactured homes.
Key facts
- Large kitchen
- Formal dining area
- Center island
Tags
Property features AI
Finance
- Other: Located on approximately 1.47 acres; County maintained road
- HOA & community: No association
Exterior
- Parking: Open parking; Circular driveway
- Security: Smoke detector(s)
- Utilities: Public water; Septic tank; Electric service with circuit breakers and fuses
- Home design: Mobile/Manufactured home; One story; Resale property
- Construction: Frame construction; Metal roof; Off-grade foundation
- Exterior features: Partial fencing; Yard building; Interior lot
Interior
- Kitchen: Kitchen island; Pantry; Dishwasher; Electric water heater
- Bedrooms: Master bedroom approximately 12.5 x 15.5 ft
- Flooring: Vinyl
- Bathrooms: 2 full bathrooms
- Heating & cooling: Central heating; Central air; Ceiling fan(s)
- Interior features: Ceiling fan(s); Blinds
- Laundry & utility: Washer/dryer hookups inside
Neighborhood map
What this means for you Summary
Snapshot
- This is a 3-bed/2.0-bath manufactured listed at $155k.
Deal economics
- At list price, monthly cash flow is $788 ($9k/yr) — positive.
- The deal already cash-flows at list — no discount required.
- Meets the 1% rule at list price ($2k rent vs $155k).
- Recommended offer: $153k (1.5% below list) — sets the bar for market timing.
- Cap rate 12.4% vs local median 4.6% in East Milton — top-decile yield for the area; either an underpriced asset or a hidden risk that comps aren't pricing in. Stress-test before assuming the spread holds.
Location & tenants
- Location reads 77/100 on livability (#199 in FL, #3,139 nationally) — a middle-class / working-renter tenant base. Strengths: cost of living A+, housing A+, health & safety A+; Watch: crime C-, amenities C-, commute F.
- Santa Rosa (suburban): math 63% / reading 60% proficiency, ranked #8 of 73 in FL (top 11%) — acceptable for families but not a draw, mixed tenant base, ~2y average lease.
- Market conditions: Rents rising fast (+4.5%/yr); 806 active listings in the ZIP; 2 comparable units currently listed for rent nearby; solid renter incomes; 1,983 units permitted in Santa Rosa County in 2024 (128 in 5+ unit buildings).
- This rent runs 32% of the median local income ($85k/yr) — at the standard rent-burdened threshold; future hikes will face affordability resistance.
Forward outlook
- Local home prices are declining (-3.0%/yr); year-one equity from $1k of loan paydown is wiped out by about $5k of value loss. Plan a longer hold.
- Santa Rosa County population projected at +31% by 2050 — long-run rental-demand tailwind backs the buy-and-hold thesis.
- At projected returns (-3.0% appreciation + 4.5% rent growth), your $43k cash investment doubles in ~6 years — after that, you're playing with house money.
Negotiation context
- It's been on market 16 days — a 2% lower offer ($153k) is reasonable based on typical stale-listing flexibility.
- 5 sale attempts since 26y ago with the ask held roughly flat each time — persistent listings suggest the price (not the market) is what's stuck; bring a comps-based counter.
Risks & watch-outs
- Climate carrying-cost: severe wind risk, 99% chance of damaging wind over 30y; moderate wildfire risk; extreme-heat days projected 7→21/yr by 2055 (HVAC capex compounding) — expect insurance premiums to compound above CPI over the hold.
Questions for the listing agent
- Is there a deadline driving the sale (1031 exchange, divorce, estate, relocation)? That informs how much negotiation room exists.
- Schools are B-rated — typically a magnet for longer-tenancy family renters. What's the average tenant stay here, and is there a school-zone premium baked into asking?
- What's the average days-on-market for RENTAL listings here right now (not sales)? A rising rental-DOM trend means longer vacancies and softer asking-rent achievability than the comps imply.
- What's the recent tenant-quality profile in this submarket — average credit score on applications, eviction rate, late-payment / NSF rate, and stable-employment percentage? A property-management company in the area should have these aggregated.
- How much new for-sale + rental construction is in the pipeline within 1–3 miles? Heavy new supply typically softens prices + rents 12–24 months out; constrained supply supports both.
Investment metrics
- 1% rule
- 1.45% ✓
- Cap rate
- 12.40%
- Cash-on-cash
- 21.80%
- DSCR
- 1.97
- GRM
- 5.7
CMA / ARV
- ARV (on-the-fly)
- $229,944
- Comps found
- 2
Show comp detail 2 sales within ~0.75 mi
| Address | Dist | Beds/Ba | Sqft | Sold | Price | $/sf | Match |
|---|---|---|---|---|---|---|---|
| 8255 Punjob Rd | 0.36mi | 4/2.0 (+1) | 1,568 (-9%) | 1mo | $210,000 | $134 | 63 |
| 5150 Pine Berry Rd | 0.49mi | 3/2.0 | 1,560 (-9%) | 8mo | $192,500 | $123 | 55 |
Match score weights: distance 35% · size 25% · config 20% · recency 20%. Top-matched comps best support the ARV.
Projected returns pro-forma
-3.0% appreciation · 4.53% rent growth · sell at horizon
- IRR
- 16.1%
- Equity multiple
- 1.66×
- Total profit
- $28,571
- Equity at exit
- $23,096
- IRR
- 25.7%
- Equity multiple
- 3.40×
- Total profit
- $104,294
- Equity at exit
- $13,393
Cash invested: $43,372 (down + closing). Projections, not guarantees.
Landlord ↔ Tenant lean methodology
- Overall (STATE)
- 87 Strongly Landlord-Friendly
- State Florida
- 87 Strongly Landlord-Friendly · R+3
- County
- — inherits STATE
- City
- — inherits STATE
ZIP-level market 32583
- Home prices YoY
- -11.3%
- Rents YoY
- 4.5%
- Active inventory
- 806
- Price-to-rent
- 5.7×
Monthly cashflow live
- Estimated rent
- $2,248 medium interval (Pro) →
- Mortgage (P&I)
- −$812
- Tax from tax record
- −$111 /mo · $1,336/yr
- Insurance
- −$65
- HOA
- −$0
- Vacancy / Maint / Mgmt
- −$472
- Net cashflow
- $788
Break-even live
UW: 25.0% down · 7.5% · 30yr · 1.5% tax · 5.0% vac · 8.0% maint · 8.0% mgmt
Financing live
Cash to close
- Down payment
- $38,725
- Closing costs
- $4,647
- Reserves months
- —
- Total cash needed
- —
Loan-product check · same deal, 3 products live
Conventional
25% down · 7.5% · 30yr
- Down + closing
- —
- Monthly P&I
- —
- Monthly cashflow
- —
- DSCR
- —
- Eligible?
- —
Personal DTI + credit; lowest rate.
DSCR
20% down · 8.5% · 30yr
- Down + closing
- —
- Monthly P&I
- —
- Monthly cashflow
- —
- DSCR
- —
- Eligible?
- —
No personal income docs; deal must DSCR.
Hard money
10% down · 12.0% · 12mo
- Down + closing
- —
- Monthly P&I
- —
- Monthly cashflow
- —
- DSCR
- —
- Eligible?
- —
Short-term bridge; refi at stabilization.
Rent comps 2 comps
| Address | Beds | Baths | Sqft | Rent | $/sqft | DOM | Units | Dist |
|---|---|---|---|---|---|---|---|---|
| 8617 Tarsus Dr Milton, FL | 4.0 | 2.0 | 1830 | $2,200 | $1.20 | 23d | 1 | 1.14mi |
| 9330 Tara Cir Milton, FL | 4.0 | 2.0 | 1786 | $2,000 | $1.12 | 14d | 1 | 1.44mi |
Listing history 15 events
-
2026-05-08status Pending
-
2026-04-22$154,900 Active
-
2021-09-17soldstatus $175,000
-
2015-07-29soldstatus $80,000
-
2015-07-22soldstatus $80,000 387-char remark
Show marketing remark (387 chars)
**Reduced to $105,000*** Bring your offer! 6.2 acre, 3b/2b Double Wide Manufactured Home. Spacious. Equipped with all appliances, matching washer/dryer set and upright freezer. Fruit trees: Asian Plum, Pecan, Pear, Blueberry bushes. Shed and single wide hold no value. ***DO NOT WALK ON FRONT PORCH*** Coldwell Banker Mortgage and Wells Fargo write mortgages on manufactured homes.
-
2013-07-08$95,000 387-char remark
Show marketing remark (387 chars)
**Reduced to $105,000*** Bring your offer! 6.2 acre, 3b/2b Double Wide Manufactured Home. Spacious. Equipped with all appliances, matching washer/dryer set and upright freezer. Fruit trees: Asian Plum, Pecan, Pear, Blueberry bushes. Shed and single wide hold no value. ***DO NOT WALK ON FRONT PORCH*** Coldwell Banker Mortgage and Wells Fargo write mortgages on manufactured homes.
-
2002-11-04soldstatus $63,500
-
2002-10-24soldstatus $63,500 353-char remark
Show marketing remark (353 chars)
WHAT A GREAT PLACE IN THE COUNTRY!! PLENTY OF ROOM FOR A LARGE GARDEN. THERE ARE PECAN, OAK AND FRUIT TREES. BRING YOUR ANIMALS; HORSES, COWS, EVEN GOATS!! THIS HOME HAS A FENCED PASTURE WITH A SMALL BARN. PLENTY OF ROOM FOR THE KIDS TO ROAM. ALL THIS IS JUST A STONE'S THROW FROM THE INTERSTATE. WILL CONSIDER RENTING OR LEASE WITH OPTION TO BUY.
-
2002-07-18$65,000 353-char remark
Show marketing remark (353 chars)
WHAT A GREAT PLACE IN THE COUNTRY!! PLENTY OF ROOM FOR A LARGE GARDEN. THERE ARE PECAN, OAK AND FRUIT TREES. BRING YOUR ANIMALS; HORSES, COWS, EVEN GOATS!! THIS HOME HAS A FENCED PASTURE WITH A SMALL BARN. PLENTY OF ROOM FOR THE KIDS TO ROAM. ALL THIS IS JUST A STONE'S THROW FROM THE INTERSTATE. WILL CONSIDER RENTING OR LEASE WITH OPTION TO BUY.
-
2001-01-06historical
-
2001-01-05historical
-
2000-07-05$60,500
-
2000-07-05$67,000
-
1984-11-01soldstatus $11,000
-
1984-11-01soldstatus $18,000
ⓘ Source: listings_history table (triggers on properties + properties_extension) + one-shot
backfill from property_details.listing_events for pre-trigger history.
Tax reassessment forecast FL · Resets to sale price
- Current annual tax
- $1,336 · $111/mo
- Projected year-2 tax
- $1,336 · $111/mo
- Expected delta
- $0/yr ($0/mo · 0.0%)
ⓘ Screening estimate from a state-policy table — verify with the county assessor before closing.
Climate risk First Street
- Flood 1/10 Low FEMA zone X (unshaded) · 0% chance over 30 yrs
- Wildfire 5/10 Major
- Heat 9/10 Extreme 7 d/yr ≥105°F today · 21 d/yr by 30 yrs out
- Wind 9/10 Extreme 99% chance of damaging wind over 30 yrs
- Air quality 2/10 Low 0 unhealthy d/yr today · 1 by 30 yrs out
Nearby sold comps map
Loading sold comps map…
Walkable amenities ~0.75 mi
Loading nearby amenities…
Taxation est. · year 1
- Rental income
- $26,977
- − Mortgage interest
- −$8,677
- − Property taxes
- −$1,336
- − Insurance
- −$774
- − Repairs & maintenance
- −$2,158
- − Management
- −$2,158
- − Depreciation
- −$4,506
- Taxable income
- $7,367
- Est. tax owed @ 24.0%
- −$1,768
- After-tax cash flow
- $7,685/yr
For passive investors: Depreciation is non-cash, so a rental often shows a tax loss while cash-flowing — sheltering income. Rental losses are passive: they offset passive income freely, and up to $25,000/yr can offset ordinary (W-2) income if you actively participate and your MAGI is under $100k (phasing out to $0 by $150k); unused losses carry forward. On sale, claimed depreciation is recaptured at up to 25%, and gains may owe capital-gains tax (a 1031 exchange can defer both). Figures are a year-1 estimate at your 24.0% rate — not tax advice; consult a CPA.
Schools (NCES district)
- District
- Santa Rosa
- NCES district ID
- 1201650
- Math proficiency
- 63% ▼ -6.00%
- Reading proficiency
- 60% ▼ -5.00%
- Median HH income
- $58,161
- Composite
- 53.12/100
- National rank
- #1511
- State rank
- #8 of 73 in FL
Livability — East Milton
- Score
- 77/100
- State rank
- #199
- US rank
- #3139
Category grades
Schools grade is shown separately in the Schools card above.
Census & demographics
- Census place
- East Milton, FL
- County
- Santa Rosa County · 194,764 people
- City population
- 31,415
- Metro
- Pensacola-Ferry Pass-Brent, FL
- Population (ZIP)
- 31,828
- Household income
- $85,440
- Rent vs Own
- Severe rent burden
- 122.0
Population outlook (Santa Rosa County) Hauer SSP2
- Today (2025)
- 195,978 people
- By 2030
- 209,782 · +7.0%
- By 2040
- 235,293 · +20.1%
- By 2050
- 256,408 · +30.8%
- By 2075
- 298,074 · +52.1%
- By 2100
- 303,216 · +54.7%
Race, ethnicity, and origin ACS 2023
- Neighborhood character
- Predominantly White (74%)
- Race & ethnicity
- White 74% Black 11% Two or more races 10% Hispanic / Latino 6% Asian 1%
- Hispanic origin (detail)
- Mexican 3% Puerto Rican 2% Cuban 1%
- Common ancestry
- Italian 3% Slovak 2% Serbian 2%
- Foreign-born
- 3% · Canada
- Languages at home
- 94% English-only · Spanish 3%
Political lean MEDSL · Santa Rosa
- 2024 margin
- Solid R (+51.0) · D 24.1% · R 75.0%
- 2008→2024 swing
- -3.0pp toward R · 2008: -47.9pp · 2024: -51.0pp
- All cycles
- 2024: R+51.0 2020: R+46.5 2016: R+53.5 2012: R+52.6 2008: R+47.9
Not yet ingested
- Civics
- —
Market trends
- HPI YoY
- ▼ -38.35%
- Current HPI
- 301.8819
- Rent YoY
- ▲ 4.53%
- Metro
- Pensacola-Ferry Pass-Brent, FL
- State GDP YoY
- ▲ 3.28%
- F500 in state
- 36
Industry mix (Fortune 500 HQ in FL)
| Industry | F500 HQs | Revenue |
|---|---|---|
| Industrial Technology | 2 | $29B |
|
||
| Insurance | 2 | $17B |
|
||
| Retail | 1 | $60B |
|
||
| Technology Distribution | 1 | $58B |
|
||
| Homebuilding | 1 | $35B |
|
||
| Technology Manufacturing | 1 | $35B |
|
||
Price history
+1308.2% since first listed15 events — show timeline
- 2026-05-08 Pending — PARMLS
- 2026-04-22 Listed $154,900 PARMLS
- 2021-09-17 Sold (Public Records) $175,000 Public Records
- 2015-07-29 Sold (Public Records) $80,000 Public Records
- 2015-07-22 Sold (MLS) $80,000 PARMLS
- 2013-07-08 Listed $95,000 PARMLS
- 2002-11-04 Sold (Public Records) $63,500 Public Records
- 2002-10-24 Sold (MLS) $63,500 PARMLS
- 2002-07-18 Listed $65,000 PARMLS
- 2001-01-06 Listing Removed — PARMLS
- 2001-01-05 Listing Removed — PARMLS
- 2000-07-05 Listed $67,000 PARMLS
- 2000-07-05 Listed $60,500 PARMLS
- 1984-11-01 Sold (Public Records) $18,000 Public Records
- 1984-11-01 Sold (Public Records) $11,000 Public Records
Property tax history
+3.8%/yrLatest (2025): $1,336 · +12.0% YoY. Source: county tax records.
Cash-flow waterfall
monthlySold comps — $/sqft
last 12 mo · ≤1 miLoading sold comps…