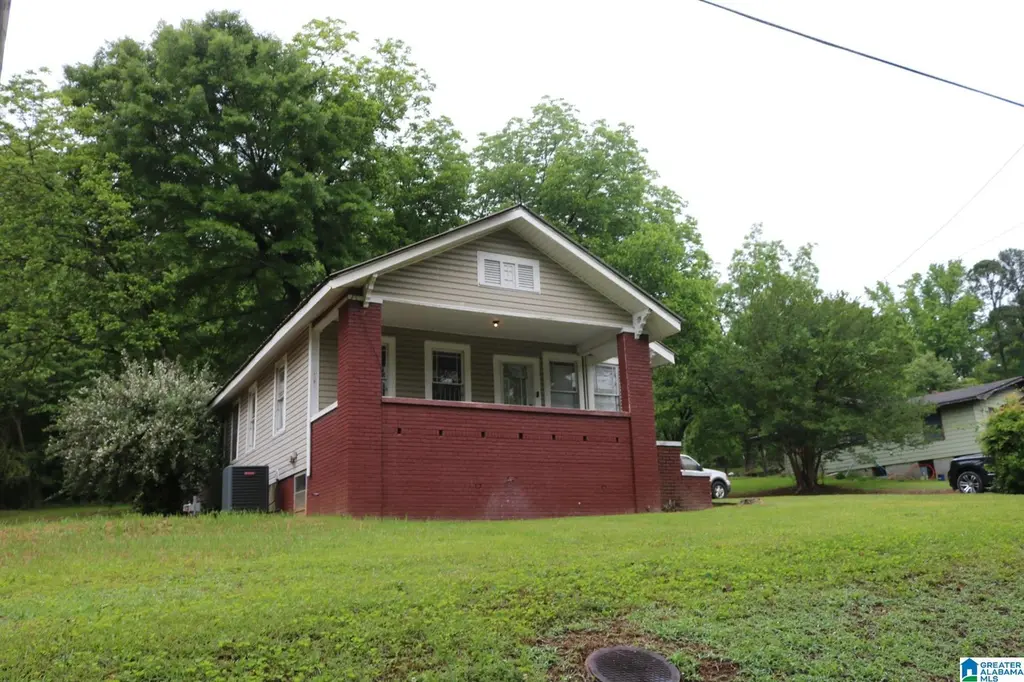
812 26th Ave N · Hueytown, AL
Flood risk 1/10 · Minimal
- FEMA flood zone
- X (unshaded)
- Chance of flooding over 30 yrs
- 0.0%
- Est. flood insurance / yr
- $507 – $1,088
Fire risk 4/10 · Minor
- Est. fire insurance / yr
- $916 – $1,700
Heat risk 6/10 · Moderate
- Hot days now (above 109°F)
- 7 days/yr
- Hot days in 30 yrs
- 19 days/yr
Wind risk 6/10 · Moderate
- Chance of severe wind over 30 yrs
- 41.0%
Air-quality risk 3/10 · Minor
- Unhealthy air days now
- 2 days/yr
- Unhealthy air days in 30 yrs
- 5 days/yr
Risk factors via First Street. Map © Google.
Why this score? — see what drove the B grade
The composite is a weighted blend of 9 inputs, each scored 0–100. Each bar is that input's sub-score; the figure is the points it added to the 100-point composite (weight × sub-score).
- Cash flow +30.0/30.0
- 1% rule +10.0/10.0
- DSCR +10.0/10.0
- ARV discount +7.5/15.0
- Appreciation +4.7/10.0
- Rent growth +2.9/5.0
- Livability +2.9/5.0
- Condition / age +2.5/5.0
- Schools +1.8/10.0
$74,900
🖨 Deal sheet 📄 Offer letter ✓ Due diligence
Listing remarks MLS
REDUCED!!!This home waits for that first time homebuyer. You have 3 bedrooms and 1 bath. And there is a basement in which can be used to exercise that design potential. Also according to County tax records there is appx. 2.27 acres of land at your disposal.
Key facts
- 2 acre lot
- Built 1930
- Listed 13 days
Property features AI
Finance
- Financial info: Down payment assistance available; Fire, garbage, and library fees are included
- HOA & community: No association fee
Exterior
- Parking: Driveway parking
- Utilities: Public water; Septic sewer; Electric water heater; Internet service availability unknown
- Home design: Existing structure; Siding (other) exterior
- Construction: Crawl space foundation
- Exterior features: No pool, patio, decks, or garden/patio indicated; Not waterfront; Property includes 2 acres
Interior
- Kitchen: Laminate countertops
- Bedrooms: Three bedrooms on the main level
- Flooring: Hardwood floors
- Bathrooms: One full bathroom with tub/shower combo on the main level
- Heating & cooling: Central heating; Central cooling
- Interior features: Smooth ceilings; Three wood-burning fireplaces with brick surrounds located in the living room, family room, and a bedroom; No additional listed interior features
- Laundry & utility: Laundry in the basement; Washer hookup; Electric dryer hookup; Has laundry space (see remarks)
Neighborhood map
What this means for you Summary
Snapshot
- This is a 3-bed/1.0-bath single-family listed at $75k.
Deal economics
- At list price, monthly cash flow is $622 ($7k/yr) — positive.
- The deal already cash-flows at list — no discount required.
- Meets the 1% rule at list price ($1k rent vs $75k).
- Cap rate 16.3% vs local median 5.9% in Hueytown — top-decile yield for the area; either an underpriced asset or a hidden risk that comps aren't pricing in. Stress-test before assuming the spread holds.
Location & tenants
- Location reads 57/100 on livability (#378 in AL) — a working-class tenant base; expect higher turnover. Strengths: cost of living A+, housing A+; Watch: employment D, crime F, amenities F.
- Jefferson County (suburban): math 9% / reading 32% proficiency, ranked #104 of 129 in AL (top 81%) — low school quality limits family demand, transient renter base, plan for 1-2y turnover.
- Zoned schools: Hueytown High School (math 7% / reading 20%, grade F, #235 of 305 statewide, top 77%, 1,210 students, 79% FRL) — zoned schools average 79% FRL vs 49% district-wide (30 pts higher); higher-poverty schools than district average — tighter screening recommended.
- Market conditions: Rents rising (+1.6%/yr); 250 active listings in the ZIP; 12 comparable units currently listed for rent nearby; rentals at typical pace (median 16d on market — plan ~3-4 weeks tenant-placement turnaround); 2,114 units permitted in Jefferson County in 2024 (556 in 5+ unit buildings).
Forward outlook
- In year one you build about $69 of equity ($518 loan paydown + $-449 appreciation (-0.6% local appreciation)).
- Jefferson County population projected to shrink 4% by 2050 — rents likely to lag national; underwrite the cash flow, not the appreciation.
- At projected returns (-0.6% appreciation + 1.6% rent growth), your $21k cash investment doubles in ~3 years — after that, you're playing with house money.
Negotiation context
- Only 13 days on market — expect competitive offers; lowballing is unlikely to land.
- 3 sale attempts since 10y ago with the ask held roughly flat each time — persistent listings suggest the price (not the market) is what's stuck; bring a comps-based counter.
- Current owner paid $32k; list at $75k implies a 134% gain — meaningful room to come down on a strong offer.
Risks & watch-outs
- Watch-outs: built in 1930 — expect roof / HVAC / electrical / plumbing capex.
- Climate carrying-cost: major wind risk, 41% chance of damaging wind over 30y; extreme-heat days projected 7→19/yr by 2055 (HVAC capex compounding) — expect insurance premiums to compound above CPI over the hold.
Questions for the listing agent
- Built in 1930 — when were the roof, HVAC, electrical panel, plumbing, and water heater last replaced?
- Is there a deadline driving the sale (1031 exchange, divorce, estate, relocation)? That informs how much negotiation room exists.
- Schools are F-rated, which usually means shorter tenancies and higher turnover. Who's the typical renter profile here, and what's been the actual vacancy rate?
- Crime grade is F in this area — have there been break-ins, vandalism, or insurance claims at this property in the last 3 years? What carrier currently insures it and at what premium?
- What's the average days-on-market for RENTAL listings here right now (not sales)? A rising rental-DOM trend means longer vacancies and softer asking-rent achievability than the comps imply.
- What's the recent tenant-quality profile in this submarket — average credit score on applications, eviction rate, late-payment / NSF rate, and stable-employment percentage? A property-management company in the area should have these aggregated.
- How much new for-sale + rental construction is in the pipeline within 1–3 miles? Heavy new supply typically softens prices + rents 12–24 months out; constrained supply supports both.
Investment metrics
- 1% rule
- 1.91% ✓
- Cap rate
- 16.26%
- Cash-on-cash
- 35.59%
- DSCR
- 2.58
- GRM
- 4.4
CMA / ARV
- ARV (on-the-fly)
- $247,520
- Comps found
- 12
Show comp detail 12 sales within ~0.75 mi
| Address | Dist | Beds/Ba | Sqft | Sold | Price | $/sf | Match |
|---|---|---|---|---|---|---|---|
| 3867 Heritage Crest Dr | 0.42mi | 4/2.0 (+1) | 1,444 (-1%) | 1mo | $244,900 | $170 | 69 |
| 3400 King St | 0.22mi | 3/2.0 | 1,378 (-5%) | 10mo | $40,000 | $29 | 68 |
| 3875 Heritage Crest Dr | 0.44mi | 4/2.0 (+1) | 1,497 (+3%) | 1mo | $266,750 | $178 | 65 |
| 3870 Heritage Crest Dr | 0.42mi | 4/2.0 (+1) | 1,497 (+3%) | 2mo | $262,400 | $175 | 64 |
| 1024 Rose Hill Cir | 0.44mi | 3/1.0 | 1,560 (+7%) | 8mo | $105,000 | $67 | 61 |
| 3855 Heritage Crest Dr | 0.39mi | 3/2.0 | 1,281 (-12%) | 1mo | $239,400 | $187 | 57 |
| 144 Greenridge Rd | 0.54mi | 4/2.0 (+1) | 1,368 (-6%) | 1mo | $175,000 | $128 | 55 |
| 3871 Heritage Crest Dr | 0.43mi | 3/2.0 | 1,272 (-13%) | 1mo | $244,900 | $193 | 54 |
| 3874 Heritage Crest Dr | 0.43mi | 3/2.0 | 1,272 (-13%) | 3mo | $244,900 | $193 | 52 |
| 105 Greenridge Ter | 0.61mi | 4/2.0 (+1) | 1,368 (-6%) | 2mo | $74,300 | $54 | 51 |
| 125 Greenridge Ter | 0.58mi | 3/2.0 | 1,647 (+13%) | 11mo | $160,000 | $97 | 38 |
| 1220 26th Ave N | 0.60mi | 4/2.0 (+1) | 1,665 (+14%) | 2mo | $195,000 | $117 | 38 |
Match score weights: distance 35% · size 25% · config 20% · recency 20%. Top-matched comps best support the ARV.
Projected returns pro-forma
-0.6% appreciation · 1.6% rent growth · sell at horizon
- IRR
- 34.0%
- Equity multiple
- 2.59×
- Total profit
- $33,367
- Equity at exit
- $19,528
- IRR
- 37.3%
- Equity multiple
- 4.80×
- Total profit
- $79,735
- Equity at exit
- $21,768
Cash invested: $20,972 (down + closing). Projections, not guarantees.
Landlord ↔ Tenant lean methodology
- Overall (STATE)
- 90 Strongly Landlord-Friendly
- State Alabama
- 90 Strongly Landlord-Friendly · R+15
- County
- — inherits STATE
- City
- — inherits STATE
ZIP-level market 35023
- Home prices YoY
- -0.1%
- Rents YoY
- 1.6%
- Active inventory
- 250
- Price-to-rent
- 4.4×
Monthly cashflow live
- Estimated rent
- $1,431 high interval (Pro) →
- Mortgage (P&I)
- −$393
- Tax from tax record
- −$84 /mo · $1,011/yr
- Insurance
- −$31
- HOA
- −$0
- Vacancy / Maint / Mgmt
- −$300
- Net cashflow
- $622
Break-even live
UW: 25.0% down · 7.5% · 30yr · 1.5% tax · 5.0% vac · 8.0% maint · 8.0% mgmt
Financing live
Cash to close
- Down payment
- $18,725
- Closing costs
- $2,247
- Reserves months
- —
- Total cash needed
- —
Loan-product check · same deal, 3 products live
Conventional
25% down · 7.5% · 30yr
- Down + closing
- —
- Monthly P&I
- —
- Monthly cashflow
- —
- DSCR
- —
- Eligible?
- —
Personal DTI + credit; lowest rate.
DSCR
20% down · 8.5% · 30yr
- Down + closing
- —
- Monthly P&I
- —
- Monthly cashflow
- —
- DSCR
- —
- Eligible?
- —
No personal income docs; deal must DSCR.
Hard money
10% down · 12.0% · 12mo
- Down + closing
- —
- Monthly P&I
- —
- Monthly cashflow
- —
- DSCR
- —
- Eligible?
- —
Short-term bridge; refi at stabilization.
Rent comps 12 comps
| Address | Beds | Baths | Sqft | Rent | $/sqft | DOM | Units | Dist |
|---|---|---|---|---|---|---|---|---|
| 905 26th Ave N Bessemer, AL | 4.0 | 2.0 | 1218 | $1,200 | $0.99 | 1d | 1 | 0.15mi |
| 3447 Jeanne Ln Bessemer, AL | 3.0 | 2.0 | 1460 | $1,850 | $1.27 | 1d | 1 | 0.25mi |
| 1013 25th Ave N Bessemer, AL | 3.0 | 2.0 | 1144 | $1,546 | $1.35 | 15d | 1 | 0.36mi |
| 1032 26th Ave N Bessemer, AL | 3.0 | 1.0 | 1724 | $1,175 | $0.68 | 2d | 1 | 0.36mi |
| 1036 Rose Hill Cir Bessemer, AL | 3.0 | 2.0 | 1277 | $1,300 | $1.02 | 21d | 1 | 0.52mi |
| 428 Willow Ln Bessemer, AL | 4.0 | 2.0 | 1375 | $1,620 | $1.18 | 14d | 1 | 0.54mi |
| 1314 22nd Ave N Bessemer, AL | 3.0 | 1.0 | 1038 | $1,000 | $0.96 | 43d | 1 | 0.85mi |
| 2129 13th St N Bessemer, AL | 4.0 | 1.0 | 1378 | $1,445 | $1.05 | 14d | 1 | 0.90mi |
| 2028 13th St N Bessemer, AL | 3.0 | 2.0 | 1372 | $1,073 | $0.78 | 23d | 1 | 0.99mi |
| 1623 26th Ave N Bessemer, AL | 2.0 | 1.0 | 1004 | $1,095 | $1.09 | 11d | 1 | 1.04mi |
| 1929 15th St N Bessemer, AL | 3.0 | 2.0 | 1140 | $1,250 | $1.10 | 19d | 1 | 1.22mi |
| 2234 19th St N Bessemer, AL | 2.0 | 1.0 | 1106 | $975 | $0.88 | 43d | 1 | 1.33mi |
Listing history 12 events
-
2026-05-26$74,900 Active
-
2026-05-22soldstatus Sold
-
2026-05-19status Pending
-
2026-05-09historical Contingent
-
2026-05-08price $74,900
-
2026-05-07$69,900 Active
-
2016-03-22soldstatus $32,000 Sold 257-char remark
Show marketing remark (257 chars)
REDUCED!!!This home waits for that first time homebuyer. You have 3 bedrooms and 1 bath. And there is a basement in which can be used to exercise that design potential. Also according to County tax records there is appx. 2.27 acres of land at your disposal.
-
2016-02-19status Pending 257-char remark
Show marketing remark (257 chars)
REDUCED!!!This home waits for that first time homebuyer. You have 3 bedrooms and 1 bath. And there is a basement in which can be used to exercise that design potential. Also according to County tax records there is appx. 2.27 acres of land at your disposal.
-
2016-02-12price $32,900 257-char remark
Show marketing remark (257 chars)
REDUCED!!!This home waits for that first time homebuyer. You have 3 bedrooms and 1 bath. And there is a basement in which can be used to exercise that design potential. Also according to County tax records there is appx. 2.27 acres of land at your disposal.
-
2016-01-11$39,900 Active 257-char remark
Show marketing remark (257 chars)
REDUCED!!!This home waits for that first time homebuyer. You have 3 bedrooms and 1 bath. And there is a basement in which can be used to exercise that design potential. Also according to County tax records there is appx. 2.27 acres of land at your disposal.
-
1986-10-09soldstatus $41,500
-
1979-05-01soldstatus $35,500
ⓘ Source: listings_history table (triggers on properties + properties_extension) + one-shot
backfill from property_details.listing_events for pre-trigger history.
Tax reassessment forecast AL · Resets to sale price
- Current annual tax
- $1,011 · $84/mo
- Projected year-2 tax
- $1,011 · $84/mo
- Expected delta
- $0/yr ($0/mo · -0.0%)
ⓘ Screening estimate from a state-policy table — verify with the county assessor before closing.
Climate risk First Street
- Flood 1/10 Low FEMA zone X (unshaded) · 0% chance over 30 yrs
- Wildfire 4/10 Moderate
- Heat 6/10 Major 7 d/yr ≥109°F today · 19 d/yr by 30 yrs out
- Wind 6/10 Major 41% chance of damaging wind over 30 yrs
- Air quality 3/10 Moderate 2 unhealthy d/yr today · 5 by 30 yrs out
Nearby sold comps map
Loading sold comps map…
Walkable amenities ~0.75 mi
Loading nearby amenities…
Taxation est. · year 1
- Rental income
- $17,169
- − Mortgage interest
- −$4,196
- − Property taxes
- −$1,011
- − Insurance
- −$374
- − Repairs & maintenance
- −$1,373
- − Management
- −$1,373
- − Depreciation
- −$2,179
- Taxable income
- $6,662
- Est. tax owed @ 24.0%
- −$1,599
- After-tax cash flow
- $5,866/yr
For passive investors: Depreciation is non-cash, so a rental often shows a tax loss while cash-flowing — sheltering income. Rental losses are passive: they offset passive income freely, and up to $25,000/yr can offset ordinary (W-2) income if you actively participate and your MAGI is under $100k (phasing out to $0 by $150k); unused losses carry forward. On sale, claimed depreciation is recaptured at up to 25%, and gains may owe capital-gains tax (a 1031 exchange can defer both). Figures are a year-1 estimate at your 24.0% rate — not tax advice; consult a CPA.
Schools (NCES district)
- District
- Jefferson County
- NCES district ID
- 0101920
- Math proficiency
- 9% ▼ -24.00%
- Reading proficiency
- 32% ▼ -5.00%
- Median HH income
- $51,712
- Composite
- 18.4/100
- National rank
- #8937
- State rank
- #104 of 129 in AL
Livability — Hueytown
- Score
- 57/100
- State rank
- #378
- US rank
- #21611
Category grades
Schools grade is shown separately in the Schools card above.
Census & demographics
- County
- Jefferson County · 527,445 people
- Metro
- Birmingham-Hoover, AL
- Population (ZIP)
- 25,533
- Household income
- $69,863
- Rent vs Own
- Severe rent burden
- 247.0
Population outlook (Jefferson County) Hauer SSP2
- Today (2025)
- 669,185 people
- By 2030
- 669,694 · +0.1%
- By 2040
- 661,388 · -1.2%
- By 2050
- 643,086 · -3.9%
- By 2075
- 577,267 · -13.7%
- By 2100
- 474,758 · -29.1%
Race, ethnicity, and origin ACS 2023
- Neighborhood character
- Diverse neighborhood (Simpson 0.56)
- Race & ethnicity
- White 58% Black 30% Hispanic / Latino 7% Two or more races 3%
- Hispanic origin (detail)
- Mexican 5%
- Common ancestry
- Slovak 1% Lithuanian 1% Serbian 1%
- Foreign-born
- 4% · Canada
- Languages at home
- 93% English-only · Spanish 7%
Political lean MEDSL · Jefferson
- 2024 margin
- D (+10.4) · D 54.6% · R 44.2% · Other 1.2%
- 2008→2024 swing
- +5.4pp toward D · 2008: 5.1pp · 2024: 10.4pp
- All cycles
- 2024: D+10.4 2020: D+13.2 2016: D+7.2 2012: D+6.0 2008: D+5.1
Not yet ingested
- Civics
- —
Market trends
- HPI YoY
- ▼ -0.60%
- Current HPI
- 389.38
- Rent YoY
- ▲ 1.60%
- Metro
- Birmingham-Hoover, AL
- State GDP YoY
- ▲ 2.94%
- F500 in state
- 4
Industry mix (Fortune 500 HQ in AL)
| Industry | F500 HQs | Revenue |
|---|---|---|
| Financial Services | 1 | $8B |
|
||
| Healthcare | 1 | $5B |
|
||
Price history
+111.0% since first listed12 events — show timeline
- 2026-05-26 Listed $74,900 Greater Alabama MLS
- 2026-05-22 Sold (MLS) — Greater Alabama MLS
- 2026-05-19 Pending — Greater Alabama MLS
- 2026-05-09 Contingent — Greater Alabama MLS
- 2026-05-08 Price Changed $74,900 Greater Alabama MLS
- 2026-05-07 Listed $69,900 Greater Alabama MLS
- 2016-03-22 Sold (MLS) $32,000 Greater Alabama MLS
- 2016-02-19 Pending — Greater Alabama MLS
- 2016-02-12 Price Changed $32,900 Greater Alabama MLS
- 2016-01-11 Listed $39,900 Greater Alabama MLS
- 1986-10-09 Sold (Public Records) $41,500 Public Records
- 1979-05-01 Sold (Public Records) $35,500 Public Records
Property tax history
+4.9%/yrLatest (2025): $1,011 · +0.0% YoY. Source: county tax records.
Cash-flow waterfall
monthlySold comps — $/sqft
last 12 mo · ≤1 miLoading sold comps…