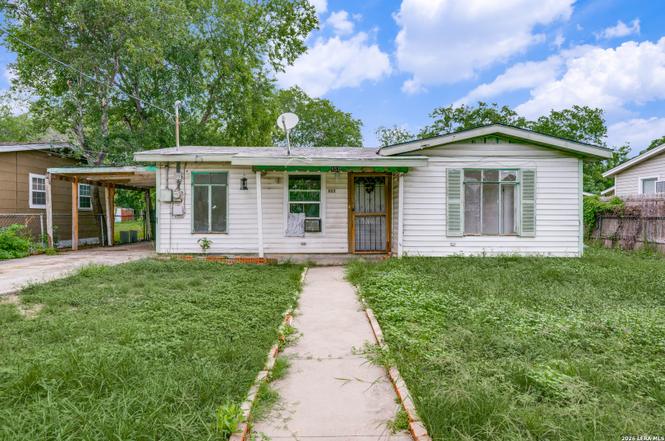
853 Holmgreen Rd · San Antonio, TX
Flood risk 1/10 · Minimal
- FEMA flood zone
- X (unshaded)
- Chance of flooding over 30 yrs
- 0.0%
- Est. flood insurance / yr
- $507 – $1,088
Fire risk 3/10 · Minor
- Est. fire insurance / yr
- $1,222 – $2,270
Heat risk 8/10 · Major
- Hot days now (above 108°F)
- 7 days/yr
- Hot days in 30 yrs
- 22 days/yr
Wind risk 8/10 · Major
- Chance of severe wind over 30 yrs
- 80.0%
Air-quality risk 2/10 · Minimal
- Unhealthy air days now
- 0 days/yr
- Unhealthy air days in 30 yrs
- 2 days/yr
Risk factors via First Street. Map © Google.
Why this score? — see what drove the B+ grade
The composite is a weighted blend of 9 inputs, each scored 0–100. Each bar is that input's sub-score; the figure is the points it added to the 100-point composite (weight × sub-score).
- Cash flow +25.5/30.0
- ARV discount +15.0/15.0
- Appreciation +10.0/10.0
- 1% rule +8.9/10.0
- DSCR +8.4/10.0
- Livability +4.0/5.0
- Rent growth +2.6/5.0
- Condition / age +2.5/5.0
- Schools +1.4/10.0
$109,900
🖨 Deal sheet 📄 Offer letter ✓ Due diligence
Listing remarks
Investor Special! Opportunity awaits with this spacious 4 bedroom, 2 bath home conveniently located just minutes from the Frost Bank Center, major highways, shopping, dining, and downtown San Antonio. This property offers a generous living space, and plenty of potential for a fix and flip, rental investment, or owner occupant renovation project. Sold AS-IS. Cash, conventional, or renovation financing welcome. Bring your vision and unlock the potential this property has to offer!
Key facts
- 8,624 sq ft lot
- Built 1953
- Listed 11 days
Property features AI
Finance
- Other: For sale; Possession at closing/funding
- HOA & community: Subdivision: RICE ROAD
Exterior
- Utilities: City water; City sewer; On-site water and sewer systems
- Home design: Pre-owned home; Approximately 73 years old
- Construction: Slab foundation; Composition roof
- Exterior features: Siding exterior
Interior
- Kitchen: 12 x 11 kitchen; Stove/Range
- Bedrooms: Master bedroom with full bath (11 x 10); Bedroom 2 (10 x 10); Bedroom 3 (10 x 10); Bedroom 4 (10 x 10)
- Flooring: Ceramic tile floor
- Bathrooms: 2 full bathrooms; Master bath with shower only and single vanity (9 x 8)
- Heating & cooling: Electric heating; Three or more heating units; Three or more window air-conditioning units
- Interior features: Single living area; Cable TV available; High-speed internet available; Laundry room; Washer and dryer connections; Stove/Range included
- Laundry & utility: Laundry room; Washer connection; Dryer connection
Neighborhood map
What this means for you Summary
Snapshot
- This is a 3-bed/2.0-bath single-family listed at $110k.
Deal economics
- At list price, monthly cash flow is $255 ($3k/yr) — positive.
- The deal already cash-flows at list — no discount required.
- Meets the 1% rule at list price ($2k rent vs $110k).
- Cap rate 9.1% vs local median 3.8% in San Antonio — top-decile yield for the area; either an underpriced asset or a hidden risk that comps aren't pricing in. Stress-test before assuming the spread holds.
Location & tenants
- Location reads 80/100 on livability (#31 in TX, #1,616 nationally) — a professional / high-income tenant draw. Strengths: amenities A+, commute A+, cost of living A+; Watch: schools C-, crime F.
- San Antonio ISD (urban): math 12% / reading 22% proficiency, ranked #805 of 826 in TX (top 98%) — low school quality limits family demand, transient renter base, plan for 1-2y turnover; 80% free/reduced lunch — lower-income household profile, screen leases tightly.
- Market conditions: Rents flat; 113 active listings in the ZIP; 21 comparable units currently listed for rent nearby; rentals at typical pace (median 16d on market — plan ~3-4 weeks tenant-placement turnaround); lower-income renter base — watch delinquency; 8,308 units permitted in Bexar County in 2024 (2,506 in 5+ unit buildings).
- This rent runs 44% of the median local income ($42k/yr) — at the standard rent-burdened threshold; future hikes will face affordability resistance.
Forward outlook
- In year one you build about $12k of equity ($760 loan paydown + $11k appreciation (10.0% local appreciation)).
- Bexar County population projected at +50% by 2050 — long-run rental-demand tailwind backs the buy-and-hold thesis.
- At projected returns (10.0% appreciation + 0.5% rent growth), your $31k cash investment doubles in ~3 years — after that, you're playing with house money.
- By year 4, paydown + projected appreciation supports a ~$42k cash-out refi (75% LTV) — recoverable capital for the next deal without selling this one.
Negotiation context
- Only 11 days on market — expect competitive offers; lowballing is unlikely to land.
- 10 sale attempts since 3y ago with the ask held roughly flat each time — persistent listings suggest the price (not the market) is what's stuck; bring a comps-based counter.
Risks & watch-outs
- Watch-outs: property tax is 3.6% of price; built in 1953 — expect roof / HVAC / electrical / plumbing capex.
- Climate carrying-cost: severe wind risk, 80% chance of damaging wind over 30y; extreme-heat days projected 7→22/yr by 2055 (HVAC capex compounding) — expect insurance premiums to compound above CPI over the hold.
Questions for the listing agent
- Built in 1953 — when were the roof, HVAC, electrical panel, plumbing, and water heater last replaced?
- Property tax is high relative to price — has the assessment been appealed recently, and will the sale trigger a re-assessment?
- Is there a deadline driving the sale (1031 exchange, divorce, estate, relocation)? That informs how much negotiation room exists.
- Crime grade is F in this area — have there been break-ins, vandalism, or insurance claims at this property in the last 3 years? What carrier currently insures it and at what premium?
- What's the average days-on-market for RENTAL listings here right now (not sales)? A rising rental-DOM trend means longer vacancies and softer asking-rent achievability than the comps imply.
- What's the recent tenant-quality profile in this submarket — average credit score on applications, eviction rate, late-payment / NSF rate, and stable-employment percentage? A property-management company in the area should have these aggregated.
- How much new for-sale + rental construction is in the pipeline within 1–3 miles? Heavy new supply typically softens prices + rents 12–24 months out; constrained supply supports both.
Investment metrics
- 1% rule
- 1.39% ✓
- Cap rate
- 9.08%
- Cash-on-cash
- 9.95%
- DSCR
- 1.44
- GRM
- 6.0
CMA / ARV
- ARV (on-the-fly)
- $191,935
- Comps found
- 12
Show comp detail 12 sales within ~0.75 mi
| Address | Dist | Beds/Ba | Sqft | Sold | Price | $/sf | Match |
|---|---|---|---|---|---|---|---|
| 4631 Bernadine Dr | 0.12mi | 3/1.0 | 1,484 (-11%) | 9mo | $198,000 | $133 | 65 |
| 4703 Seabreeze | 0.35mi | 3/2.0 | 1,592 (-5%) | 14mo | $195,000 | $122 | 64 |
| 4411 Lakewood | 0.44mi | 3/2.0 | 1,492 (-11%) | 2mo | $96,000 | $64 | 60 |
| 4542 Lord | 0.43mi | 3/1.5 | 1,562 (-6%) | 10mo | $129,999 | $83 | 59 |
| 735 Rice Rd | 0.27mi | 3/2.0 | 1,475 (-12%) | 12mo | $144,990 | $98 | 58 |
| 206 Roesler Rd | 0.62mi | 3/1.5 | 1,645 (-1%) | 10mo | $169,900 | $103 | 58 |
| 2035 Leesburg St | 0.58mi | 3/2.0 | 1,822 (+9%) | 0mo | $175,000 | $96 | 57 |
| 1911 Dellhaven Dr | 0.41mi | 4/2.0 (+1) | 1,877 (+12%) | 1mo | $215,000 | $115 | 54 |
| 4603 Lavender | 0.73mi | 3/2.0 | 1,491 (-11%) | 4mo | $230,000 | $154 | 44 |
| 4835 Lakewood Dr | 0.41mi | 4/2.0 (+1) | 1,490 (-11%) | 18mo | $195,000 | $131 | 43 |
| 2410 Tyne | 0.69mi | 3/2.0 | 1,907 (+14%) | 3mo | $159,600 | $84 | 42 |
| 802 Cresthill Rd | 0.70mi | 3/2.0 | 1,427 (-14%) | 18mo | $235,000 | $165 | 28 |
Match score weights: distance 35% · size 25% · config 20% · recency 20%. Top-matched comps best support the ARV.
Projected returns pro-forma
10.0% appreciation · 0.53% rent growth · sell at horizon
- IRR
- 30.3%
- Equity multiple
- 3.36×
- Total profit
- $72,545
- Equity at exit
- $99,007
- IRR
- 25.4%
- Equity multiple
- 7.32×
- Total profit
- $194,338
- Equity at exit
- $213,512
Cash invested: $30,772 (down + closing). Projections, not guarantees.
Landlord ↔ Tenant lean methodology
- Overall (STATE)
- 87 Strongly Landlord-Friendly
- State Texas
- 87 Strongly Landlord-Friendly · R+5
- County
- — inherits STATE
- City
- — inherits STATE
ZIP-level market 78220
- Home prices YoY
- 9.1%
- Rents YoY
- 0.5%
- Active inventory
- 113
- Price-to-rent
- 6.0×
Monthly cashflow live
- Estimated rent
- $1,529 high interval (Pro) →
- Mortgage (P&I)
- −$576
- Tax from tax record
- −$331 /mo · $3,968/yr
- Insurance
- −$46
- HOA
- −$0
- Vacancy / Maint / Mgmt
- −$321
- Net cashflow
- $255
Break-even live
UW: 25.0% down · 7.5% · 30yr · 1.5% tax · 5.0% vac · 8.0% maint · 8.0% mgmt
Financing live
Cash to close
- Down payment
- $27,475
- Closing costs
- $3,297
- Reserves months
- —
- Total cash needed
- —
Loan-product check · same deal, 3 products live
Conventional
25% down · 7.5% · 30yr
- Down + closing
- —
- Monthly P&I
- —
- Monthly cashflow
- —
- DSCR
- —
- Eligible?
- —
Personal DTI + credit; lowest rate.
DSCR
20% down · 8.5% · 30yr
- Down + closing
- —
- Monthly P&I
- —
- Monthly cashflow
- —
- DSCR
- —
- Eligible?
- —
No personal income docs; deal must DSCR.
Hard money
10% down · 12.0% · 12mo
- Down + closing
- —
- Monthly P&I
- —
- Monthly cashflow
- —
- DSCR
- —
- Eligible?
- —
Short-term bridge; refi at stabilization.
Rent comps 21 comps
| Address | Beds | Baths | Sqft | Rent | $/sqft | DOM | Units | Dist |
|---|---|---|---|---|---|---|---|---|
| 4519 Creekmoor Dr San Antonio, TX | 3.0 | 2.0 | 1239 | $1,395 | $1.13 | 11d | 1 | 0.19mi |
| 4938 Bernadine Dr San Antonio, TX | 3.0 | 2.0 | 1078 | $2,000 | $1.86 | 23d | 1 | 0.49mi |
| 2027 Leesburg St San Antonio, TX | 3.0 | 2.0 | 1506 | $1,545 | $1.03 | 43d | 1 | 0.55mi |
| 262 Orchard Rd San Antonio, TX | 3.0 | 1.0 | 1134 | $1,250 | $1.10 | 43d | 1 | 0.57mi |
| 5026 Benham Dr San Antonio, TX | 4.0 | 1.0 | 1700 | $1,750 | $1.03 | 17d | 1 | 0.60mi |
| 2906 Lavender Ln San Antonio, TX | 3.0 | 2.5 | 1247 | $1,595 | $1.28 | 16d | 1 | 0.71mi |
| 4610 Lavender Ln San Antonio, TX | 3.0 | 2.0 | 1337 | $1,400 | $1.05 | 23d | 1 | 0.71mi |
| 1415 Semlinger Rd San Antonio, TX | 3.0 | 2.0 | 1508 | $1,850 | $1.23 | 12d | 1 | 0.71mi |
| 319 Charcliff Dr San Antonio, TX | 3.0 | 2.0 | 1890 | $1,495 | $0.79 | 43d | 1 | 0.95mi |
| 707 SE Loop 410 San Antonio, TX | 1.0–4.0 | 1.0–2.0 | 1139 | $1,216 | $1.07 | 4d | 1 | 1.00mi |
| 4606 Hollyspring Dr San Antonio, TX | 3.0 | 2.0 | 1098 | $1,400 | $1.28 | 23d | 1 | 1.01mi |
| 368 Readwell Dr San Antonio, TX | 3.0 | 1.0 | 1067 | $1,200 | $1.12 | 43d | 1 | 1.16mi |
| 2430 Bermuda Dr San Antonio, TX | 3.0 | 2.0 | 1298 | $1,390 | $1.07 | 12d | 1 | 1.22mi |
| 2434 Bermuda Dr San Antonio, TX | 3.0 | 2.0 | 1298 | $1,414 | $1.09 | 4d | 1 | 1.22mi |
| 5334 Natho St San Antonio, TX | 3.0 | 2.0 | 1298 | $1,325 | $1.02 | 4d | 1 | 1.28mi |
| 5338 Natho St San Antonio, TX | 3.0 | 2.0 | 1298 | $1,349 | $1.04 | 12d | 1 | 1.29mi |
| 334 Tomrob Dr San Antonio, TX | 3.0 | 1.0 | 1064 | $1,300 | $1.22 | 14d | 1 | 1.30mi |
| 2719 Bermuda Dr San Antonio, TX | 3.0 | 2.0 | 1298 | $1,364 | $1.05 | 4d | 1 | 1.36mi |
| 4611 E Houston St San Antonio, TX | 2.0–4.0 | 2.0 | 1286 | $1,290 | $1.00 | 1d | 23 | 1.36mi |
| 2718 Bermuda Dr San Antonio, TX | 3.0 | 3.0 | 1080 | $1,400 | $1.30 | 20d | 1 | 1.38mi |
| 231 Noblewood Dr San Antonio, TX | 1.0–4.0 | 1.0–2.0 | 1084 | $1,387 | $1.28 | 23d | 1 | 1.49mi |
Listing history 9 events
-
2026-06-18days on market $109,900 Active 11 DOM
-
2026-06-18status $109,900 Active 10 DOM
-
2026-06-17days on market $109,900 New 10 DOM
-
2026-06-16days on market $109,900 New 9 DOM
-
2026-06-15days on market $109,900 New 8 DOM
-
2026-06-13days on market $109,900 New 6 DOM
-
2026-06-09days on market $109,900 New 2 DOM
-
2026-06-08remarks 483-char remark
-
2026-06-08$109,900 New 1 DOM
ⓘ Source: listings_history table (triggers on properties + properties_extension) + one-shot
backfill from property_details.listing_events for pre-trigger history.
Tax reassessment forecast TX · Resets to sale price
- Current annual tax
- $3,968 · $331/mo
- Projected year-2 tax
- $3,968 · $331/mo
- Expected delta
- $0/yr ($0/mo · 0.0%)
ⓘ Screening estimate from a state-policy table — verify with the county assessor before closing.
Climate risk First Street
- Flood 1/10 Low FEMA zone X (unshaded) · 0% chance over 30 yrs
- Wildfire 3/10 Moderate
- Heat 8/10 Severe 7 d/yr ≥108°F today · 22 d/yr by 30 yrs out
- Wind 8/10 Severe 80% chance of damaging wind over 30 yrs
- Air quality 2/10 Low 0 unhealthy d/yr today · 2 by 30 yrs out
Nearby sold comps map
Loading sold comps map…
Walkable amenities ~0.75 mi
Loading nearby amenities…
Taxation est. · year 1
- Rental income
- $18,351
- − Mortgage interest
- −$6,156
- − Property taxes
- −$3,968
- − Insurance
- −$550
- − Repairs & maintenance
- −$1,468
- − Management
- −$1,468
- − Depreciation
- −$3,197
- Taxable income
- $1,543
- Est. tax owed @ 24.0%
- −$370
- After-tax cash flow
- $2,693/yr
For passive investors: Depreciation is non-cash, so a rental often shows a tax loss while cash-flowing — sheltering income. Rental losses are passive: they offset passive income freely, and up to $25,000/yr can offset ordinary (W-2) income if you actively participate and your MAGI is under $100k (phasing out to $0 by $150k); unused losses carry forward. On sale, claimed depreciation is recaptured at up to 25%, and gains may owe capital-gains tax (a 1031 exchange can defer both). Figures are a year-1 estimate at your 24.0% rate — not tax advice; consult a CPA.
Schools (NCES district)
- District
- San Antonio ISD
- NCES district ID
- 4838730
- Math proficiency
- 12% ▼ -21.00%
- Reading proficiency
- 22% ▼ -7.00%
- Median HH income
- $30,952
- Composite
- 13.57/100
- National rank
- #9512
- State rank
- #805 of 826 in TX
Livability — San Antonio
- Score
- 80/100
- State rank
- #31
- US rank
- #1616
Category grades
Schools grade is shown separately in the Schools card above.
Census & demographics
- Census place
- San Antonio, TX
- County
- Bexar County · 1,990,555 people
- City population
- 1,806,925
- Metro
- San Antonio-New Braunfels, TX
- Population (ZIP)
- 19,423
- Household income
- $41,710
- Rent vs Own
- Severe rent burden
- 705.0
Population outlook (Bexar County) Hauer SSP2
- Today (2025)
- 2,336,851 people
- By 2030
- 2,560,728 · +9.6%
- By 2040
- 3,020,569 · +29.3%
- By 2050
- 3,493,522 · +49.5%
- By 2075
- 4,668,459 · +99.8%
- By 2100
- 5,533,242 · +136.8%
Race, ethnicity, and origin ACS 2023
- Neighborhood character
- Majority Hispanic (60%)
- Race & ethnicity
- Hispanic / Latino 60% Black 30% Two or more races 22% White 8%
- Hispanic origin (detail)
- Mexican 47% Puerto Rican 1%
- Foreign-born
- 11% · Canada
- Languages at home
- 63% English-only · Spanish 36%
Political lean MEDSL · Bexar
- 2024 margin
- Lean D (+9.8) · D 54.3% · R 44.6% · Other 1.1%
- 2008→2024 swing
- +4.2pp toward D · 2008: 5.6pp · 2024: 9.8pp
- All cycles
- 2024: D+9.8 2020: D+18.2 2016: D+13.5 2012: D+4.6 2008: D+5.6
Not yet ingested
- Civics
- —
Market trends
- HPI YoY
- ▲ 23.86%
- Current HPI
- 284.9844
- Rent YoY
- ▲ 0.53%
- Metro
- San Antonio-New Braunfels, TX
- State GDP YoY
- ▲ 3.95%
- F500 in state
- 110
Industry mix (Fortune 500 HQ in TX)
| Industry | F500 HQs | Revenue |
|---|---|---|
| Energy | 16 | $1,198B |
|
||
| Technology | 5 | $198B |
|
||
| Engineering / Construction | 4 | $72B |
|
||
| Energy Services | 3 | $60B |
|
||
| Utilities | 3 | $41B |
|
||
| Healthcare | 2 | $330B |
|
||
Price history
-37.2% since first listed27 events — show timeline
- 2026-06-07 Listed $109,900 LERA
- 2026-04-21 Sold (Public Records) — Public Records
- 2026-04-13 Listing Removed — LERA
- 2026-03-30 Relisted — LERA
- 2026-03-24 Contingent — LERA
- 2026-03-03 Listed $145,000 LERA
- 2024-05-16 Listing Removed — LERA
- 2024-02-07 Price Changed $139,900 LERA
- 2024-01-19 Listed $144,990 LERA
- 2023-11-29 Listing Removed — LERA
- 2023-10-24 Contingent — LERA
- 2023-10-24 Relisted — LERA
- 2023-10-24 Listing Removed — LERA
- 2023-10-06 Price Changed $144,990 LERA
- 2023-09-20 Listed $150,000 LERA
- 2023-09-12 Listing Removed — LERA
- 2023-09-11 Relisted — LERA
- 2023-09-06 Relisted — LERA
- 2023-08-31 Listing Removed — LERA
- 2023-05-31 Price Changed $164,900 LERA
- 2023-04-28 Price Changed $175,000 LERA
- 2023-04-19 Price Changed $200,000 LERA
- 2023-04-18 Relisted — LERA
- 2023-03-18 Listing Removed — LERA
- 2023-02-19 Listed $175,000 LERA
- 1998-06-22 Sold (Public Records) — Public Records
- 1987-11-01 Sold (Public Records) — Public Records
Property tax history
+9.0%/yrLatest (2025): $3,968 · +0.0% YoY. Source: county tax records.
Cash-flow waterfall
monthlySold comps — $/sqft
last 12 mo · ≤1 miLoading sold comps…