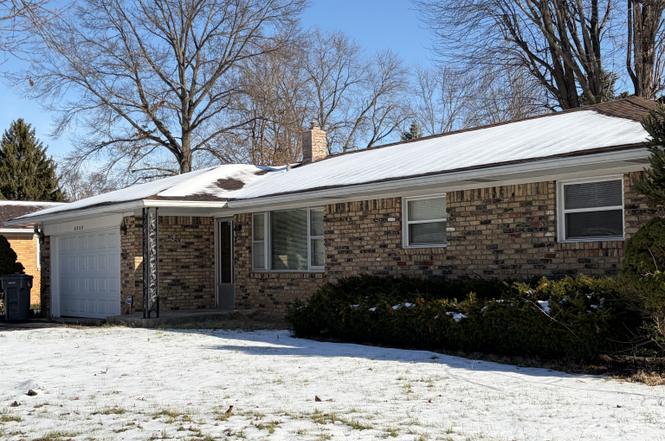
6819 Brill Rd · Indianapolis city (balance), IN
Flood risk 5/10 · Moderate
- FEMA flood zone
- X (unshaded)
- Chance of flooding over 30 yrs
- 0.66%
- Est. flood insurance / yr
- $507 – $1,088
Fire risk 1/10 · Minimal
- Est. fire insurance / yr
- $717 – $1,331
Heat risk 4/10 · Minor
- Hot days now (above 102°F)
- 7 days/yr
- Hot days in 30 yrs
- 19 days/yr
Wind risk 2/10 · Minimal
- Chance of severe wind over 30 yrs
- 1.0%
Air-quality risk 3/10 · Minor
- Unhealthy air days now
- 2 days/yr
- Unhealthy air days in 30 yrs
- 3 days/yr
Risk factors via First Street. Map © Google.
Why this score? — see what drove the B- grade
The composite is a weighted blend of 9 inputs, each scored 0–100. Each bar is that input's sub-score; the figure is the points it added to the 100-point composite (weight × sub-score).
- Cash flow +30.0/30.0
- 1% rule +10.0/10.0
- DSCR +10.0/10.0
- ARV discount +7.5/15.0
- Schools +3.5/10.0
- Rent growth +3.1/5.0
- Livability +2.5/5.0
- Condition / age +2.5/5.0
- Appreciation +0.0/10.0
$90,000
🖨 Deal sheet 📄 Offer letter ✓ Due diligence
Listing remarks MLS
WE'RE BACK ON THE MARKET W/ A NEW FURNACE, NEW WATER HEATER, & UPDATED ELECTRICAL. THIS IS A WONDERFUL AREA OF ALL BRICK HOMES. SOME HARDWOOD FLOORS-BEAUTIFUL LOT W/ MATURE TREES. YOUR BUYER WILL ENJOY THE AUTUMN THIS Y EAR FROM HIS OWN PATIO W/ THE TURNING OF THE LEAVES.
Key facts
- 0.29 acre lot
- Garage
- Built 1964
Neighborhood map
What this means for you Summary
Snapshot
- This is a 3-bed/2.0-bath single-family listed at $90k.
Deal economics
- At list price, monthly cash flow is $591 ($7k/yr) — positive.
- The deal already cash-flows at list — no discount required.
- Meets the 1% rule at list price ($2k rent vs $90k).
- Cap rate 14.2% vs local median 4.4% in Indianapolis city (balance) — top-decile yield for the area; either an underpriced asset or a hidden risk that comps aren't pricing in. Stress-test before assuming the spread holds.
Location & tenants
- Location reads: area grade B — affects rentability + tenant quality, not the cash-flow math above.
- Perry Township Schools (urban): math 36% / reading 45% proficiency, ranked #138 of 301 in IN (top 46%) — families likely to look elsewhere, expect single-tenant / working-renter base with shorter leases.
- Zoned schools: William Henry Burkhart Elementary (math 47% / reading 46%, grade D-, #355 of 994 statewide, top 36%, 650 students, 84% FRL); Perry Meridian High School (math 34% / reading 64%, grade D, #136 of 369 statewide, top 37%, 2,350 students, 58% FRL) — zoned schools average 71% FRL vs 54% district-wide (17 pts higher); higher-poverty schools than district average — tighter screening recommended.
- Market conditions: Rents rising (+2.5%/yr); 245 active listings in the ZIP; 14 comparable units currently listed for rent nearby; rentals leasing fast (median 5d on market — plan ~1-2 weeks tenant-placement turnaround); 1,906 units permitted in Marion County in 2024 (621 in 5+ unit buildings).
- This rent runs 36% of the median local income ($54k/yr) — at the standard rent-burdened threshold; future hikes will face affordability resistance.
Forward outlook
- Local home prices are declining (-3.0%/yr); year-one equity from $622 of loan paydown is wiped out by about $3k of value loss. Plan a longer hold.
- Marion County population projected at +18% by 2050 — long-run rental-demand tailwind backs the buy-and-hold thesis.
- At projected returns (-3.0% appreciation + 2.5% rent growth), your $25k cash investment doubles in ~5 years — after that, you're playing with house money.
Negotiation context
- Only 1 days on market — expect competitive offers; lowballing is unlikely to land.
- 3 sale attempts since 25y ago with the ask held roughly flat each time — persistent listings suggest the price (not the market) is what's stuck; bring a comps-based counter.
Risks & watch-outs
- Climate carrying-cost: moderate flood risk — expect insurance premiums to compound above CPI over the hold.
Questions for the listing agent
- Built in 1964 — when were the roof, HVAC, electrical panel, plumbing, and water heater last replaced?
- Is there a deadline driving the sale (1031 exchange, divorce, estate, relocation)? That informs how much negotiation room exists.
- What's the average days-on-market for RENTAL listings here right now (not sales)? A rising rental-DOM trend means longer vacancies and softer asking-rent achievability than the comps imply.
- What's the recent tenant-quality profile in this submarket — average credit score on applications, eviction rate, late-payment / NSF rate, and stable-employment percentage? A property-management company in the area should have these aggregated.
- How much new for-sale + rental construction is in the pipeline within 1–3 miles? Heavy new supply typically softens prices + rents 12–24 months out; constrained supply supports both.
Investment metrics
- 1% rule
- 1.79% ✓
- Cap rate
- 14.18%
- Cash-on-cash
- 28.16%
- DSCR
- 2.25
- GRM
- 4.7
CMA / ARV
- ARV (on-the-fly)
- $233,280
- Comps found
- 12
Show comp detail 12 sales within ~0.75 mi
| Address | Dist | Beds/Ba | Sqft | Sold | Price | $/sf | Match |
|---|---|---|---|---|---|---|---|
| 6838 Hi Vu Dr | 0.05mi | 3/2.0 | 1,235 (+2%) | 0mo | $270,000 | $219 | 95 |
| 65 E Tulip Dr | 0.20mi | 2/1.0 (-1) | 1,216 (+0%) | 2mo | $195,000 | $160 | 80 |
| 6494 Crimson Circle East Dr | 0.43mi | 3/1.5 | 1,224 (+1%) | 4mo | $210,000 | $172 | 73 |
| 410 E Southport Rd | 0.19mi | 3/1.5 | 1,353 (+11%) | 3mo | $220,000 | $163 | 68 |
| 7050 Camden St | 0.62mi | 3/1.5 | 1,224 (+1%) | 10mo | $235,000 | $192 | 60 |
| 128 Dahlia Ln | 0.70mi | 3/2.0 | 1,231 (+1%) | 8mo | $277,500 | $225 | 59 |
| 7528 S New Jersey St | 0.73mi | 3/1.5 | 1,202 (-1%) | 7mo | $192,000 | $160 | 57 |
| 234 E Hickory Ln | 0.61mi | 3/1.5 | 1,278 (+5%) | 7mo | $250,000 | $196 | 55 |
| 207 E Waterbury Rd | 0.50mi | 3/1.0 | 1,302 (+7%) | 8mo | $275,000 | $211 | 54 |
| 931 Maynard Dr | 0.58mi | 3/2.0 | 1,326 (+9%) | 5mo | $243,000 | $183 | 54 |
| 7060 S Meridian St | 0.42mi | 3/2.0 | 1,372 (+13%) | 10mo | $230,000 | $168 | 50 |
| 246 Griffin Rd | 0.69mi | 3/1.5 | 1,100 (-10%) | 7mo | $235,500 | $214 | 44 |
Match score weights: distance 35% · size 25% · config 20% · recency 20%. Top-matched comps best support the ARV.
Projected returns pro-forma
-3.0% appreciation · 2.46% rent growth · sell at horizon
- IRR
- 21.8%
- Equity multiple
- 1.88×
- Total profit
- $22,277
- Equity at exit
- $13,419
- IRR
- 29.5%
- Equity multiple
- 3.56×
- Total profit
- $64,617
- Equity at exit
- $7,782
Cash invested: $25,200 (down + closing). Projections, not guarantees.
Landlord ↔ Tenant lean methodology
- Overall (STATE)
- 90 Strongly Landlord-Friendly
- State Indiana
- 90 Strongly Landlord-Friendly · R+11
- County
- — inherits STATE
- City
- — inherits STATE
ZIP-level market 46227
- Rents YoY
- 2.5%
- Active inventory
- 245
- Price-to-rent
- 4.7×
Monthly cashflow live
- Estimated rent
- $1,612 high interval (Pro) →
- Mortgage (P&I)
- −$472
- Tax from tax record
- −$172 /mo · $2,069/yr
- Insurance
- −$38
- HOA
- −$0
- Vacancy / Maint / Mgmt
- −$338
- Net cashflow
- $591
Break-even live
UW: 25.0% down · 7.5% · 30yr · 1.5% tax · 5.0% vac · 8.0% maint · 8.0% mgmt
Financing live
Cash to close
- Down payment
- $22,500
- Closing costs
- $2,700
- Reserves months
- —
- Total cash needed
- —
Loan-product check · same deal, 3 products live
Conventional
25% down · 7.5% · 30yr
- Down + closing
- —
- Monthly P&I
- —
- Monthly cashflow
- —
- DSCR
- —
- Eligible?
- —
Personal DTI + credit; lowest rate.
DSCR
20% down · 8.5% · 30yr
- Down + closing
- —
- Monthly P&I
- —
- Monthly cashflow
- —
- DSCR
- —
- Eligible?
- —
No personal income docs; deal must DSCR.
Hard money
10% down · 12.0% · 12mo
- Down + closing
- —
- Monthly P&I
- —
- Monthly cashflow
- —
- DSCR
- —
- Eligible?
- —
Short-term bridge; refi at stabilization.
Rent comps 14 comps
| Address | Beds | Baths | Sqft | Rent | $/sqft | DOM | Units | Dist |
|---|---|---|---|---|---|---|---|---|
| 6789 S East St Indianapolis, IN | 1.0–3.0 | 1.0–2.0 | 1075 | $1,459 | $1.36 | 2d | 24 | 0.36mi |
| 6512 Bridge Crossing Dr Indianapolis, IN | 1.0–2.0 | 1.0–2.0 | 965 | $2,177 | $2.26 | 1d | 27 | 0.43mi |
| 7266 Lockwood Ln Indianapolis, IN | 1.0–2.0 | 1.0–2.0 | 824 | $1,440 | $1.75 | 2d | 18 | 0.71mi |
| 7114 McLain Dr Indianapolis, IN | 3.0 | 2.0 | 1000 | $1,650 | $1.65 | 3d | 1 | 0.81mi |
| 7621 Orchard Village Dr Indianapolis, IN | 2.0 | 2.0 | 1082 | $1,400 | $1.29 | 23d | 1 | 0.95mi |
| 1451 E Southport Rd Indianapolis, IN | 1.0–3.0 | 1.0–2.5 | 1250 | $1,656 | $1.32 | 1d | 13 | 1.02mi |
| 7536 S Katherine Dr Indianapolis, IN | 3.0 | 2.0 | 1161 | $1,816 | $1.56 | 23d | 1 | 1.13mi |
| 6933 Buckridge West Dr Unit 6909-A Indianapolis, IN | 2.0 | 1.0 | 889 | $1,100 | $1.24 | 23d | 1 | 1.18mi |
| 6933 Buckridge West Dr Unit 6909-D Indianapolis, IN | 2.0 | 1.0 | 889 | $985 | $1.11 | 23d | 1 | 1.18mi |
| 6933 E Buckridge Dr Indianapolis, IN | 1.0–2.0 | 1.0 | 754 | $1,100 | $1.46 | 2d | 10 | 1.21mi |
| 8141 Valley Estates Dr Indianapolis, IN | 3.0 | 2.0 | 1302 | $1,650 | $1.27 | 7d | 1 | 1.37mi |
| 1542 Citrin Pl Unit 1538 Indianapolis, IN | 3.0 | 2.5 | 1299 | $1,755 | $1.35 | 16d | 1 | 1.48mi |
| 1542 Citrin Pl Indianapolis, IN | 3.0 | 2.5 | 1299 | $1,755 | $1.35 | 3d | 1 | 1.48mi |
| 1542 Citrin Pl Unit 7810 Indianapolis, IN | 2.0 | 2.0 | 1027 | $1,505 | $1.47 | 4d | 1 | 1.48mi |
Listing history 7 events
-
2026-01-10status Pending
-
2026-01-09$90,000 Active
-
2001-12-06soldstatus $98,444
-
2001-11-28soldstatus $99,000 276-char remark
Show marketing remark (276 chars)
WE'RE BACK ON THE MARKET W/ A NEW FURNACE, NEW WATER HEATER, & UPDATED ELECTRICAL. THIS IS A WONDERFUL AREA OF ALL BRICK HOMES. SOME HARDWOOD FLOORS-BEAUTIFUL LOT W/ MATURE TREES. YOUR BUYER WILL ENJOY THE AUTUMN THIS Y EAR FROM HIS OWN PATIO W/ THE TURNING OF THE LEAVES.
-
2001-09-06$99,700 276-char remark
Show marketing remark (276 chars)
WE'RE BACK ON THE MARKET W/ A NEW FURNACE, NEW WATER HEATER, & UPDATED ELECTRICAL. THIS IS A WONDERFUL AREA OF ALL BRICK HOMES. SOME HARDWOOD FLOORS-BEAUTIFUL LOT W/ MATURE TREES. YOUR BUYER WILL ENJOY THE AUTUMN THIS Y EAR FROM HIS OWN PATIO W/ THE TURNING OF THE LEAVES.
-
2001-08-17historical
-
2001-04-17$99,700
ⓘ Source: listings_history table (triggers on properties + properties_extension) + one-shot
backfill from property_details.listing_events for pre-trigger history.
Tax reassessment forecast IN · Partial reset (capped growth)
- Current annual tax
- $2,069 · $172/mo
- Projected year-2 tax
- $2,069 · $172/mo
- Expected delta
- $0/yr ($0/mo · 0.0%)
ⓘ Screening estimate from a state-policy table — verify with the county assessor before closing.
Climate risk First Street
- Flood 5/10 Major FEMA zone X (unshaded) · 66% chance over 30 yrs
- Wildfire 1/10 Low
- Heat 4/10 Moderate 7 d/yr ≥102°F today · 19 d/yr by 30 yrs out
- Wind 2/10 Low 100% chance of damaging wind over 30 yrs
- Air quality 3/10 Moderate 2 unhealthy d/yr today · 3 by 30 yrs out
Nearby sold comps map
Loading sold comps map…
Walkable amenities ~0.75 mi
Loading nearby amenities…
Taxation est. · year 1
- Rental income
- $19,342
- − Mortgage interest
- −$5,041
- − Property taxes
- −$2,069
- − Insurance
- −$450
- − Repairs & maintenance
- −$1,547
- − Management
- −$1,547
- − Depreciation
- −$2,618
- Taxable income
- $6,069
- Est. tax owed @ 24.0%
- −$1,456
- After-tax cash flow
- $5,641/yr
For passive investors: Depreciation is non-cash, so a rental often shows a tax loss while cash-flowing — sheltering income. Rental losses are passive: they offset passive income freely, and up to $25,000/yr can offset ordinary (W-2) income if you actively participate and your MAGI is under $100k (phasing out to $0 by $150k); unused losses carry forward. On sale, claimed depreciation is recaptured at up to 25%, and gains may owe capital-gains tax (a 1031 exchange can defer both). Figures are a year-1 estimate at your 24.0% rate — not tax advice; consult a CPA.
Schools (NCES district)
- District
- Perry Township Schools
- NCES district ID
- 1808820
- Math proficiency
- 36% ▼ -13.00%
- Reading proficiency
- 45% ▼ -6.00%
- Median HH income
- $47,170
- Composite
- 34.61/100
- National rank
- #5153
- State rank
- #138 of 301 in IN
Livability — Indianapolis city (balance)
No livability data for this city. (Only ~50 U.S. cities are tracked.)
Census & demographics
- Census place
- Indianapolis city (balance), IN
- County
- Marion County · 998,460 people
- City population
- 881,119
- Metro
- Indianapolis-Carmel-Anderson, IN
- Population (ZIP)
- 57,587
- Household income
- $53,629
- Rent vs Own
- Severe rent burden
- 3583.0
Population outlook (Marion County) Hauer SSP2
- Today (2025)
- 1,025,572 people
- By 2030
- 1,065,727 · +3.9%
- By 2040
- 1,141,577 · +11.3%
- By 2050
- 1,208,920 · +17.9%
- By 2075
- 1,367,288 · +33.3%
- By 2100
- 1,438,201 · +40.2%
Race, ethnicity, and origin ACS 2023
- Neighborhood character
- Diverse neighborhood (Simpson 0.59)
- Race & ethnicity
- White 61% Asian 12% Black 11% Hispanic / Latino 10% Two or more races 8%
- Hispanic origin (detail)
- Mexican 8%
- Common ancestry
- Italian 2% Slovak 2% Lithuanian 1%
- Foreign-born
- 17% · Philippines, Canada, Vietnam
- Languages at home
- 79% English-only · Other Asian/Pacific 9% Spanish 7% Other Indo-European 1%
Political lean MEDSL · Marion
- 2024 margin
- Strong D (+27.7) · D 63.0% · R 35.3% · Other 1.7%
- 2008→2024 swing
- -0.7pp no change · 2008: 28.4pp · 2024: 27.7pp
- All cycles
- 2024: D+27.7 2020: D+29.1 2016: D+22.8 2012: D+22.2 2008: D+28.4
Not yet ingested
- Civics
- —
Market trends
- HPI YoY
- ▼ -260.49%
- Current HPI
- 276.8271
- Rent YoY
- ▲ 2.46%
- Metro
- Indianapolis-Carmel-Anderson, IN
- State GDP YoY
- ▲ 2.90%
- F500 in state
- 18
Industry mix (Fortune 500 HQ in IN)
| Industry | F500 HQs | Revenue |
|---|---|---|
| Industrial Machinery | 2 | $37B |
|
||
| Healthcare | 1 | $177B |
|
||
| Pharmaceuticals | 1 | $45B |
|
||
| Metals / Steel | 1 | $18B |
|
||
| Agriculture | 1 | $17B |
|
||
| Packaging | 1 | $12B |
|
||
Price history
-9.7% since first listed7 events — show timeline
- 2026-01-10 Pending — MIBOR as Distributed by MLS Grid
- 2026-01-09 Listed $90,000 MIBOR as Distributed by MLS Grid
- 2001-12-06 Sold (Public Records) $98,444 Public Records
- 2001-11-28 Sold (MLS) $99,000 MIBOR as Distributed by MLS Grid
- 2001-09-06 Listed $99,700 MIBOR as Distributed by MLS Grid
- 2001-08-17 Listing Removed — MIBOR as Distributed by MLS Grid
- 2001-04-17 Listed $99,700 MIBOR as Distributed by MLS Grid
Property tax history
+4.1%/yrLatest (2025): $2,069 · -11.3% YoY. Source: county tax records.
Cash-flow waterfall
monthlySold comps — $/sqft
last 12 mo · ≤1 miLoading sold comps…