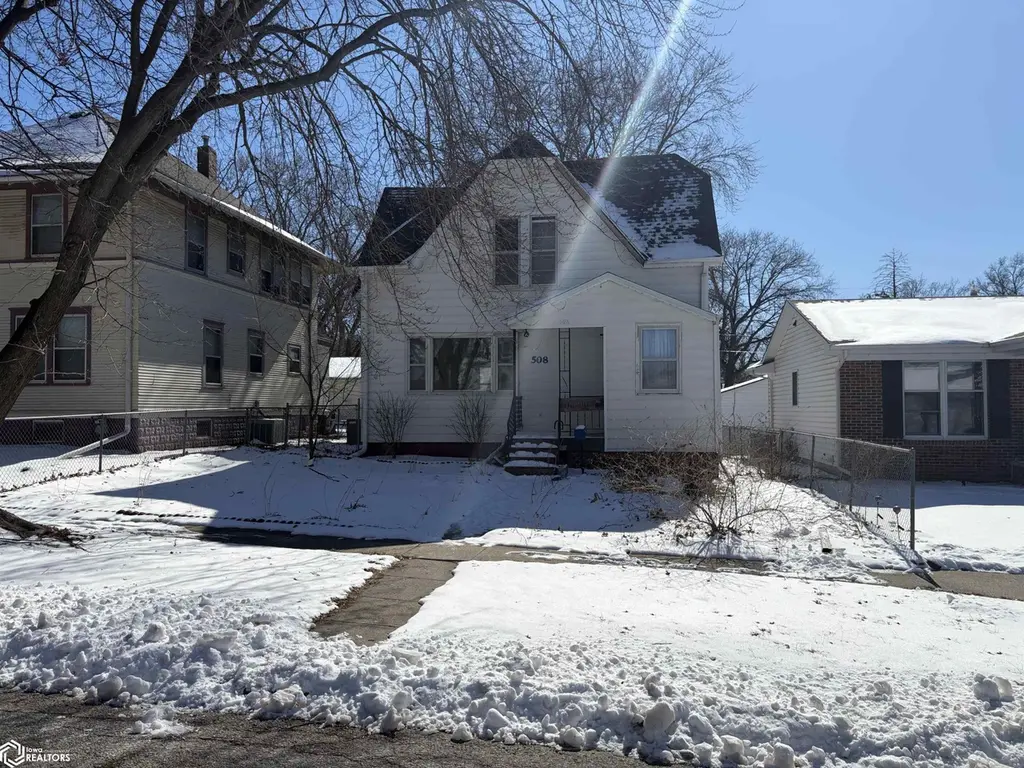
508 E Elm St · Red Oak, IA
Flood risk 1/10 · Minimal
- FEMA flood zone
- X (unshaded)
- Chance of flooding over 30 yrs
- 0.0%
- Est. flood insurance / yr
- $473 – $860
Fire risk 1/10 · Minimal
- Est. fire insurance / yr
- $902 – $1,676
Heat risk 3/10 · Minor
- Hot days now (above 106°F)
- 7 days/yr
- Hot days in 30 yrs
- 15 days/yr
Wind risk 2/10 · Minimal
- Chance of severe wind over 30 yrs
- —
Air-quality risk 1/10 · Minimal
- Unhealthy air days now
- 0 days/yr
- Unhealthy air days in 30 yrs
- 0 days/yr
Risk factors via First Street. Map © Google.
Why this score? — see what drove the B+ grade
The composite is a weighted blend of 9 inputs, each scored 0–100. Each bar is that input's sub-score; the figure is the points it added to the 100-point composite (weight × sub-score).
- Cash flow +30.0/30.0
- ARV discount +15.0/15.0
- 1% rule +10.0/10.0
- DSCR +10.0/10.0
- Schools +4.9/10.0
- Livability +3.4/5.0
- Rent growth +2.5/5.0
- Condition / age +2.5/5.0
- Appreciation +0.0/10.0
$79,900
🖨 Deal sheet (PDF) 📄 Offer letter ✓ Due diligence
Listing remarks MLS
- * * Value * * : Priced to sell, this home presents an excellent opportunity for buyers looking to put their personal touch on a solid investment. - * * Potential * * : With some cosmetic updates, this property can easily increase in value, making it ideal for first-time homeowners or investors. This home combines practicality with potential, making it a worthwhile consideration for anyone seeking a property that can be transformed into a personalized haven.
Key facts
- 5,227 sq ft lot
- Built 1900
- Listed 116 days
Neighborhood map
What this means for you Summary
Snapshot
- This is a 3-bed/1.5-bath single-family listed at $80k.
Deal economics
- At list price, monthly cash flow is $442 ($5k/yr) — positive.
- The deal already cash-flows at list — no discount required.
- Meets the 1% rule at list price ($1k rent vs $80k).
- Recommended offer: $73k (9.0% below list) — sets the bar for market timing.
- Cap rate 12.9% vs local median 3.6% in Red Oak — top-decile yield for the area; either an underpriced asset or a hidden risk that comps aren't pricing in. Stress-test before assuming the spread holds.
Location & tenants
- Location reads 68/100 on livability (#428 in IA) — a middle-class / working-renter tenant base. Strengths: cost of living A+, housing A+, health & safety A+; Watch: employment D+, amenities F, commute F.
- Red Oak Community School District (town): math 58% / reading 59% proficiency, ranked #255 of 289 in IA (top 88%) — acceptable for families but not a draw, mixed tenant base, ~2y average lease.
- Market conditions: 56 active listings in the ZIP; 13 units permitted in Montgomery County in 2024 (0 in 5+ unit buildings).
Forward outlook
- Local home prices are declining (-3.0%/yr); year-one equity from $552 of loan paydown is wiped out by about $2k of value loss. Plan a longer hold.
- Montgomery County population projected at -20% by 2050 — secular population decline; favor cash flow + early exit over multi-decade hold.
- At projected returns (-3.0% appreciation + 3.0% rent growth), your $22k cash investment doubles in ~6 years — after that, you're playing with house money.
Negotiation context
- It's been on market 116 days — a 9% lower offer ($73k) is reasonable based on typical stale-listing flexibility.
- 7 sale attempts since 5y ago; this cycle's ask has dropped $15k (16%) from the opening price — seller is motivated, your offer sets the floor, not the list.
Risks & watch-outs
- Watch-outs: built in 1900 — expect roof / HVAC / electrical / plumbing capex.
Questions for the listing agent
- It's been on market 116 days. Have you received any prior offers? Is the seller open to a 9% concession, seller financing, or rate buy-down credit?
- Built in 1900 — when were the roof, HVAC, electrical panel, plumbing, and water heater last replaced?
- Why hasn't it sold? Are there any deal-killer items the seller is aware of (foundation, flood, title, zoning, code violations)?
- Is there a deadline driving the sale (1031 exchange, divorce, estate, relocation)? That informs how much negotiation room exists.
- What's the average days-on-market for RENTAL listings here right now (not sales)? A rising rental-DOM trend means longer vacancies and softer asking-rent achievability than the comps imply.
- What's the recent tenant-quality profile in this submarket — average credit score on applications, eviction rate, late-payment / NSF rate, and stable-employment percentage? A property-management company in the area should have these aggregated.
- How much new for-sale + rental construction is in the pipeline within 1–3 miles? Heavy new supply typically softens prices + rents 12–24 months out; constrained supply supports both.
Investment metrics
- 1% rule
- 1.62% ✓
- Cap rate
- 12.93%
- Cash-on-cash
- 23.71%
- DSCR
- 2.06
- GRM
- 5.1
CMA / ARV
- ARV (median comp)
- $108,709
- List price
- $79,900
- Delta
- -26.50%
- Verdict
- UNDERPRICED
- Comps
- 20 within 1.0 mi
Show comp detail 12 sales within ~0.75 mi
| Address | Dist | Beds/Ba | Sqft | Sold | Price | $/sf | Match |
|---|---|---|---|---|---|---|---|
| 709 Maple St | 0.14mi | 3/2.0 | 1,468 (-3%) | 3mo | $105,000 | $72 | 83 |
| 904 N 6th St | 0.15mi | 3/3.0 | 1,396 (-8%) | 3mo | $188,250 | $135 | 71 |
| 301 E Walnut St | 0.32mi | 3/2.0 | 1,405 (-8%) | 10mo | $140,000 | $100 | 63 |
| 706 E Prospect St | 0.14mi | 2/1.5 (-1) | 1,301 (-14%) | 7mo | $155,000 | $119 | 58 |
| 1600 N 1st St | 0.40mi | 3/2.0 | 1,392 (-8%) | 9mo | $145,000 | $104 | 58 |
| 1005 N 2nd St | 0.26mi | 3/2.0 | 1,294 (-15%) | 4mo | $55,000 | $43 | 58 |
| 1209 Miller Ave | 0.38mi | 3/2.0 | 1,644 (+8%) | 12mo | $189,000 | $115 | 57 |
| 1206 E Valley St | 0.49mi | 4/2.0 (+1) | 1,578 (+4%) | 11mo | $214,000 | $136 | 55 |
| 107 E Reed St | 0.42mi | 2/2.0 (-1) | 1,648 (+8%) | 9mo | $24,000 | $15 | 52 |
| 1109 E Reed St | 0.53mi | 3/2.0 | 1,380 (-9%) | 14mo | $110,000 | $80 | 46 |
| 210 N 8th St | 0.56mi | 3/2.0 | 1,732 (+14%) | 5mo | $50,000 | $29 | 44 |
| 1213 Circle Dr | 0.56mi | 3/2.0 | 1,712 (+13%) | 11mo | $188,000 | $110 | 41 |
Match score weights: distance 35% · size 25% · config 20% · recency 20%. Top-matched comps best support the ARV.
Projected returns pro-forma
-3.0% appreciation · 3.0% rent growth · sell at horizon
- IRR
- 16.9%
- Equity multiple
- 1.68×
- Total profit
- $15,246
- Equity at exit
- $11,913
- IRR
- 25.4%
- Equity multiple
- 3.22×
- Total profit
- $49,683
- Equity at exit
- $6,908
Cash invested: $22,372 (down + closing). Projections, not guarantees.
Landlord ↔ Tenant lean methodology
- Overall (STATE)
- 83 Strongly Landlord-Friendly
- State Iowa
- 83 Strongly Landlord-Friendly · R+6
- County
- — inherits STATE
- City
- — inherits STATE
ZIP-level market 51566
- Home prices YoY
- -33.3%
- Active inventory
- 56
- Price-to-rent
- 5.1×
Monthly cashflow live
- Estimated rent
- $1,296 medium interval (Pro) →
- Mortgage (P&I)
- −$419
- Tax from tax record
- −$129 /mo · $1,552/yr
- Insurance
- −$33
- HOA
- −$0
- Vacancy / Maint / Mgmt
- −$272
- Net cashflow
- $442
Break-even live
Sensitivity live
| Price | -10% $487 | -5% $465 | +0% $442 | +5% $419 | +10% $397 |
|---|---|---|---|---|---|
| Rent | -10% $340 | -5% $391 | +0% $442 | +5% $493 | +10% $544 |
| Rate | -1.0pp $482 | -0.5pp $462 | base $442 | +0.5pp $421 | +1.0pp $400 |
UW: 25.0% down · 7.5% · 30yr · 1.5% tax · 5.0% vac · 8.0% maint · 8.0% mgmt
Financing live
Cash to close
- Down payment
- $19,975
- Closing costs
- $2,397
- Reserves months
- —
- Total cash needed
- —
Loan-product check · same deal, 3 products live
Conventional
25% down · 7.5% · 30yr
- Down + closing
- —
- Monthly P&I
- —
- Monthly cashflow
- —
- DSCR
- —
- Eligible?
- —
Personal DTI + credit; lowest rate.
DSCR
20% down · 8.5% · 30yr
- Down + closing
- —
- Monthly P&I
- —
- Monthly cashflow
- —
- DSCR
- —
- Eligible?
- —
No personal income docs; deal must DSCR.
Hard money
10% down · 12.0% · 12mo
- Down + closing
- —
- Monthly P&I
- —
- Monthly cashflow
- —
- DSCR
- —
- Eligible?
- —
Short-term bridge; refi at stabilization.
Listing history 35 events
-
2026-06-21days on market $79,900 Active 116 DOM
-
2026-06-18days on market $79,900 Active 114 DOM
-
2026-06-17days on market $79,900 Active 113 DOM
-
2026-06-16days on market $79,900 Active 112 DOM
-
2026-06-15days on market $79,900 Active 111 DOM
-
2026-06-13days on market $79,900 Active 109 DOM
-
2026-06-12days on market $79,900 Active 108 DOM
-
2026-06-09days on market $79,900 Active 105 DOM
-
2026-06-08days on market $79,900 Active 104 DOM
-
2026-06-07days on market $79,900 Active 103 DOM
-
2026-06-05days on market $79,900 Active 101 DOM
-
2026-06-04days on market $79,900 Active 99 DOM
-
2026-06-02days on market $79,900 Active 98 DOM
-
2026-06-01days on market $79,900 Active 97 DOM
-
2026-05-31days on market $79,900 Active 96 DOM
-
2026-05-31days on market $79,900 Active 95 DOM
-
2026-03-20price $79,900 469-char remark
Show marketing remark (469 chars)
- * * Value * * : Priced to sell, this home presents an excellent opportunity for buyers looking to put their personal touch on a solid investment. - * * Potential * * : With some cosmetic updates, this property can easily increase in value, making it ideal for first-time homeowners or investors. This home combines practicality with potential, making it a worthwhile consideration for anyone seeking a property that can be transformed into a personalized haven.
-
2026-03-05price $89,900 469-char remark
Show marketing remark (469 chars)
- * * Value * * : Priced to sell, this home presents an excellent opportunity for buyers looking to put their personal touch on a solid investment. - * * Potential * * : With some cosmetic updates, this property can easily increase in value, making it ideal for first-time homeowners or investors. This home combines practicality with potential, making it a worthwhile consideration for anyone seeking a property that can be transformed into a personalized haven.
-
2026-02-24$94,900 Active 469-char remark
Show marketing remark (469 chars)
- * * Value * * : Priced to sell, this home presents an excellent opportunity for buyers looking to put their personal touch on a solid investment. - * * Potential * * : With some cosmetic updates, this property can easily increase in value, making it ideal for first-time homeowners or investors. This home combines practicality with potential, making it a worthwhile consideration for anyone seeking a property that can be transformed into a personalized haven.
-
2025-09-15price $110,000
-
2025-07-16price $115,000
-
2025-05-05$120,000 Active
-
2022-04-13soldstatus $74,000
-
2022-03-29soldstatus $74,000
-
2022-03-29soldstatus $74,000 Sold
-
2021-12-30status Pending
-
2021-12-28$72,000
-
2021-12-28$72,000 Active
-
2021-12-10historical
-
2021-10-29price $75,000
-
2021-08-24price $77,000
-
2021-06-24status Active
-
2021-06-22status Pending
-
2021-06-10$75,000
-
2021-06-10$79,000 Active
ⓘ Source: listings_history table (triggers on properties + properties_extension) + one-shot
backfill from property_details.listing_events for pre-trigger history.
Tax reassessment forecast IA · Partial reset (capped growth)
- Current annual tax
- $1,552 · $129/mo
- Projected year-2 tax
- $1,552 · $129/mo
- Expected delta
- $0/yr ($0/mo · 0.0%)
ⓘ Screening estimate from a state-policy table — verify with the county assessor before closing.
Climate risk First Street
- Flood 1/10 Low FEMA zone X (unshaded) · 0% chance over 30 yrs
- Wildfire 1/10 Low
- Heat 3/10 Moderate 7 d/yr ≥106°F today · 15 d/yr by 30 yrs out
- Wind 2/10 Low
- Air quality 1/10 Low 0 unhealthy d/yr today · 0 by 30 yrs out
Nearby sold comps map
Loading sold comps map…
Walkable amenities ~0.75 mi
Loading nearby amenities…
Taxation est. · year 1
- Rental income
- $15,550
- − Mortgage interest
- −$4,476
- − Property taxes
- −$1,552
- − Insurance
- −$400
- − Repairs & maintenance
- −$1,244
- − Management
- −$1,244
- − Depreciation
- −$2,324
- Taxable income
- $4,310
- Est. tax owed @ 24.0%
- −$1,034
- After-tax cash flow
- $4,270/yr
For passive investors: Depreciation is non-cash, so a rental often shows a tax loss while cash-flowing — sheltering income. Rental losses are passive: they offset passive income freely, and up to $25,000/yr can offset ordinary (W-2) income if you actively participate and your MAGI is under $100k (phasing out to $0 by $150k); unused losses carry forward. On sale, claimed depreciation is recaptured at up to 25%, and gains may owe capital-gains tax (a 1031 exchange can defer both). Figures are a year-1 estimate at your 24.0% rate — not tax advice; consult a CPA.
Schools (NCES district)
- District
- Red Oak Community School District
- NCES district ID
- 1924000
- Math proficiency
- 58% ▼ -6.00%
- Reading proficiency
- 59% ▲ 2.00%
- Median HH income
- $38,902
- Composite
- 48.77/100
- National rank
- #2092
- State rank
- #255 of 289 in IA
Livability — Red Oak
- Score
- 68/100
- State rank
- #428
- US rank
- #9239
Category grades
Schools grade is shown separately in the Schools card above.
Census & demographics
- Census place
- Red Oak, IA
- City population
- 7,004
- Population (ZIP)
- 7,004
Population outlook (Montgomery County) Hauer SSP2
- Today (2025)
- 9,518 people
- By 2030
- 9,116 · -4.2%
- By 2040
- 8,303 · -12.8%
- By 2050
- 7,595 · -20.2%
- By 2075
- 6,568 · -31.0%
- By 2100
- 5,800 · -39.1%
Race, ethnicity, and origin ACS 2023
- Neighborhood character
- Predominantly White (91%)
- Race & ethnicity
- White 91% Two or more races 4% Hispanic / Latino 1% Asian 1%
- Common ancestry
- Serbian 2% Romanian 1% Iranian 1%
- Foreign-born
- 2% · Canada
- Languages at home
- 98% English-only · Spanish 1%
Political lean MEDSL · Montgomery
- 2024 margin
- Solid R (+39.1) · D 29.8% · R 68.9% · Other 1.3%
- 2008→2024 swing
- -28.5pp toward R · 2008: -10.6pp · 2024: -39.1pp
- All cycles
- 2024: R+39.1 2020: R+39.0 2016: R+42.4 2012: R+21.6 2008: R+10.6
Not yet ingested
- Civics
- —
Market trends
- HPI YoY
- ▼ -93.42%
- Current HPI
- 187.1643
- Rent YoY
- —
- Metro
- —
- State GDP YoY
- ▲ 2.48%
- F500 in state
- 4
Industry mix (Fortune 500 HQ in IA)
| Industry | F500 HQs | Revenue |
|---|---|---|
| Financial Services | 1 | $16B |
|
||
| Retail / Convenience | 1 | $15B |
|
||
Price history
+6.5% since first listed19 events — show timeline
- 2026-03-20 Price Changed $79,900 IAR
- 2026-03-05 Price Changed $89,900 IAR
- 2026-02-24 Listed $94,900 IAR
- 2025-09-15 Price Changed $110,000 IAR
- 2025-07-16 Price Changed $115,000 IAR
- 2025-05-05 Listed $120,000 IAR
- 2022-04-13 Sold (Public Records) $74,000 Public Records
- 2022-03-29 Sold (MLS) $74,000 NORTHSTARMLS as Distributed by MLS Grid
- 2022-03-29 Sold (MLS) $74,000 IAR
- 2021-12-30 Pending — NORTHSTARMLS as Distributed by MLS Grid
- 2021-12-28 Listed $72,000 NORTHSTARMLS as Distributed by MLS Grid
- 2021-12-28 Listed $72,000 IAR
- 2021-12-10 Listing Removed — NORTHSTARMLS as Distributed by MLS Grid
- 2021-10-29 Price Changed $75,000 NORTHSTARMLS as Distributed by MLS Grid
- 2021-08-24 Price Changed $77,000 NORTHSTARMLS as Distributed by MLS Grid
- 2021-06-24 Relisted — NORTHSTARMLS as Distributed by MLS Grid
- 2021-06-22 Pending — NORTHSTARMLS as Distributed by MLS Grid
- 2021-06-10 Listed $79,000 NORTHSTARMLS as Distributed by MLS Grid
- 2021-06-10 Listed $75,000 IAR
Property tax history
+2.3%/yrLatest (2025): $1,552 · +4.6% YoY. Source: county tax records.
Cash-flow waterfall
monthlySold comps — $/sqft
last 12 mo · ≤1 miLoading sold comps…