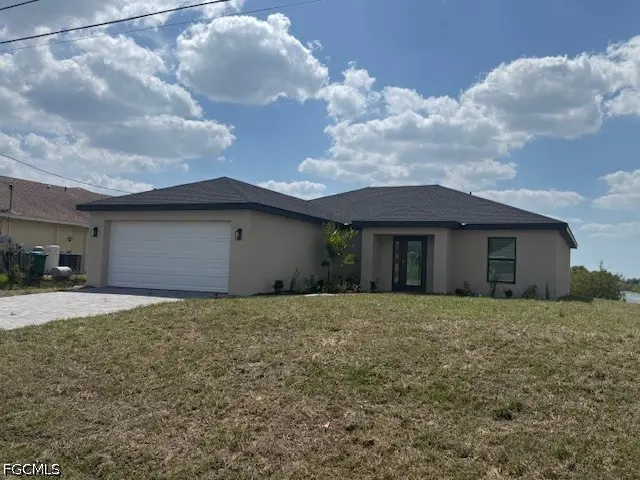
1104 NW 12th Ave · Cape Coral, FL
Flood risk 5/10 · Moderate
- FEMA flood zone
- X (unshaded)
- Chance of flooding over 30 yrs
- 0.24%
- Est. flood insurance / yr
- $507 – $1,088
Fire risk 1/10 · Minimal
- Est. fire insurance / yr
- $947 – $1,759
Heat risk 10/10 · Severe
- Hot days now (above 107°F)
- 7 days/yr
- Hot days in 30 yrs
- 29 days/yr
Wind risk 10/10 · Severe
- Chance of severe wind over 30 yrs
- 99.0%
Air-quality risk 2/10 · Minimal
- Unhealthy air days now
- 1 days/yr
- Unhealthy air days in 30 yrs
- 1 days/yr
Risk factors via First Street. Map © Google.
Why this score? — see what drove the D- grade
The composite is a weighted blend of 9 inputs, each scored 0–100. Each bar is that input's sub-score; the figure is the points it added to the 100-point composite (weight × sub-score).
- Cash flow +11.4/30.0
- ARV discount +7.5/15.0
- Schools +4.1/10.0
- Livability +3.9/5.0
- DSCR +3.3/10.0
- Condition / age +2.5/5.0
- 1% rule +2.1/10.0
- Rent growth +1.1/5.0
- Appreciation +0.0/10.0
$299,900
🖨 Deal sheet (PDF) 📄 Offer letter ✓ Due diligence
Listing remarks MLS
Prime residential WATERFRONT building site -- cleared and ready for your Florida Dream home! Ideally located in a QUIET neighborhood of newer homes. Enjoy the tropical lifestyle on a freshwater canal where you can fish and launch your boat right from your own back yard! Quick access to all the amenities of the Pine Island Corridor -- shopping, restaurants, entertainment. Buy now while prices are still low. Build now or hold for future appreciation. Either way, YOU WIN! (Assessment area "North 6." Start date "Future--TBD. ")
Key facts
- Wider water views
- 0.23 acre lot
- 2 garage spots
Tags
Property features AI
Finance
- Financial info: Pets allowed
- HOA & community: No association fee
Exterior
- Parking: Attached 2-car garage
- Security: Smoke detectors
- Utilities: Cable available; Septic tank; Well water
- Home design: Single-story; Entry level 1; North-facing; New construction
- Construction: Block, concrete and stucco construction; Shingle roof; Waterfront property
- Exterior features: Open porch; Canal access; South exposure; Oversized lot
Interior
- Kitchen: Dishwasher; Disposal; Icemaker; Microwave; Range; Refrigerator; Refrigerator with ice maker
- Bedrooms: Entry-level bedrooms
- Flooring: Tile flooring
- Bathrooms: 2 full bathrooms
- Heating & cooling: Central heating (electric); Central air conditioning (electric); Ceiling fans
- Interior features: Cathedral and vaulted ceilings; Bar; Shutters; Impact glass windows; Unfurnished
Neighborhood map
What this means for you Summary
Snapshot
- This is a 3-bed/2.0-bath land listed at $300k.
Deal economics
- At list price, monthly cash flow is $-105 ($-1k/yr) — negative.
- To cash-flow at today's rent, offer at most $281k (6.2% below list).
- To meet the 1% rule (rent ≥ 1% of price), the offer needs to be $213k (29.0% below list).
- Recommended offer: $213k (29.0% below list) — sets the bar for 1% rule.
- Cap rate 5.9% vs local median 3.1% in Cape Coral — top-decile yield for the area; either an underpriced asset or a hidden risk that comps aren't pricing in. Stress-test before assuming the spread holds.
Location & tenants
- Location reads 77/100 on livability (#208 in FL, #3,098 nationally) — a middle-class / working-renter tenant base. Strengths: housing A+, health & safety A+, amenities B+; Watch: commute F.
- Lee (suburban): math 47% / reading 50% proficiency, ranked #42 of 73 in FL (top 58%) — families likely to look elsewhere, expect single-tenant / working-renter base with shorter leases.
- Zoned schools: Gulf Elementary School (math 70% / reading 65%, grade B+, #435 of 2,144 statewide, top 21%, 1,231 students, 38% FRL); Challenger Middle School (math 59% / reading 56%, grade B, #157 of 571 statewide, top 28%, 1,124 students, 50% FRL); Ida S. Baker High School (math 44% / reading 47%, grade D-, #223 of 667 statewide, top 34%, 1,933 students, 39% FRL) — zoned schools average 42% FRL vs 57% district-wide (15 pts lower); this property's tenant base skews higher-income than the district average.
- Market conditions: Rents falling (-5.5%/yr); 2671 active listings in the ZIP; 40 comparable units currently listed for rent nearby; rentals at typical pace (median 16d on market — plan ~3-4 weeks tenant-placement turnaround); solid renter incomes; 15,411 units permitted in Lee County in 2024 (4,686 in 5+ unit buildings).
Forward outlook
- Local home prices are declining (-3.0%/yr); year-one equity from $2k of loan paydown is wiped out by about $9k of value loss. Plan a longer hold.
- Lee County population projected at +44% by 2050 — long-run rental-demand tailwind backs the buy-and-hold thesis.
Negotiation context
- Only 13 days on market — expect competitive offers; lowballing is unlikely to land.
- 2 sale attempts since 5y ago with the ask held roughly flat each time — persistent listings suggest the price (not the market) is what's stuck; bring a comps-based counter.
- Current owner paid $40k; list at $300k implies a 652% gain — meaningful room to come down on a strong offer.
Risks & watch-outs
- Climate carrying-cost: moderate flood risk; severe wind risk, 99% chance of damaging wind over 30y; extreme-heat days projected 7→29/yr by 2055 (HVAC capex compounding) — expect insurance premiums to compound above CPI over the hold.
Questions for the listing agent
- What do current leases actually rent for vs. the listed asking? Can we see a recent rent roll and the last 12 months of T-12 income?
- Is there a deadline driving the sale (1031 exchange, divorce, estate, relocation)? That informs how much negotiation room exists.
- Schools are B-rated — typically a magnet for longer-tenancy family renters. What's the average tenant stay here, and is there a school-zone premium baked into asking?
- The area grade is low — what's the realistic commute time and amenity access for the typical tenant pool here? Any planned neighborhood developments (good or bad) we should know about?
- What's the average days-on-market for RENTAL listings here right now (not sales)? A rising rental-DOM trend means longer vacancies and softer asking-rent achievability than the comps imply.
- What's the recent tenant-quality profile in this submarket — average credit score on applications, eviction rate, late-payment / NSF rate, and stable-employment percentage? A property-management company in the area should have these aggregated.
- How much new for-sale + rental construction is in the pipeline within 1–3 miles? Heavy new supply typically softens prices + rents 12–24 months out; constrained supply supports both.
Investment metrics
- 1% rule
- 0.71% ✗
- Cap rate
- 5.87%
- Cash-on-cash
- -1.50%
- DSCR
- 0.93
- GRM
- 11.7
CMA / ARV
No comps found within radius.
Projected returns pro-forma
-3.0% appreciation · 0.0% rent growth · sell at horizon
- IRR
- -21.7%
- Equity multiple
- 0.27×
- Total profit
- $-61,642
- Equity at exit
- $44,716
- IRR
- -23.4%
- Equity multiple
- -0.04×
- Total profit
- $-86,948
- Equity at exit
- $25,930
Cash invested: $83,972 (down + closing). Projections, not guarantees.
Landlord ↔ Tenant lean methodology
- Overall (STATE)
- 87 Strongly Landlord-Friendly
- State Florida
- 87 Strongly Landlord-Friendly · R+3
- County
- — inherits STATE
- City
- — inherits STATE
ZIP-level market 33993
- Home prices YoY
- -14.1%
- Rents YoY
- -5.5%
- Active inventory
- 2671
- Price-to-rent
- 11.7×
Monthly cashflow live
- Estimated rent
- $2,128 high interval (Pro) →
- Mortgage (P&I)
- −$1,573
- Tax from tax record
- −$88 /mo · $1,061/yr
- Insurance
- −$125
- HOA
- −$0
- Vacancy / Maint / Mgmt
- −$447
- Net cashflow
- $-105
Break-even live
Sensitivity live
| Price | -10% $65 | -5% $-20 | +0% $-105 | +5% $-190 | +10% $-274 |
|---|---|---|---|---|---|
| Rent | -10% $-273 | -5% $-189 | +0% $-105 | +5% $-21 | +10% $64 |
| Rate | -1.0pp $46 | -0.5pp $-28 | base $-105 | +0.5pp $-182 | +1.0pp $-261 |
UW: 25.0% down · 7.5% · 30yr · 1.5% tax · 5.0% vac · 8.0% maint · 8.0% mgmt
Financing live
Cash to close
- Down payment
- $74,975
- Closing costs
- $8,997
- Reserves months
- —
- Total cash needed
- —
Loan-product check · same deal, 3 products live
Conventional
25% down · 7.5% · 30yr
- Down + closing
- —
- Monthly P&I
- —
- Monthly cashflow
- —
- DSCR
- —
- Eligible?
- —
Personal DTI + credit; lowest rate.
DSCR
20% down · 8.5% · 30yr
- Down + closing
- —
- Monthly P&I
- —
- Monthly cashflow
- —
- DSCR
- —
- Eligible?
- —
No personal income docs; deal must DSCR.
Hard money
10% down · 12.0% · 12mo
- Down + closing
- —
- Monthly P&I
- —
- Monthly cashflow
- —
- DSCR
- —
- Eligible?
- —
Short-term bridge; refi at stabilization.
Rent comps 40 comps
| Address | Beds | Baths | Sqft | Rent | $/sqft | DOM | Units | Dist |
|---|---|---|---|---|---|---|---|---|
| 1120 NW 11th Pl Cape Coral, FL | 3.0 | 2.0 | 1528 | $1,816 | $1.19 | 15d | 1 | 0.11mi |
| 1426 NW 12th St Cape Coral, FL | 3.0 | 2.0 | 1455 | $1,699 | $1.17 | 23d | 1 | 0.31mi |
| 1426 NW 12th St Cape Coral, FL | 3.0 | 2.0 | 1455 | $1,699 | $1.17 | 15d | 1 | 0.31mi |
| 1426 NW 12th St Cape Coral, FL | 3.0 | 2.0 | 1455 | $1,699 | $1.17 | 12d | 1 | 0.31mi |
| 1012 NW 15th Ave Cape Coral, FL | 3.0 | 2.0 | 1805 | $1,985 | $1.10 | 25d | 1 | 0.34mi |
| 916 NW 15th Ave Cape Coral, FL | 3.0 | 2.0 | 1458 | $1,890 | $1.30 | 5d | 1 | 0.38mi |
| 1212 Chiquita Blvd N Cape Coral, FL | 3.0 | 2.0 | 1672 | $2,100 | $1.26 | 25d | 1 | 0.48mi |
| 910 NW 8th Ter Cape Coral, FL | 3.0 | 2.0 | 1619 | $2,100 | $1.30 | 17d | 1 | 0.55mi |
| 1411 NW 9th Ave Cape Coral, FL | 4.0 | 2.0 | 1760 | $2,150 | $1.22 | 15d | 1 | 0.66mi |
| 1406 NW 8th Pl Cape Coral, FL | 3.0 | 2.0 | 1403 | $1,855 | $1.32 | 25d | 1 | 0.66mi |
| 1827 NW 10th St Cape Coral, FL | 3.0 | 2.0 | 1864 | $2,050 | $1.10 | 25d | 1 | 0.76mi |
| 1731 NW 14th St Cape Coral, FL | 4.0 | 2.0 | 1337 | $1,866 | $1.40 | 5d | 1 | 0.79mi |
| 1137 NW 19th Ave Cape Coral, FL | 4.0 | 2.0 | 1771 | $2,215 | $1.25 | 15d | 1 | 0.81mi |
| 1101 NW 19th Pl Cape Coral, FL | 4.0 | 2.0 | 1711 | $1,900 | $1.11 | 5d | 1 | 0.86mi |
| 526 NW 9th St Cape Coral, FL | 4.0 | 2.0 | 1800 | $2,100 | $1.17 | 5d | 1 | 0.88mi |
| 1156 NW 5th Pl Cape Coral, FL | 3.0 | 2.0 | 1458 | $1,695 | $1.16 | 21d | 1 | 0.90mi |
| 1150 NW 19th Pl Cape Coral, FL | 4.0 | 2.0 | 1833 | $1,895 | $1.03 | 3d | 1 | 0.90mi |
| 1129 NW 20th Ave Cape Coral, FL | 4.0 | 2.0 | 1828 | $2,200 | $1.20 | 25d | 1 | 0.92mi |
| 1129 NW 20th Ave Cape Coral, FL | 4.0 | 2.0 | 1828 | $2,180 | $1.19 | 23d | 1 | 0.92mi |
| 1818 Diplomat Pkwy W Cape Coral, FL | 4.0 | 2.0 | 1787 | $2,025 | $1.13 | 25d | 1 | 0.98mi |
| 1501 NW 4th St Cape Coral, FL | 4.0 | 2.0 | 1809 | $3,800 | $2.10 | 5d | 1 | 0.99mi |
| 1822 Diplomat Pkwy W Cape Coral, FL | 4.0 | 2.0 | 1787 | $2,145 | $1.20 | 25d | 1 | 0.99mi |
| 532 NW 18th Ave Cape Coral, FL | 3.0 | 2.0 | 1765 | $2,000 | $1.13 | 25d | 1 | 0.99mi |
| 1143 NW 4th Pl Cape Coral, FL | 3.0 | 2.0 | 1399 | $1,750 | $1.25 | 5d | 1 | 1.03mi |
| 1909 NW 6th Ter Cape Coral, FL | 3.0 | 2.0 | 1828 | $1,895 | $1.04 | 5d | 1 | 1.03mi |
| 1909 NW 6th Ter Cape Coral, FL | 4.0 | 2.0 | 1828 | $1,895 | $1.04 | 4d | 1 | 1.03mi |
| 521 NW 14th Ter Cape Coral, FL | 4.0 | 2.0 | 1737 | $1,821 | $1.05 | 5d | 1 | 1.03mi |
| 2014 NW 9th St Cape Coral, FL | 4.0 | 2.0 | 1828 | $2,300 | $1.26 | 25d | 1 | 1.03mi |
| 411 NW 13th St Cape Coral, FL | 3.0 | 2.0 | 1408 | $2,035 | $1.45 | 5d | 1 | 1.06mi |
| 1926 NW 15th St Cape Coral, FL | 3.0 | 2.0 | 1461 | $2,100 | $1.44 | 12d | 1 | 1.06mi |
| 2022 NW 9th St Cape Coral, FL | 3.0 | 2.0 | 1303 | $1,611 | $1.24 | 15d | 1 | 1.06mi |
| 416 NW 17th Ave Cape Coral, FL | 3.0 | 2.0 | 1199 | $2,000 | $1.67 | 5d | 1 | 1.06mi |
| 419 NW 7th Ter Cape Coral, FL | 3.0 | 2.0 | 1161 | $4,500 | $3.88 | 5d | 1 | 1.10mi |
| 318 NW 8th Ter Cape Coral, FL | 3.0 | 2.0 | 1500 | $1,900 | $1.27 | 4d | 1 | 1.13mi |
| 1917 NW 12th Ave Cape Coral, FL | 3.0 | 2.0 | 1528 | $2,200 | $1.44 | 25d | 1 | 1.14mi |
| 1108 NW 21st Pl Cape Coral, FL | 3.0 | 2.0 | 1666 | $2,060 | $1.24 | 25d | 1 | 1.14mi |
| 1618 NW 5th Pl Cape Coral, FL | 4.0 | 3.0 | 1765 | $3,300 | $1.87 | 25d | 1 | 1.15mi |
| 305 NW 16th Pl Cape Coral, FL | 3.0 | 2.5 | 1446 | $2,095 | $1.45 | 5d | 1 | 1.15mi |
| 1809 NW 17th Ter Cape Coral, FL | 3.0 | 2.0 | 1750 | $1,980 | $1.13 | 25d | 1 | 1.16mi |
| 1243 NW 22nd Ave Cape Coral, FL | 3.0 | 2.0 | 1274 | $2,195 | $1.72 | 16d | 1 | 1.19mi |
Listing history 11 events
-
2026-04-28status Pending
-
2026-04-15$299,900 Active
-
2022-01-24soldstatus $39,900
-
2022-01-14soldstatus $39,900 Closed 549-char remark
Show marketing remark (549 chars)
Prime residential WATERFRONT building site -- cleared and ready for your Florida Dream home! Ideally located in a QUIET neighborhood of newer homes. Enjoy the tropical lifestyle on a freshwater canal where you can fish and launch your boat right from your own back yard! Quick access to all the amenities of the Pine Island Corridor -- shopping, restaurants, entertainment. Buy now while prices are still low. Build now or hold for future appreciation. Either way, YOU WIN! (Assessment area "North 6." Start date "Future--TBD. ")
-
2021-12-10status Pending 549-char remark
Show marketing remark (549 chars)
Prime residential WATERFRONT building site -- cleared and ready for your Florida Dream home! Ideally located in a QUIET neighborhood of newer homes. Enjoy the tropical lifestyle on a freshwater canal where you can fish and launch your boat right from your own back yard! Quick access to all the amenities of the Pine Island Corridor -- shopping, restaurants, entertainment. Buy now while prices are still low. Build now or hold for future appreciation. Either way, YOU WIN! (Assessment area "North 6." Start date "Future--TBD. ")
-
2021-10-20$39,900 Active 549-char remark
Show marketing remark (549 chars)
Prime residential WATERFRONT building site -- cleared and ready for your Florida Dream home! Ideally located in a QUIET neighborhood of newer homes. Enjoy the tropical lifestyle on a freshwater canal where you can fish and launch your boat right from your own back yard! Quick access to all the amenities of the Pine Island Corridor -- shopping, restaurants, entertainment. Buy now while prices are still low. Build now or hold for future appreciation. Either way, YOU WIN! (Assessment area "North 6." Start date "Future--TBD. ")
-
2005-05-12soldstatus $129,000
-
2005-05-09soldstatus $129,000 130-char remark
Show marketing remark (130 chars)
Lovely waterfront property with view of intersecting canal. Build yourself a beautiful home here and enjoy life happily everafter!
-
2005-04-11price $129,900 130-char remark
Show marketing remark (130 chars)
Lovely waterfront property with view of intersecting canal. Build yourself a beautiful home here and enjoy life happily everafter!
-
1991-10-25soldstatus $15,000
-
1991-08-07soldstatus $7,000
ⓘ Source: listings_history table (triggers on properties + properties_extension) + one-shot
backfill from property_details.listing_events for pre-trigger history.
Tax reassessment forecast FL · Resets to sale price
- Current annual tax
- $1,061 · $88/mo
- Projected year-2 tax
- $2,489 · $207/mo
- Expected delta
- +$1,428/yr (+$119/mo · 134.6%)
ⓘ Screening estimate from a state-policy table — verify with the county assessor before closing.
Climate risk First Street
- Flood 5/10 Major FEMA zone X (unshaded) · 24% chance over 30 yrs
- Wildfire 1/10 Low
- Heat 10/10 Extreme 7 d/yr ≥107°F today · 29 d/yr by 30 yrs out
- Wind 10/10 Extreme 99% chance of damaging wind over 30 yrs
- Air quality 2/10 Low 1 unhealthy d/yr today · 1 by 30 yrs out
Nearby sold comps map
Loading sold comps map…
Walkable amenities ~0.75 mi
Loading nearby amenities…
Taxation est. · year 1
- Rental income
- $25,541
- − Mortgage interest
- −$16,799
- − Property taxes
- −$1,061
- − Insurance
- −$1,500
- − Repairs & maintenance
- −$2,043
- − Management
- −$2,043
- − Depreciation
- −$8,724
- Taxable loss
- −$6,629
- Est. tax savings @ 24.0%
- +$1,591
- After-tax cash flow
- $336/yr
For passive investors: Depreciation is non-cash, so a rental often shows a tax loss while cash-flowing — sheltering income. Rental losses are passive: they offset passive income freely, and up to $25,000/yr can offset ordinary (W-2) income if you actively participate and your MAGI is under $100k (phasing out to $0 by $150k); unused losses carry forward. On sale, claimed depreciation is recaptured at up to 25%, and gains may owe capital-gains tax (a 1031 exchange can defer both). Figures are a year-1 estimate at your 24.0% rate — not tax advice; consult a CPA.
Schools (NCES district)
- District
- Lee
- NCES district ID
- 1201080
- Math proficiency
- 47% ▼ -11.00%
- Reading proficiency
- 50% ▼ -4.00%
- Median HH income
- $49,518
- Composite
- 41.49/100
- National rank
- #3458
- State rank
- #42 of 73 in FL
Livability — Cape Coral
- Score
- 77/100
- State rank
- #208
- US rank
- #3098
Category grades
Schools grade is shown separately in the Schools card above.
Census & demographics
- Census place
- Cape Coral, FL
- County
- Lee County · 788,662 people
- City population
- 217,388
- Metro
- Cape Coral-Fort Myers, FL
- Population (ZIP)
- 35,580
- Household income
- $90,577
- Rent vs Own
- Severe rent burden
- 286.0
Population outlook (Lee County) Hauer SSP2
- Today (2025)
- 871,946 people
- By 2030
- 955,468 · +9.6%
- By 2040
- 1,113,587 · +27.7%
- By 2050
- 1,256,891 · +44.1%
- By 2075
- 1,560,270 · +78.9%
- By 2100
- 1,726,848 · +98.0%
Race, ethnicity, and origin ACS 2023
- Neighborhood character
- Diverse neighborhood (Simpson 0.58)
- Race & ethnicity
- White 57% Hispanic / Latino 30% Two or more races 21% Black 7% Asian 2%
- Hispanic origin (detail)
- Mexican 2% Puerto Rican 6% Cuban 17% Dominican 1%
- Common ancestry
- Romanian 2% Hispanic 2% Lithuanian 2%
- Foreign-born
- 21% · Canada, Jamaica, China
- Languages at home
- 73% English-only · Spanish 24% French/Haitian/Cajun 1% Russian/Polish/Slavic 1%
Political lean MEDSL · Lee
- 2024 margin
- Strong R (+28.4) · D 35.5% · R 63.9%
- 2008→2024 swing
- -18.0pp toward R · 2008: -10.4pp · 2024: -28.4pp
- All cycles
- 2024: R+28.4 2020: R+19.2 2016: R+20.4 2012: R+16.6 2008: R+10.4
Not yet ingested
- Civics
- —
Market trends
- HPI YoY
- ▼ -55.34%
- Current HPI
- 337.0575
- Rent YoY
- ▼ -5.51%
- Metro
- Cape Coral-Fort Myers, FL
- State GDP YoY
- ▲ 3.28%
- F500 in state
- 36
Industry mix (Fortune 500 HQ in FL)
| Industry | F500 HQs | Revenue |
|---|---|---|
| Industrial Technology | 2 | $29B |
|
||
| Insurance | 2 | $17B |
|
||
| Retail | 1 | $60B |
|
||
| Technology Distribution | 1 | $58B |
|
||
| Homebuilding | 1 | $35B |
|
||
| Technology Manufacturing | 1 | $35B |
|
||
Price history
+4184.3% since first listed11 events — show timeline
- 2026-04-28 Pending — FORTMLS
- 2026-04-15 Listed $299,900 FORTMLS
- 2022-01-24 Sold (Public Records) $39,900 Public Records
- 2022-01-14 Sold (MLS) $39,900 FORTMLS
- 2021-12-10 Pending — FORTMLS
- 2021-10-20 Listed $39,900 FORTMLS
- 2005-05-12 Sold (Public Records) $129,000 Public Records
- 2005-05-09 Sold (MLS) $129,000 FORTMLS
- 2005-04-11 Price Changed $129,900 FORTMLS
- 1991-10-25 Sold (Public Records) $15,000 Public Records
- 1991-08-07 Sold (Public Records) $7,000 Public Records
Property tax history
+7.8%/yrLatest (2025): $1,061 · -0.1% YoY. Source: county tax records.
Cash-flow waterfall
monthlySold comps — $/sqft
last 12 mo · ≤1 miLoading sold comps…