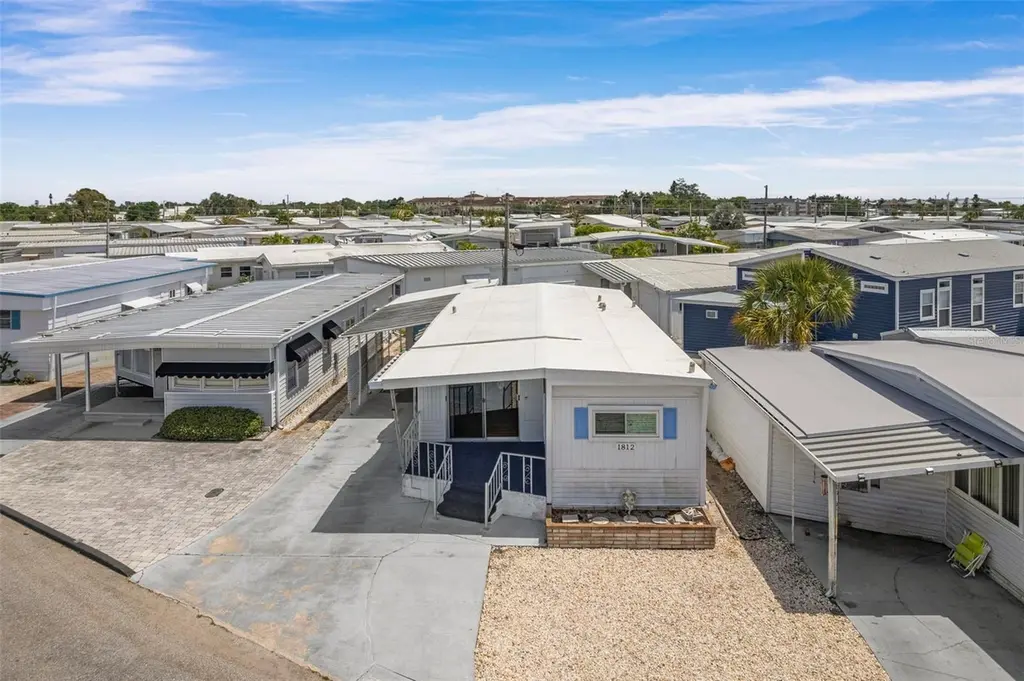
1812 Minnesota Ave · Bayshore Gardens, FL
Flood risk 5/10 · Moderate
- FEMA flood zone
- X (shaded)
- Chance of flooding over 30 yrs
- 0.23%
- Est. flood insurance / yr
- $507 – $1,088
Fire risk 1/10 · Minimal
- Est. fire insurance / yr
- $947 – $1,759
Heat risk 10/10 · Severe
- Hot days now (above 106°F)
- 6 days/yr
- Hot days in 30 yrs
- 25 days/yr
Wind risk 10/10 · Severe
- Chance of severe wind over 30 yrs
- 99.0%
Air-quality risk 2/10 · Minimal
- Unhealthy air days now
- 1 days/yr
- Unhealthy air days in 30 yrs
- 2 days/yr
Risk factors via First Street. Map © Google.
Why this score? — see what drove the B grade
The composite is a weighted blend of 9 inputs, each scored 0–100. Each bar is that input's sub-score; the figure is the points it added to the 100-point composite (weight × sub-score).
- Cash flow +25.6/30.0
- ARV discount +14.8/15.0
- 1% rule +9.8/10.0
- DSCR +8.5/10.0
- Schools +4.4/10.0
- Livability +4.1/5.0
- Condition / age +2.5/5.0
- Rent growth +1.1/5.0
- Appreciation +0.0/10.0
$99,000
🖨 Deal sheet 📄 Offer letter ✓ Due diligence
Listing remarks
Own your land in the highly sought-after waterfront community of Bradenton Trailer Estates—this double-wide mobile home offers easy, laid-back Florida living with a bright, open-concept layout connecting the kitchen, dining, and living spaces for a seamless, inviting flow. A private detached shed with water and electric adds valuable flexibility—ideal for a dedicated laundry space, workshop, or extra storage, thoughtfully set apart from the main living areas. Offered fully furnished for a seamless move-in, this property is perfectly suited for both seasonal enjoyment and year-round Florida living. Situated within Trailer Estates, a deed-restricted community, homeowners enjoy tru
Key facts
- Fitness center
- Private beach access
- Shuffleboard
Tags
Property features AI
Finance
- Other: Turnkey (furnished); Located in a senior community; Pets allowed
- Financial info: Total monthly fees listed as $120.42; Total annual fees listed as $1,445
- HOA & community: Association: TJ Miller; Association amenities include clubhouse, fitness center, pool, park, recreation facilities, laundry, storage, lobby key required, maintenance, cable TV
Exterior
- Parking: Carport with 1 space
- Utilities: Public water; Public sewer; Electricity connected; Cable available; High-speed internet available; Water connected
- Home design: Residential mobile home (double wide); One story; Faces north
- Construction: Frame construction; Membrane roof
- Exterior features: Covered front porch; Shade shutters; Sliding doors; Shed(s)
Interior
- Kitchen: Range; Microwave; Dishwasher; Refrigerator
- Bedrooms: 2 bedrooms
- Flooring: Vinyl
- Bathrooms: 1 full bath; 1 half bath
- Heating & cooling: Central air; Other heating
- Interior features: Open floorplan; Living room/dining room combo
- Laundry & utility: Washer; Dryer; Laundry located outside
Neighborhood map
What this means for you Summary
Snapshot
- This is a 2-bed/1.0-bath manufactured listed at $99k.
Deal economics
- At list price, monthly cash flow is $234 ($3k/yr) — positive.
- The deal already cash-flows at list — no discount required.
- Meets the 1% rule at list price ($1k rent vs $99k).
- Cap rate 9.1% vs local median 4.7% in Bayshore Gardens — top-decile yield for the area; either an underpriced asset or a hidden risk that comps aren't pricing in. Stress-test before assuming the spread holds.
Location & tenants
- Location reads 82/100 on livability (#72 in FL, #1,180 nationally) — a professional / high-income tenant draw. Strengths: cost of living A+, housing A+, health & safety A+; Watch: crime C-, commute C-, schools F.
- Manatee (suburban): math 54% / reading 50% proficiency, ranked #26 of 73 in FL (top 36%) — acceptable for families but not a draw, mixed tenant base, ~2y average lease.
- Market conditions: Rents falling (-5.5%/yr); 361 active listings in the ZIP; 35 comparable units currently listed for rent nearby; rentals at typical pace (median 16d on market — plan ~3-4 weeks tenant-placement turnaround); 7,472 units permitted in Manatee County in 2024 (1,782 in 5+ unit buildings).
- This rent runs 39% of the median local income ($45k/yr) — at the standard rent-burdened threshold; future hikes will face affordability resistance.
Forward outlook
- Local home prices are declining (-3.0%/yr); year-one equity from $684 of loan paydown is wiped out by about $3k of value loss. Plan a longer hold.
- Manatee County population projected at +43% by 2050 — long-run rental-demand tailwind backs the buy-and-hold thesis.
Negotiation context
- Only 11 days on market — expect competitive offers; lowballing is unlikely to land.
- Current owner paid $45k; list at $99k implies a 120% gain — meaningful room to come down on a strong offer.
Risks & watch-outs
- Watch-outs: property tax is 2.9% of price.
- Climate carrying-cost: moderate flood risk; severe wind risk, 99% chance of damaging wind over 30y; extreme-heat days projected 6→25/yr by 2055 (HVAC capex compounding) — expect insurance premiums to compound above CPI over the hold.
Questions for the listing agent
- Built in 1965 — when were the roof, HVAC, electrical panel, plumbing, and water heater last replaced?
- Property tax is high relative to price — has the assessment been appealed recently, and will the sale trigger a re-assessment?
- What does the HOA fee cover, when was the last increase, and are there any pending special assessments or reserve-fund shortfalls?
- Is there a deadline driving the sale (1031 exchange, divorce, estate, relocation)? That informs how much negotiation room exists.
- Schools are F-rated, which usually means shorter tenancies and higher turnover. Who's the typical renter profile here, and what's been the actual vacancy rate?
- What's the average days-on-market for RENTAL listings here right now (not sales)? A rising rental-DOM trend means longer vacancies and softer asking-rent achievability than the comps imply.
- What's the recent tenant-quality profile in this submarket — average credit score on applications, eviction rate, late-payment / NSF rate, and stable-employment percentage? A property-management company in the area should have these aggregated.
- How much new for-sale + rental construction is in the pipeline within 1–3 miles? Heavy new supply typically softens prices + rents 12–24 months out; constrained supply supports both.
Investment metrics
- 1% rule
- 1.48% ✓
- Cap rate
- 9.13%
- Cash-on-cash
- 10.15%
- DSCR
- 1.45
- GRM
- 5.6
CMA / ARV
- ARV (on-the-fly)
- $118,080
- Comps found
- 12
Show comp detail 12 sales within ~0.75 mi
| Address | Dist | Beds/Ba | Sqft | Sold | Price | $/sf | Match |
|---|---|---|---|---|---|---|---|
| 1812 Minnesota Ave | 0.00mi | 2/1.5 | 820 (0%) | 1mo | $105,000 | $128 | 97 |
| 1912 Florida Blvd | 0.12mi | 2/1.5 | 800 (-2%) | 2mo | $115,000 | $144 | 87 |
| 1811 Pennsylvania Ave | 0.13mi | 2/1.5 | 840 (+2%) | 2mo | $160,000 | $190 | 86 |
| 1809 Illinois Ave | 0.01mi | 2/1.0 | 768 (-6%) | 4mo | $110,000 | $143 | 85 |
| 1612 Illinois Ave | 0.12mi | 2/1.5 | 780 (-5%) | 2mo | $138,000 | $177 | 82 |
| 1716 Indiana Ave | 0.05mi | 2/2.0 | 880 (+7%) | 2mo | $135,000 | $153 | 80 |
| 1812 Pennsylvania Ave | 0.15mi | 2/2.0 | 861 (+5%) | 4mo | $100,000 | $116 | 77 |
| 6609 Dakota St | 0.19mi | 2/1.0 | 750 (-8%) | 0mo | $150,000 | $200 | 77 |
| 1805 Pennsylvania Ave | 0.13mi | 2/1.5 | 741 (-10%) | 2mo | $86,000 | $116 | 74 |
| 6622 Nebraska St | 0.25mi | 2/2.0 | 878 (+7%) | 0mo | $117,500 | $134 | 72 |
| 6506 Nebraska St | 0.36mi | 2/2.0 | 870 (+6%) | 3mo | $178,000 | $205 | 66 |
| 6625 Massachusetts St | 0.20mi | 2/2.0 | 700 (-15%) | 1mo | $100,000 | $143 | 61 |
Match score weights: distance 35% · size 25% · config 20% · recency 20%. Top-matched comps best support the ARV.
Projected returns pro-forma
-3.0% appreciation · 0.0% rent growth · sell at horizon
- IRR
- -5.3%
- Equity multiple
- 0.81×
- Total profit
- $-5,229
- Equity at exit
- $14,761
- IRR
- -0.8%
- Equity multiple
- 0.96×
- Total profit
- $-1,206
- Equity at exit
- $8,560
Cash invested: $27,720 (down + closing). Projections, not guarantees.
Landlord ↔ Tenant lean methodology
- Overall (STATE)
- 87 Strongly Landlord-Friendly
- State Florida
- 87 Strongly Landlord-Friendly · R+3
- County
- — inherits STATE
- City
- — inherits STATE
ZIP-level market 34207
- Rents YoY
- -5.5%
- Active inventory
- 361
- Price-to-rent
- 5.6×
Monthly cashflow live
- Estimated rent
- $1,462 high interval (Pro) →
- Mortgage (P&I)
- −$519
- Tax from tax record
- −$240 /mo · $2,882/yr
- Insurance
- −$41
- HOA
- −$120
- Vacancy / Maint / Mgmt
- −$307
- Net cashflow
- $234
Break-even live
UW: 25.0% down · 7.5% · 30yr · 1.5% tax · 5.0% vac · 8.0% maint · 8.0% mgmt
Financing live
Cash to close
- Down payment
- $24,750
- Closing costs
- $2,970
- Reserves months
- —
- Total cash needed
- —
Loan-product check · same deal, 3 products live
Conventional
25% down · 7.5% · 30yr
- Down + closing
- —
- Monthly P&I
- —
- Monthly cashflow
- —
- DSCR
- —
- Eligible?
- —
Personal DTI + credit; lowest rate.
DSCR
20% down · 8.5% · 30yr
- Down + closing
- —
- Monthly P&I
- —
- Monthly cashflow
- —
- DSCR
- —
- Eligible?
- —
No personal income docs; deal must DSCR.
Hard money
10% down · 12.0% · 12mo
- Down + closing
- —
- Monthly P&I
- —
- Monthly cashflow
- —
- DSCR
- —
- Eligible?
- —
Short-term bridge; refi at stabilization.
Rent comps 35 comps
| Address | Beds | Baths | Sqft | Rent | $/sqft | DOM | Units | Dist |
|---|---|---|---|---|---|---|---|---|
| 2305 69th Ave W Bradenton, FL | 2.0 | 2.0 | 1038 | $1,775 | $1.71 | 23d | 1 | 0.36mi |
| 1122 68th Avenue Dr W Unit 5 Bradenton, FL | 2.0 | 1.0 | 840 | $1,450 | $1.73 | 3d | 1 | 0.39mi |
| 1009 W 63rd AVE Bradenton, FL | 2.0 | 2.0 | 815 | $1,495 | $1.83 | 16d | 1 | 0.75mi |
| 605 64th Ave W Bradenton, FL | 2.0 | 1.0 | 784 | $1,250 | $1.59 | 11d | 1 | 0.85mi |
| 6434 5th St W Unit 6434 Bradenton, FL | 2.0 | 1.0 | 754 | $2,800 | $3.71 | 19d | 1 | 0.85mi |
| 5996 Hibiscus Dr #6 Bradenton, FL | 2.0 | 1.0 | 865 | $1,550 | $1.79 | 16d | 1 | 0.89mi |
| 7310 Manatee St Sarasota, FL | 2.0 | 1.5 | 1100 | $2,150 | $1.95 | 23d | 1 | 0.91mi |
| 6043 Coral Way Bradenton, FL | 2.0 | 1.0 | 865 | $1,700 | $1.97 | 16d | 1 | 0.92mi |
| 3304 McDill Rd Bradenton, FL | 2.0 | 1.0 | 1044 | $1,695 | $1.62 | 11d | 1 | 0.95mi |
| 1839 Sunny Dr Unit E36 Bradenton, FL | 1.0 | 1.0 | 576 | $1,350 | $2.34 | 23d | 1 | 0.99mi |
| 1825 Flamingo Blvd Unit O26 Bradenton, FL | 1.0 | 1.0 | 576 | $1,000 | $1.74 | 23d | 1 | 0.99mi |
| 1566 Pleasant Rd Unit J24 Bradenton, FL | 2.0 | 1.0 | 733 | $1,150 | $1.57 | 23d | 1 | 1.00mi |
| 5896 Palm Ln Unit C27 Bradenton, FL | 2.0 | 2.0 | 966 | $1,400 | $1.45 | 23d | 1 | 1.03mi |
| 5955 Palm Ln Unit A33 Bradenton, FL | 2.0 | 1.0 | 744 | $1,150 | $1.55 | 14d | 1 | 1.03mi |
| 5888 17th St W Unit C23 Bradenton, FL | 1.0 | 1.0 | 576 | $1,100 | $1.91 | 23d | 1 | 1.04mi |
| 5858 Welcome Rd Unit J23 Bradenton, FL | 2.0 | 1.0 | 744 | $1,150 | $1.55 | 3d | 1 | 1.05mi |
| 5906 Garden Ln Unit A22 Bradenton, FL | 2.0 | 2.0 | 840 | $1,200 | $1.43 | 3d | 1 | 1.05mi |
| 2028 Canal Dr Unit M26 Bradenton, FL | 1.0 | 1.0 | 576 | $1,050 | $1.82 | 10d | 1 | 1.06mi |
| 1874 Sunny Dr Unit F32 Bradenton, FL | 2.0 | 1.0 | 744 | $950 | $1.28 | 23d | 1 | 1.06mi |
| 1859 Restful Dr Unit L26 Bradenton, FL | 1.0 | 1.0 | 576 | $1,150 | $2.00 | 23d | 1 | 1.07mi |
| 1807 Restful Dr Unit N4 Bradenton, FL | 2.0 | 1.0 | 733 | $1,150 | $1.57 | 3d | 1 | 1.07mi |
| 1875 Sunny Dr Unit G32 Bradenton, FL | 1.0 | 1.0 | 576 | $1,100 | $1.91 | 23d | 1 | 1.07mi |
| 5908 17th St W Unit C36 Bradenton, FL | 1.0 | 1.0 | 576 | $950 | $1.65 | 16d | 1 | 1.07mi |
| 2547 60th Ave W Unit L-36 Bradenton, FL | 1.0 | 1.0 | 576 | $1,100 | $1.91 | 16d | 1 | 1.08mi |
| 2423 60th Ave W Unit K29 Bradenton, FL | 2.0 | 2.0 | 1026 | $1,495 | $1.46 | 23d | 1 | 1.08mi |
| 2713 60th Avenue Dr W Bradenton, FL | 2.0 | 2.0 | 1076 | $2,000 | $1.86 | 23d | 1 | 1.10mi |
| 512 60th Avenue Ter W Unit 512 Bradenton, FL | 3.0 | 1.5 | 972 | $1,900 | $1.95 | 10d | 1 | 1.15mi |
| 5820 21st St W Bradenton, FL | 3.0 | 2.0 | 1116 | $1,995 | $1.79 | 3d | 1 | 1.16mi |
| 3 Date Ave Bradenton, FL | 2.0 | 2.0 | 1000 | $1,495 | $1.50 | 23d | 1 | 1.22mi |
| 6033 34th St W Bradenton, FL | 2.0 | 2.0 | 942 | $1,550 | $1.64 | 3d | 3 | 1.27mi |
| 6033 34th St W Bradenton, FL | 2.0 | 2.0 | 996 | $1,500 | $1.51 | 23d | 2 | 1.27mi |
| 6033 34th St W Bradenton, FL | 2.0 | 2.0 | 942 | $1,625 | $1.73 | 2d | 2 | 1.27mi |
| 6050 34th St W Bradenton, FL | 1.0–2.0 | 1.0 | 734 | $1,610 | $2.19 | 1d | 19 | 1.40mi |
| 1007 57th Ave W Bradenton, FL | 2.0 | 1.5 | 967 | $1,495 | $1.55 | 10d | 1 | 1.43mi |
| 5513 18th St W Bradenton, FL | 2.0 | 1.0 | 1000 | $1,499 | $1.50 | 23d | 1 | 1.48mi |
HOA detail
- Monthly dues
- $120 · $1,440/yr
- Likely covers
- waterelectric
Listing history 3 events
-
2026-05-06status Pending
-
2026-04-25$99,000 Active
-
1989-12-29soldstatus $45,000
ⓘ Source: listings_history table (triggers on properties + properties_extension) + one-shot
backfill from property_details.listing_events for pre-trigger history.
Tax reassessment forecast FL · Resets to sale price
- Current annual tax
- $2,882 · $240/mo
- Projected year-2 tax
- $2,882 · $240/mo
- Expected delta
- $0/yr ($0/mo · 0.0%)
ⓘ Screening estimate from a state-policy table — verify with the county assessor before closing.
Climate risk First Street
- Flood 5/10 Major FEMA zone X (shaded) · 23% chance over 30 yrs
- Wildfire 1/10 Low
- Heat 10/10 Extreme 6 d/yr ≥106°F today · 25 d/yr by 30 yrs out
- Wind 10/10 Extreme 99% chance of damaging wind over 30 yrs
- Air quality 2/10 Low 1 unhealthy d/yr today · 2 by 30 yrs out
Nearby sold comps map
Loading sold comps map…
Walkable amenities ~0.75 mi
Loading nearby amenities…
Taxation est. · year 1
- Rental income
- $17,544
- − Mortgage interest
- −$5,546
- − Property taxes
- −$2,882
- − Insurance
- −$495
- − Repairs & maintenance
- −$1,404
- − Management
- −$1,404
- − HOA
- −$1,440
- − Depreciation
- −$2,880
- Taxable income
- $1,495
- Est. tax owed @ 24.0%
- −$359
- After-tax cash flow
- $2,454/yr
For passive investors: Depreciation is non-cash, so a rental often shows a tax loss while cash-flowing — sheltering income. Rental losses are passive: they offset passive income freely, and up to $25,000/yr can offset ordinary (W-2) income if you actively participate and your MAGI is under $100k (phasing out to $0 by $150k); unused losses carry forward. On sale, claimed depreciation is recaptured at up to 25%, and gains may owe capital-gains tax (a 1031 exchange can defer both). Figures are a year-1 estimate at your 24.0% rate — not tax advice; consult a CPA.
Schools (NCES district)
- District
- Manatee
- NCES district ID
- 1201230
- Math proficiency
- 54% ▼ -6.00%
- Reading proficiency
- 50% ▼ -2.00%
- Median HH income
- $49,607
- Composite
- 44.43/100
- National rank
- #2806
- State rank
- #26 of 73 in FL
Livability — Bayshore Gardens
- Score
- 82/100
- State rank
- #72
- US rank
- #1180
Category grades
Schools grade is shown separately in the Schools card above.
Census & demographics
- County
- Manatee County · 416,364 people
- City population
- 33,840
- Metro
- North Port-Sarasota-Bradenton, FL
- Population (ZIP)
- 34,081
- Household income
- $45,010
- Rent vs Own
- Severe rent burden
- 1474.0
Population outlook (Manatee County) Hauer SSP2
- Today (2025)
- 447,342 people
- By 2030
- 488,911 · +9.3%
- By 2040
- 567,934 · +27.0%
- By 2050
- 637,995 · +42.6%
- By 2075
- 781,970 · +74.8%
- By 2100
- 848,272 · +89.6%
Race, ethnicity, and origin ACS 2023
- Neighborhood character
- Diverse neighborhood (Simpson 0.57)
- Race & ethnicity
- White 58% Hispanic / Latino 29% Two or more races 13% Black 7%
- Hispanic origin (detail)
- Mexican 12% Puerto Rican 4% Cuban 3% Dominican 1%
- Common ancestry
- Lithuanian 3% Romanian 2% Slovak 2%
- Foreign-born
- 16% · Canada, Jamaica
- Languages at home
- 74% English-only · Spanish 22% Other Indo-European 1% French/Haitian/Cajun 1%
Political lean MEDSL · Manatee
- 2024 margin
- Strong R (+23.5) · D 37.9% · R 61.4%
- 2008→2024 swing
- -16.5pp toward R · 2008: -7.0pp · 2024: -23.5pp
- All cycles
- 2024: R+23.5 2020: R+16.1 2016: R+17.1 2012: R+12.5 2008: R+7.0
Not yet ingested
- Civics
- —
Market trends
- HPI YoY
- ▼ -305.32%
- Current HPI
- 369.9899
- Rent YoY
- ▼ -5.50%
- Metro
- North Port-Sarasota-Bradenton, FL
- State GDP YoY
- ▲ 3.28%
- F500 in state
- 36
Industry mix (Fortune 500 HQ in FL)
| Industry | F500 HQs | Revenue |
|---|---|---|
| Industrial Technology | 2 | $29B |
|
||
| Insurance | 2 | $17B |
|
||
| Retail | 1 | $60B |
|
||
| Technology Distribution | 1 | $58B |
|
||
| Homebuilding | 1 | $35B |
|
||
| Technology Manufacturing | 1 | $35B |
|
||
Price history
+120.0% since first listed3 events — show timeline
- 2026-05-06 Pending — Stellar MLS as Distributed by MLS Grid
- 2026-04-25 Listed $99,000 Stellar MLS as Distributed by MLS Grid
- 1989-12-29 Sold (Public Records) $45,000 Public Records
Property tax history
+6.7%/yrLatest (2024): $2,882 · +6.0% YoY. Source: county tax records.
Cash-flow waterfall
monthlySold comps — $/sqft
last 12 mo · ≤1 miLoading sold comps…