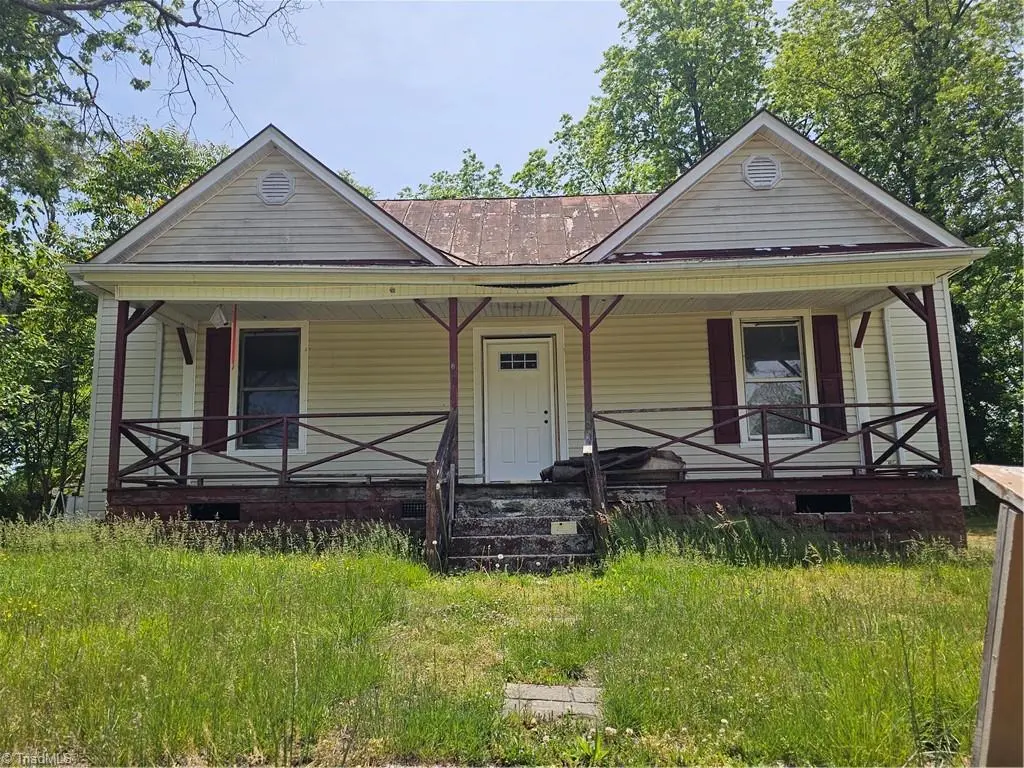
207 Field St · Reidsville, NC
Flood risk 1/10 · Minimal
- FEMA flood zone
- X (unshaded)
- Chance of flooding over 30 yrs
- 0.0%
- Est. flood insurance / yr
- $507 – $1,088
Fire risk 3/10 · Minor
- Est. fire insurance / yr
- $906 – $1,684
Heat risk 6/10 · Moderate
- Hot days now (above 103°F)
- 7 days/yr
- Hot days in 30 yrs
- 18 days/yr
Wind risk 4/10 · Minor
- Chance of severe wind over 30 yrs
- 10.0%
Air-quality risk 3/10 · Minor
- Unhealthy air days now
- 2 days/yr
- Unhealthy air days in 30 yrs
- 3 days/yr
Risk factors via First Street. Map © Google.
Why this score? — see what drove the B- grade
The composite is a weighted blend of 9 inputs, each scored 0–100. Each bar is that input's sub-score; the figure is the points it added to the 100-point composite (weight × sub-score).
- Cash flow +30.0/30.0
- 1% rule +10.0/10.0
- DSCR +10.0/10.0
- ARV discount +7.5/15.0
- Schools +3.3/10.0
- Livability +3.0/5.0
- Rent growth +2.5/5.0
- Condition / age +2.5/5.0
- Appreciation +0.0/10.0
$39,900
🖨 Deal sheet (PDF) 📄 Offer letter ✓ Due diligence
Listing remarks MLS
Great investment potential, some upgrading complete, minor work could make a great rental. Sold as-is.
Key facts
- 8,712 sq ft lot
- Built 1930
- Listed 26 days
Property features AI
Finance
- HOA & community: No association
Exterior
- Parking: Driveway (gravel)
- Utilities: Public water; Public sewer; Electric water heater
- Home design: Residential stick/site-built house; One story; Built in 1930; Existing structure
- Construction: Vinyl siding; Crawl space foundation
- Exterior features: City lot; No fencing; Public-maintained road access
Interior
- Kitchen: Electric water heater
- Bedrooms: Living area present on the main level
- Bathrooms: 1 full bathroom
- Heating & cooling: Heat pump and electric heating; Central air conditioning
- Interior features: Primary bedroom located on the main level
Neighborhood map
What this means for you Summary
Snapshot
- This is a 3-bed/1.0-bath single-family listed at $40k.
Deal economics
- At list price, monthly cash flow is $428 ($5k/yr) — positive.
- The deal already cash-flows at list — no discount required.
- Meets the 1% rule at list price ($902 rent vs $40k).
- Recommended offer: $39k (1.5% below list) — sets the bar for market timing.
- Cap rate 19.2% vs local median 3.7% in Reidsville — top-decile yield for the area; either an underpriced asset or a hidden risk that comps aren't pricing in. Stress-test before assuming the spread holds.
Location & tenants
- Location reads 59/100 on livability (#553 in NC) — a working-class tenant base; expect higher turnover. Strengths: cost of living A+, housing A; Watch: crime F, amenities F, commute F.
- Rockingham County Schools (rural): math 38% / reading 40% proficiency, ranked #120 of 178 in NC (top 67%) — families likely to look elsewhere, expect single-tenant / working-renter base with shorter leases.
- Zoned schools: Reidsville Middle (math 27% / reading 33%, grade F, #335 of 475 statewide, top 72%, 614 students, 100% FRL); Reidsville High (math 42% / reading 32%, grade F, #414 of 535 statewide, top 79%, 753 students, 100% FRL) — zoned schools average 100% FRL vs 52% district-wide (48 pts higher); higher-poverty schools than district average — tighter screening recommended.
- Market conditions: 258 active listings in the ZIP; 5 comparable units currently listed for rent nearby; rentals at typical pace (median 25d on market — plan ~3-4 weeks tenant-placement turnaround); 344 units permitted in Rockingham County in 2024 (0 in 5+ unit buildings).
Forward outlook
- Local home prices are declining (-3.0%/yr); year-one equity from $276 of loan paydown is wiped out by about $1k of value loss. Plan a longer hold.
- Rockingham County population projected at -22% by 2050 — secular population decline; favor cash flow + early exit over multi-decade hold.
- At projected returns (-3.0% appreciation + 3.0% rent growth), your $11k cash investment doubles in ~3 years — after that, you're playing with house money.
Negotiation context
- It's been on market 26 days — a 2% lower offer ($39k) is reasonable based on typical stale-listing flexibility.
- 2 sale attempts since 14y ago; this cycle's ask has dropped $10k (20%) from the opening price — seller is motivated, your offer sets the floor, not the list.
- Current owner paid $12k; list at $40k implies a 233% gain — meaningful room to come down on a strong offer.
Risks & watch-outs
- Watch-outs: built in 1930 — expect roof / HVAC / electrical / plumbing capex.
- Climate carrying-cost: extreme-heat days projected 7→18/yr by 2055 (HVAC capex compounding) — expect insurance premiums to compound above CPI over the hold.
Questions for the listing agent
- Built in 1930 — when were the roof, HVAC, electrical panel, plumbing, and water heater last replaced?
- Is there a deadline driving the sale (1031 exchange, divorce, estate, relocation)? That informs how much negotiation room exists.
- Schools are D-rated, which usually means shorter tenancies and higher turnover. Who's the typical renter profile here, and what's been the actual vacancy rate?
- Crime grade is F in this area — have there been break-ins, vandalism, or insurance claims at this property in the last 3 years? What carrier currently insures it and at what premium?
- What's the average days-on-market for RENTAL listings here right now (not sales)? A rising rental-DOM trend means longer vacancies and softer asking-rent achievability than the comps imply.
- What's the recent tenant-quality profile in this submarket — average credit score on applications, eviction rate, late-payment / NSF rate, and stable-employment percentage? A property-management company in the area should have these aggregated.
- How much new for-sale + rental construction is in the pipeline within 1–3 miles? Heavy new supply typically softens prices + rents 12–24 months out; constrained supply supports both.
Investment metrics
- 1% rule
- 2.26% ✓
- Cap rate
- 19.15%
- Cash-on-cash
- 45.93%
- DSCR
- 3.04
- GRM
- 3.7
CMA / ARV
- ARV (on-the-fly)
- $194,680
- Comps found
- 12
Show comp detail 12 sales within ~0.75 mi
| Address | Dist | Beds/Ba | Sqft | Sold | Price | $/sf | Match |
|---|---|---|---|---|---|---|---|
| 226 Carter St | 0.25mi | 3/1.0 | 1,240 (0%) | 9mo | $40,000 | $32 | 81 |
| 105 Roanoke St | 0.22mi | 3/2.0 | 1,208 (-3%) | 9mo | $219,900 | $182 | 74 |
| 331 Washington Ave | 0.48mi | 3/1.0 | 1,262 (+2%) | 2mo | $105,000 | $83 | 73 |
| 508 Washington Ave | 0.36mi | 3/2.0 | 1,232 (-1%) | 8mo | $207,347 | $168 | 72 |
| 1009 N Scales St | 0.13mi | 3/2.0 | 1,106 (-11%) | 0mo | $195,000 | $176 | 72 |
| 1007 Wentworth St | 0.51mi | 3/2.0 | 1,269 (+2%) | 10mo | $246,120 | $194 | 60 |
| 805 Wilson St | 0.47mi | 3/1.0 | 1,359 (+10%) | 3mo | $120,000 | $88 | 60 |
| 620 NW Market St | 0.22mi | 2/1.0 (-1) | 1,107 (-11%) | 9mo | $58,000 | $52 | 59 |
| 710 Wentworth St | 0.33mi | 2/1.0 (-1) | 1,354 (+9%) | 11mo | $155,000 | $114 | 56 |
| 106 Arlington St | 0.60mi | 3/2.5 | 1,290 (+4%) | 6mo | $189,000 | $147 | 54 |
| 820 Moore St | 0.61mi | 3/1.0 | 1,084 (-13%) | 0mo | $170,000 | $157 | 50 |
| 1103 Wentworth St | 0.52mi | 3/2.0 | 1,420 (+14%) | 3mo | $225,000 | $158 | 45 |
Match score weights: distance 35% · size 25% · config 20% · recency 20%. Top-matched comps best support the ARV.
Projected returns pro-forma
-3.0% appreciation · 3.0% rent growth · sell at horizon
- IRR
- 43.1%
- Equity multiple
- 2.86×
- Total profit
- $20,788
- Equity at exit
- $5,949
- IRR
- 49.2%
- Equity multiple
- 5.77×
- Total profit
- $53,249
- Equity at exit
- $3,450
Cash invested: $11,172 (down + closing). Projections, not guarantees.
Landlord ↔ Tenant lean methodology
- Overall (STATE)
- 85 Strongly Landlord-Friendly
- State North Carolina
- 85 Strongly Landlord-Friendly · R+3
- County
- — inherits STATE
- City
- — inherits STATE
ZIP-level market 27320
- Home prices YoY
- -30.8%
- Active inventory
- 258
- Price-to-rent
- 3.7×
Monthly cashflow live
- Estimated rent
- $902 high interval (Pro) →
- Mortgage (P&I)
- −$209
- Tax from tax record
- −$59 /mo · $713/yr
- Insurance
- −$17
- HOA
- −$0
- Vacancy / Maint / Mgmt
- −$190
- Net cashflow
- $428
Break-even live
Sensitivity live
| Price | -10% $450 | -5% $439 | +0% $428 | +5% $416 | +10% $405 |
|---|---|---|---|---|---|
| Rent | -10% $356 | -5% $392 | +0% $428 | +5% $463 | +10% $499 |
| Rate | -1.0pp $448 | -0.5pp $438 | base $428 | +0.5pp $417 | +1.0pp $407 |
UW: 25.0% down · 7.5% · 30yr · 1.5% tax · 5.0% vac · 8.0% maint · 8.0% mgmt
Financing live
Cash to close
- Down payment
- $9,975
- Closing costs
- $1,197
- Reserves months
- —
- Total cash needed
- —
Loan-product check · same deal, 3 products live
Conventional
25% down · 7.5% · 30yr
- Down + closing
- —
- Monthly P&I
- —
- Monthly cashflow
- —
- DSCR
- —
- Eligible?
- —
Personal DTI + credit; lowest rate.
DSCR
20% down · 8.5% · 30yr
- Down + closing
- —
- Monthly P&I
- —
- Monthly cashflow
- —
- DSCR
- —
- Eligible?
- —
No personal income docs; deal must DSCR.
Hard money
10% down · 12.0% · 12mo
- Down + closing
- —
- Monthly P&I
- —
- Monthly cashflow
- —
- DSCR
- —
- Eligible?
- —
Short-term bridge; refi at stabilization.
Rent comps 5 comps
| Address | Beds | Baths | Sqft | Rent | $/sqft | DOM | Units | Dist |
|---|---|---|---|---|---|---|---|---|
| 202 Mulberry St Reidsville, NC | 2.0 | 1.0 | 899 | $1,025 | $1.14 | 25d | 1 | 0.17mi |
| 528 N Scales St Unit C Reidsville, NC | 2.0 | 1.0 | 1080 | $825 | $0.76 | 25d | 1 | 0.17mi |
| 110 Arlington St Reidsville, NC | 2.0 | 1.0 | 1000 | $850 | $0.85 | 25d | 1 | 0.61mi |
| 411 W Ransom St Apt 1 Reidsville, NC | 2.0 | 1.0 | 900 | $825 | $0.92 | 25d | 1 | 1.46mi |
| 411 W Ransom St Reidsville, NC | 2.0 | 1.0 | 900 | $825 | $0.92 | 20d | 1 | 1.46mi |
Listing history 9 events
-
2026-06-02status $39,900 Pending 26 DOM
-
2026-06-01statusdays on market $39,900 Due Diligence Period 26 DOM
-
2026-05-31days on market $39,900 Active 25 DOM
-
2026-05-31days on market $39,900 Active 24 DOM
-
2026-05-13price $44,900
-
2026-05-06$49,900 Active
-
2012-03-06soldstatus $12,000 102-char remark
Show marketing remark (102 chars)
Great investment potential, some upgrading complete, minor work could make a great rental. Sold as-is.
-
2012-02-01$15,900 102-char remark
Show marketing remark (102 chars)
Great investment potential, some upgrading complete, minor work could make a great rental. Sold as-is.
-
1999-08-24soldstatus $47,500
ⓘ Source: listings_history table (triggers on properties + properties_extension) + one-shot
backfill from property_details.listing_events for pre-trigger history.
Tax reassessment forecast NC · Resets to sale price
- Current annual tax
- $713 · $59/mo
- Projected year-2 tax
- $713 · $59/mo
- Expected delta
- $0/yr ($0/mo · 0.0%)
ⓘ Screening estimate from a state-policy table — verify with the county assessor before closing.
Climate risk First Street
- Flood 1/10 Low FEMA zone X (unshaded) · 0% chance over 30 yrs
- Wildfire 3/10 Moderate
- Heat 6/10 Major 7 d/yr ≥103°F today · 18 d/yr by 30 yrs out
- Wind 4/10 Moderate 10% chance of damaging wind over 30 yrs
- Air quality 3/10 Moderate 2 unhealthy d/yr today · 3 by 30 yrs out
Nearby sold comps map
Loading sold comps map…
Walkable amenities ~0.75 mi
Loading nearby amenities…
Taxation est. · year 1
- Rental income
- $10,829
- − Mortgage interest
- −$2,235
- − Property taxes
- −$713
- − Insurance
- −$200
- − Repairs & maintenance
- −$866
- − Management
- −$866
- − Depreciation
- −$1,161
- Taxable income
- $4,788
- Est. tax owed @ 24.0%
- −$1,149
- After-tax cash flow
- $3,982/yr
For passive investors: Depreciation is non-cash, so a rental often shows a tax loss while cash-flowing — sheltering income. Rental losses are passive: they offset passive income freely, and up to $25,000/yr can offset ordinary (W-2) income if you actively participate and your MAGI is under $100k (phasing out to $0 by $150k); unused losses carry forward. On sale, claimed depreciation is recaptured at up to 25%, and gains may owe capital-gains tax (a 1031 exchange can defer both). Figures are a year-1 estimate at your 24.0% rate — not tax advice; consult a CPA.
Schools (NCES district)
- District
- Rockingham County Schools
- NCES district ID
- 3703990
- Math proficiency
- 38% ▼ -2.00%
- Reading proficiency
- 40% ▲ 1.00%
- Median HH income
- $38,914
- Composite
- 32.6/100
- National rank
- #5673
- State rank
- #120 of 178 in NC
Livability — Reidsville
- Score
- 59/100
- State rank
- #553
- US rank
- #20359
Category grades
Schools grade is shown separately in the Schools card above.
Census & demographics
- Census place
- Reidsville, NC
- City population
- 38,610
- Population (ZIP)
- 38,610
Population outlook (Rockingham County) Hauer SSP2
- Today (2025)
- 87,103 people
- By 2030
- 83,763 · -3.8%
- By 2040
- 76,082 · -12.7%
- By 2050
- 68,106 · -21.8%
- By 2075
- 52,531 · -39.7%
- By 2100
- 39,871 · -54.2%
Race, ethnicity, and origin ACS 2023
- Neighborhood character
- Majority White (64%)
- Race & ethnicity
- White 64% Black 23% Two or more races 8% Hispanic / Latino 7%
- Hispanic origin (detail)
- Mexican 4%
- Common ancestry
- Slovak 2% Serbian 2% Italian 2%
- Foreign-born
- 3% · Canada
- Languages at home
- 94% English-only · Spanish 5%
Political lean MEDSL · Rockingham
- 2024 margin
- Solid R (+35.9) · D 31.7% · R 67.6%
- 2008→2024 swing
- -19.9pp toward R · 2008: -16.0pp · 2024: -35.9pp
- All cycles
- 2024: R+35.9 2020: R+32.0 2016: R+30.0 2012: R+21.3 2008: R+16.0
Not yet ingested
- Civics
- —
Market trends
- HPI YoY
- ▼ -91.42%
- Current HPI
- 205.028
- Rent YoY
- —
- Metro
- —
- State GDP YoY
- ▲ 3.28%
- F500 in state
- 26
Industry mix (Fortune 500 HQ in NC)
| Industry | F500 HQs | Revenue |
|---|---|---|
| Financial Services | 2 | $213B |
|
||
| Retail | 2 | $95B |
|
||
| Industrial Conglomerate | 1 | $38B |
|
||
| Metals / Steel | 1 | $35B |
|
||
| Utilities | 1 | $30B |
|
||
| Industrial Machinery | 1 | $19B |
|
||
Price history
-5.5% since first listed5 events — show timeline
- 2026-05-13 Price Changed $44,900 Triad MLS
- 2026-05-06 Listed $49,900 Triad MLS
- 2012-03-06 Sold (MLS) $12,000 Triad MLS
- 2012-02-01 Listed $15,900 Triad MLS
- 1999-08-24 Sold (Public Records) $47,500 Public Records
Property tax history
+2.4%/yrLatest (2025): $713 · +0.0% YoY. Source: county tax records.
Cash-flow waterfall
monthlySold comps — $/sqft
last 12 mo · ≤1 miLoading sold comps…