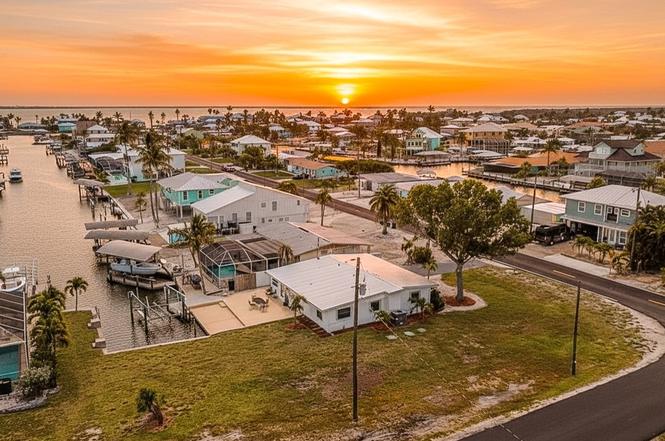
2390 Oleander St · St. James City, FL
Flood risk 9/10 · Severe
- FEMA flood zone
- AE
- Chance of flooding over 30 yrs
- 0.99%
- Est. flood insurance / yr
- $1,737 – $8,500
Fire risk 1/10 · Minimal
- Est. fire insurance / yr
- $947 – $1,759
Heat risk 10/10 · Severe
- Hot days now (above 107°F)
- 7 days/yr
- Hot days in 30 yrs
- 27 days/yr
Wind risk 10/10 · Severe
- Chance of severe wind over 30 yrs
- 99.0%
Air-quality risk 2/10 · Minimal
- Unhealthy air days now
- 1 days/yr
- Unhealthy air days in 30 yrs
- 2 days/yr
Risk factors via First Street. Map © Google.
Why this score? — see what drove the B- grade
The composite is a weighted blend of 9 inputs, each scored 0–100. Each bar is that input's sub-score; the figure is the points it added to the 100-point composite (weight × sub-score).
- Cash flow +26.6/30.0
- ARV discount +15.0/15.0
- DSCR +9.1/10.0
- 1% rule +7.0/10.0
- Schools +4.1/10.0
- Rent growth +2.5/5.0
- Livability +2.5/5.0
- Condition / age +2.5/5.0
- Appreciation +0.0/10.0
$359,000
🖨 Deal sheet 📄 Offer letter ✓ Due diligence
Listing remarks
DIRECT GULF ACCESS! Dreaming of living on the water with direct access? Here is your chance. It's not perfect but is priced accordingly. has had some major renovations. Located on an oversized corner lot in desirable St. James City. This 2BR, 2BA Pine Island Shores home is move-in-ready and is a great deal at this price. Step inside to find new flooring throughout, a new kitchen featuring stylish cabinetry, fixtures, and appliances, and fully renovated bathrooms with new tubs, showers, cabinets, and fixtures. Enjoy additional upgrades including a newer metal roof, new AC, new septic tank, new tankless water heater, new washer and dryer, new garage door, and an updated laundry room. Relax in
Key facts
- Oversized corner lot
- Direct gulf access
- New kitchen
Tags
Property features AI
Finance
- Financial info: Pets allowed
- HOA & community: No association fee; Community has boat facilities
Exterior
- Parking: Attached garage; Garage door opener; 2 parking spaces (1 covered)
- Utilities: Public water; Septic tank; Cable available; High-speed internet available
- Home design: Single-story; Entry level: 1; Faces west; Resale property; Property type: Single unit (1 unit in community); Zoning: RS-1
- Construction: Block, concrete and stucco construction; Metal roof; Built on foundation (standard)
- Exterior features: Corner lot; Canal access and navigable water; East exposure; Has view
Interior
- Kitchen: Dishwasher; Freezer; Garbage disposal; Microwave; Range; Self-cleaning oven; Refrigerator
- Flooring: Laminate
- Bathrooms: 2 full bathrooms
- Heating & cooling: Central heating (electric); Central air conditioning (electric)
- Interior features: Built-in features; Living/dining room; Tub/shower; Walk-in closet(s); Window treatments; Split bedrooms; Single hung windows; Window coverings; Unfurnished
- Laundry & utility: Washer; Dryer; Laundry located in garage
Neighborhood map
What this means for you Summary
Snapshot
- This is a 2-bed/2.0-bath single-family listed at $359k.
Deal economics
- At list price, monthly cash flow is $532 ($6k/yr) — positive.
- The deal already cash-flows at list — no discount required.
- Meets the 1% rule at list price ($4k rent vs $359k).
- Recommended offer: $316k (12.0% below list) — sets the bar for market timing.
- Cap rate 9.5% vs local median 4.9% in St. James City — top-decile yield for the area; either an underpriced asset or a hidden risk that comps aren't pricing in. Stress-test before assuming the spread holds.
Location & tenants
- Location reads: area grade B — affects rentability + tenant quality, not the cash-flow math above.
- Lee (suburban): math 47% / reading 50% proficiency, ranked #42 of 73 in FL (top 58%) — families likely to look elsewhere, expect single-tenant / working-renter base with shorter leases.
- Market conditions: 287 active listings in the ZIP; 5 comparable units currently listed for rent nearby; rentals at typical pace (median 24d on market — plan ~3-4 weeks tenant-placement turnaround); 15,411 units permitted in Lee County in 2024 (4,686 in 5+ unit buildings).
Forward outlook
- Local home prices are declining (-3.0%/yr); year-one equity from $2k of loan paydown is wiped out by about $11k of value loss. Plan a longer hold.
- Lee County population projected at +44% by 2050 — long-run rental-demand tailwind backs the buy-and-hold thesis.
Negotiation context
- It's been on market 195 days — a 12% lower offer ($316k) is reasonable based on typical stale-listing flexibility.
- 6 sale attempts since 26y ago; this cycle's ask has dropped $70k (16%) from the opening price — seller is motivated, your offer sets the floor, not the list.
Risks & watch-outs
- Watch-outs: flood insurance adds $427/mo; built in 1959 — expect roof / HVAC / electrical / plumbing capex.
- Climate carrying-cost: in FEMA flood zone AE (mandatory federal flood insurance); severe wind risk, 99% chance of damaging wind over 30y; extreme-heat days projected 7→27/yr by 2055 (HVAC capex compounding) — expect insurance premiums to compound above CPI over the hold.
Questions for the listing agent
- It's been on market 195 days. Have you received any prior offers? Is the seller open to a 12% concession, seller financing, or rate buy-down credit?
- Built in 1959 — when were the roof, HVAC, electrical panel, plumbing, and water heater last replaced?
- What's the actual annual flood-insurance premium (NFIP or private), and is the property in a SFHA with mandatory coverage?
- Why hasn't it sold? Are there any deal-killer items the seller is aware of (foundation, flood, title, zoning, code violations)?
- Is there a deadline driving the sale (1031 exchange, divorce, estate, relocation)? That informs how much negotiation room exists.
- What's the average days-on-market for RENTAL listings here right now (not sales)? A rising rental-DOM trend means longer vacancies and softer asking-rent achievability than the comps imply.
- What's the recent tenant-quality profile in this submarket — average credit score on applications, eviction rate, late-payment / NSF rate, and stable-employment percentage? A property-management company in the area should have these aggregated.
- How much new for-sale + rental construction is in the pipeline within 1–3 miles? Heavy new supply typically softens prices + rents 12–24 months out; constrained supply supports both.
Investment metrics
- 1% rule
- 1.20% ✓
- Cap rate
- 9.50%
- Cash-on-cash
- 11.45%
- DSCR
- 1.51
- GRM
- 7.0
CMA / ARV
- ARV (on-the-fly)
- $555,050
- Comps found
- 5
Show comp detail 5 sales within ~0.75 mi
| Address | Dist | Beds/Ba | Sqft | Sold | Price | $/sf | Match |
|---|---|---|---|---|---|---|---|
| 2288 Sycamore St | 0.45mi | 2/2.0 | 1,371 (+5%) | 4mo | $540,000 | $394 | 68 |
| 3177 Vacation Ln | 0.37mi | 2/3.0 | 1,344 (+3%) | 13mo | $1,040,000 | $774 | 63 |
| 2371 Baybreeze St | 0.33mi | 3/2.0 (+1) | 1,327 (+2%) | 23mo | $307,500 | $232 | 58 |
| 2411 Oleander St | 0.03mi | 2/1.0 | 1,117 (-14%) | 22mo | $475,000 | $425 | 52 |
| 3947 Coconut Dr | 0.56mi | 2/2.0 | 1,167 (-11%) | 5mo | $634,000 | $543 | 52 |
Match score weights: distance 35% · size 25% · config 20% · recency 20%. Top-matched comps best support the ARV.
Projected returns pro-forma
-3.0% appreciation · 3.0% rent growth · sell at horizon
- IRR
- -6.4%
- Equity multiple
- 0.76×
- Total profit
- $-23,969
- Equity at exit
- $53,528
- IRR
- 3.3%
- Equity multiple
- 1.24×
- Total profit
- $24,012
- Equity at exit
- $31,040
Cash invested: $100,520 (down + closing). Projections, not guarantees.
Landlord ↔ Tenant lean methodology
- Overall (STATE)
- 87 Strongly Landlord-Friendly
- State Florida
- 87 Strongly Landlord-Friendly · R+3
- County
- — inherits STATE
- City
- — inherits STATE
ZIP-level market 33956
- Home prices YoY
- -16.3%
- Active inventory
- 287
- Price-to-rent
- 7.0×
Monthly cashflow live
- Estimated rent
- $4,304 high interval (Pro) →
- Mortgage (P&I)
- −$1,883
- Tax from tax record
- −$409 /mo · $4,913/yr
- Insurance
- −$150
- Flood insurance flood zone
- −$427 /mo · $5,118/yr
- HOA
- −$0
- Vacancy / Maint / Mgmt
- −$904
- Net cashflow
- $532
Break-even live
UW: 25.0% down · 7.5% · 30yr · 1.5% tax · 5.0% vac · 8.0% maint · 8.0% mgmt
Financing live
Cash to close
- Down payment
- $89,750
- Closing costs
- $10,770
- Reserves months
- —
- Total cash needed
- —
Loan-product check · same deal, 3 products live
Conventional
25% down · 7.5% · 30yr
- Down + closing
- —
- Monthly P&I
- —
- Monthly cashflow
- —
- DSCR
- —
- Eligible?
- —
Personal DTI + credit; lowest rate.
DSCR
20% down · 8.5% · 30yr
- Down + closing
- —
- Monthly P&I
- —
- Monthly cashflow
- —
- DSCR
- —
- Eligible?
- —
No personal income docs; deal must DSCR.
Hard money
10% down · 12.0% · 12mo
- Down + closing
- —
- Monthly P&I
- —
- Monthly cashflow
- —
- DSCR
- —
- Eligible?
- —
Short-term bridge; refi at stabilization.
Rent comps 5 comps
| Address | Beds | Baths | Sqft | Rent | $/sqft | DOM | Units | Dist |
|---|---|---|---|---|---|---|---|---|
| 3811 Emerald Ave Saint James City, FL | 3.0 | 2.5 | 1500 | $5,500 | $3.67 | 23d | 1 | 0.39mi |
| 3864 Royal Palm Dr Saint James City, FL | 2.0 | 1.0 | 960 | $1,650 | $1.72 | 23d | 1 | 0.52mi |
| 2951 York Rd Saint James City, FL | 2.0 | 2.0 | 1444 | $5,500 | $3.81 | 23d | 1 | 0.55mi |
| 3103 Harpoon Ln Saint James City, FL | 2.0 | 2.0 | 1094 | $3,000 | $2.74 | 23d | 1 | 0.78mi |
| 4011 Galt Island Ave Saint James City, FL | 3.0 | 2.0 | 1836 | $5,000 | $2.72 | 23d | 1 | 0.95mi |
Listing history 29 events
-
2026-06-17days on market $359,000 Active 195 DOM
-
2026-06-16days on market $359,000 Active 194 DOM
-
2026-06-15days on market $359,000 Active 193 DOM
-
2026-06-13days on market $359,000 Active 191 DOM
-
2026-06-09days on market $359,000 Active 187 DOM
-
2026-06-07days on market $359,000 Active 185 DOM
-
2026-06-02days on market $359,000 Active 180 DOM
-
2026-06-01days on market $359,000 Active 179 DOM
-
2026-06-01days on market $359,000 Active 178 DOM
-
2026-05-21price $359,000
-
2026-02-19price $369,000
-
2026-01-27price $399,000
-
2025-12-01$429,000 Active
-
2025-08-04historical
-
2025-02-22price $499,000
-
2025-02-04$575,000 Active
-
2024-10-17historical
-
2024-05-16$675,000 Active
-
2023-06-15soldstatus $370,000
-
2023-06-12soldstatus $370,000 Closed
-
2023-04-26status Pending
-
2023-04-12status Active
-
2023-04-12price $450,000
-
2023-03-19status Pending
-
2022-03-15$499,900 Active
-
2001-08-31soldstatus $185,000
-
2001-03-31historical
-
2000-08-13$159,000
-
1999-06-04soldstatus $98,000
ⓘ Source: listings_history table (triggers on properties + properties_extension) + one-shot
backfill from property_details.listing_events for pre-trigger history.
Tax reassessment forecast FL · Resets to sale price
- Current annual tax
- $4,913 · $409/mo
- Projected year-2 tax
- $4,913 · $409/mo
- Expected delta
- $0/yr ($0/mo · 0.0%)
ⓘ Screening estimate from a state-policy table — verify with the county assessor before closing.
Climate risk First Street
- Flood 9/10 Extreme FEMA zone AE · 99% chance over 30 yrs
- Wildfire 1/10 Low
- Heat 10/10 Extreme 7 d/yr ≥107°F today · 27 d/yr by 30 yrs out
- Wind 10/10 Extreme 99% chance of damaging wind over 30 yrs
- Air quality 2/10 Low 1 unhealthy d/yr today · 2 by 30 yrs out
Nearby sold comps map
Loading sold comps map…
Walkable amenities ~0.75 mi
Loading nearby amenities…
Taxation est. · year 1
- Rental income
- $51,652
- − Mortgage interest
- −$20,110
- − Property taxes
- −$4,913
- − Insurance
- −$6,914
- − Repairs & maintenance
- −$4,132
- − Management
- −$4,132
- − Depreciation
- −$10,444
- Taxable income
- $1,008
- Est. tax owed @ 24.0%
- −$242
- After-tax cash flow
- $6,145/yr
For passive investors: Depreciation is non-cash, so a rental often shows a tax loss while cash-flowing — sheltering income. Rental losses are passive: they offset passive income freely, and up to $25,000/yr can offset ordinary (W-2) income if you actively participate and your MAGI is under $100k (phasing out to $0 by $150k); unused losses carry forward. On sale, claimed depreciation is recaptured at up to 25%, and gains may owe capital-gains tax (a 1031 exchange can defer both). Figures are a year-1 estimate at your 24.0% rate — not tax advice; consult a CPA.
Schools (NCES district)
- District
- Lee
- NCES district ID
- 1201080
- Math proficiency
- 47% ▼ -11.00%
- Reading proficiency
- 50% ▼ -4.00%
- Median HH income
- $49,518
- Composite
- 41.49/100
- National rank
- #3458
- State rank
- #42 of 73 in FL
Livability — St. James City
No livability data for this city. (Only ~50 U.S. cities are tracked.)
Census & demographics
- Census place
- St. James City, FL
- Population (ZIP)
- 3,846
Population outlook (Lee County) Hauer SSP2
- Today (2025)
- 871,946 people
- By 2030
- 955,468 · +9.6%
- By 2040
- 1,113,587 · +27.7%
- By 2050
- 1,256,891 · +44.1%
- By 2075
- 1,560,270 · +78.9%
- By 2100
- 1,726,848 · +98.0%
Race, ethnicity, and origin ACS 2023
- Neighborhood character
- Predominantly White (94%)
- Race & ethnicity
- White 94% Two or more races 3% Pacific Islander 2% Hispanic / Latino 1%
- Common ancestry
- Romanian 6% Slovak 4% Iranian 3%
- Foreign-born
- 5% · Canada
- Languages at home
- 95% English-only · French/Haitian/Cajun 2% German/W. Germanic 2% Russian/Polish/Slavic 1%
Political lean MEDSL · Lee
- 2024 margin
- Strong R (+28.4) · D 35.5% · R 63.9%
- 2008→2024 swing
- -18.0pp toward R · 2008: -10.4pp · 2024: -28.4pp
- All cycles
- 2024: R+28.4 2020: R+19.2 2016: R+20.4 2012: R+16.6 2008: R+10.4
Not yet ingested
- Civics
- —
Market trends
- HPI YoY
- ▼ -58.47%
- Current HPI
- 300.1416
- Rent YoY
- —
- Metro
- —
- State GDP YoY
- ▲ 3.28%
- F500 in state
- 36
Industry mix (Fortune 500 HQ in FL)
| Industry | F500 HQs | Revenue |
|---|---|---|
| Industrial Technology | 2 | $29B |
|
||
| Insurance | 2 | $17B |
|
||
| Retail | 1 | $60B |
|
||
| Technology Distribution | 1 | $58B |
|
||
| Homebuilding | 1 | $35B |
|
||
| Technology Manufacturing | 1 | $35B |
|
||
Price history
+266.3% since first listed20 events — show timeline
- 2026-05-21 Price Changed $359,000 FORTMLS
- 2026-02-19 Price Changed $369,000 FORTMLS
- 2026-01-27 Price Changed $399,000 FORTMLS
- 2025-12-01 Listed $429,000 FORTMLS
- 2025-08-04 Listing Removed — FORTMLS
- 2025-02-22 Price Changed $499,000 FORTMLS
- 2025-02-04 Listed $575,000 FORTMLS
- 2024-10-17 Listing Removed — FORTMLS
- 2024-05-16 Listed $675,000 FORTMLS
- 2023-06-15 Sold (Public Records) $370,000 Public Records
- 2023-06-12 Sold (MLS) $370,000 FORTMLS
- 2023-04-26 Pending — FORTMLS
- 2023-04-12 Relisted — FORTMLS
- 2023-04-12 Price Changed $450,000 FORTMLS
- 2023-03-19 Pending — FORTMLS
- 2022-03-15 Listed $499,900 FORTMLS
- 2001-08-31 Sold (Public Records) $185,000 Public Records
- 2001-03-31 Listing Removed — FORTMLS
- 2000-08-13 Listed $159,000 FORTMLS
- 1999-06-04 Sold (Public Records) $98,000 Public Records
Property tax history
+6.7%/yrLatest (2025): $4,913 · -24.1% YoY. Source: county tax records.
Cash-flow waterfall
monthlySold comps — $/sqft
last 12 mo · ≤1 miLoading sold comps…