310 Oakland Ave · Findlay, OH
Flood risk 1/10 · Minimal
- FEMA flood zone
- X (unshaded)
- Chance of flooding over 30 yrs
- 0.0%
- Est. flood insurance / yr
- $507 – $1,088
Fire risk 1/10 · Minimal
- Est. fire insurance / yr
- $713 – $1,323
Heat risk 3/10 · Minor
- Hot days now (above 99°F)
- 7 days/yr
- Hot days in 30 yrs
- 17 days/yr
Wind risk 2/10 · Minimal
- Chance of severe wind over 30 yrs
- —
Air-quality risk 2/10 · Minimal
- Unhealthy air days now
- 1 days/yr
- Unhealthy air days in 30 yrs
- 2 days/yr
Risk factors via First Street. Map © Google.
Why this score? — see what drove the C+ grade
The composite is a weighted blend of 9 inputs, each scored 0–100. Each bar is that input's sub-score; the figure is the points it added to the 100-point composite (weight × sub-score).
- Cash flow +23.4/30.0
- ARV discount +10.3/15.0
- DSCR +7.5/10.0
- 1% rule +6.1/10.0
- Schools +4.7/10.0
- Livability +4.0/5.0
- Rent growth +3.9/5.0
- Condition / age +2.5/5.0
- Appreciation +0.0/10.0
$149,900
🖨 Deal sheet 📄 Offer letter ✓ Due diligence
Listing remarks MLS
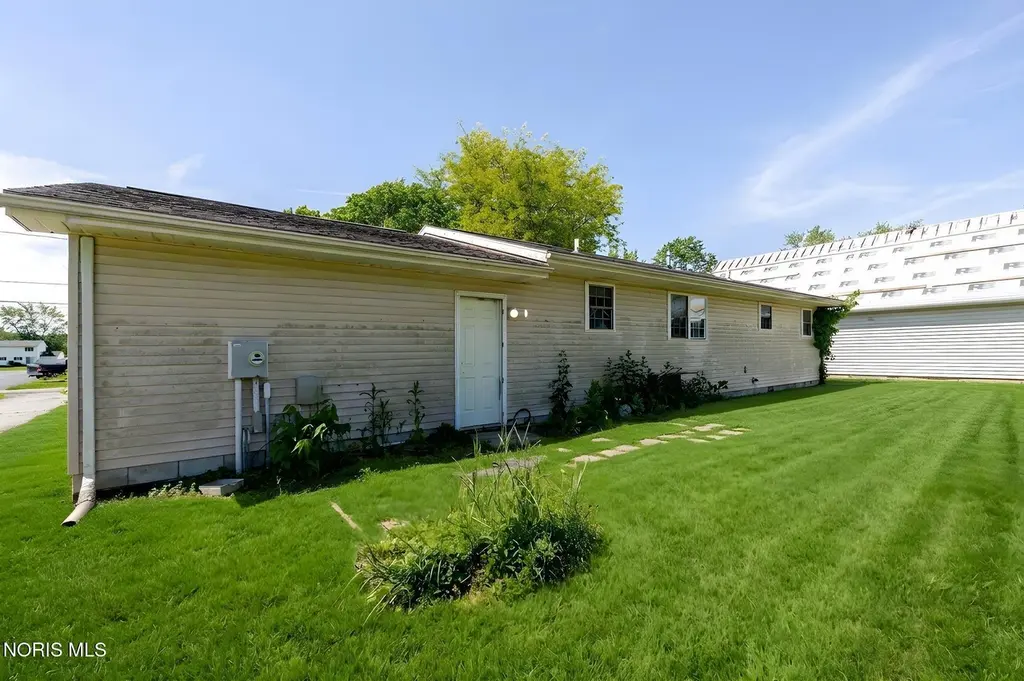
NICE 3BR RANCH ON FINDLAY'S SOUTHEND. OPEN CONCEPT LIVING AREA WITH SPLIT BEDROOM CONCEPT. 1 CAR HEATED GARAGE WITH NEW INSULATED GARAGE DOOR AND OPENER. ALL STAINLESS STEEL APPLIANCES STAY INCLUDING DISHWASHER. LAUNDRY IS CURRENTLY IN GARAGE BUT COULD BE BROUGHT BACK INTO THE HOUSE IF DESIRED (SEE AGENT FOR INFORMATION). OUTSIDE PATIO OVERLOOKS LARGE BACKYARD AND STORAGE SHED. THERE IS A WELL ON THE PROPERTY BUT CURRENT OWNER HAS NEVER USED IT. CONTACT LISTING AGENT FOR MORE INFORMATION.
Key facts
- 0.25 acre lot
- 2 garage spots
- Built 2000
Property features AI
Exterior
- Parking: Attached 2-car garage
- Utilities: Public water; Public sewer; Other utilities
- Home design: Single-family residence; Detached, one story
- Construction: Vinyl siding; Block foundation; Built with typical residential construction
- Exterior features: Shingle roof
Interior
- Kitchen: Kitchen on the main level (10 x 10); Refrigerator
- Bedrooms: Bedroom 2 on the main level (9 x 13); Bedroom 3 on the main level (12 x 9)
- Flooring: Carpet
- Bathrooms: One full bathroom
- Heating & cooling: Forced air heating; Window unit(s) for cooling
- Interior features: Ceiling fan(s); Five total rooms
- Laundry & utility: Washer and dryer; Laundry located on the main level and in the garage
Neighborhood map
What this means for you Summary
Snapshot
- This is a 3-bed/1.0-bath single-family listed at $150k.
Deal economics
- At list price, monthly cash flow is $277 ($3k/yr) — positive.
- The deal already cash-flows at list — no discount required.
- Meets the 1% rule at list price ($2k rent vs $150k).
- Cap rate 8.5% vs local median 5.0% in Findlay — top-decile yield for the area; either an underpriced asset or a hidden risk that comps aren't pricing in. Stress-test before assuming the spread holds.
Location & tenants
- Location reads 81/100 on livability (#98 in OH, #1,496 nationally) — a professional / high-income tenant draw. Strengths: amenities A+, cost of living A+, housing A+; Watch: employment D+, commute F.
- Findlay City (town): math 56% / reading 56% proficiency, ranked #357 of 656 in OH (top 54%) — acceptable for families but not a draw, mixed tenant base, ~2y average lease.
- Zoned schools: Jefferson Primary School (393 students, 34% FRL); Donnell Middle School (math 57% / reading 54%, grade B-, #321 of 654 statewide, top 51%, 523 students, 41% FRL); Findlay High School (math 51% / reading 60%, grade C, #296 of 781 statewide, top 39%, 1,915 students, 31% FRL) — zoned schools at 35% FRL track the district average.
- Market conditions: Rents rising fast (+5.7%/yr); 219 active listings in the ZIP; 257 units permitted in Hancock County in 2024 (150 in 5+ unit buildings).
Forward outlook
- Local home prices are declining (-3.0%/yr); year-one equity from $1k of loan paydown is wiped out by about $4k of value loss. Plan a longer hold.
- Hancock County population projected to shrink 4% by 2050 — rents likely to lag national; underwrite the cash flow, not the appreciation.
- At projected returns (-3.0% appreciation + 5.7% rent growth), your $42k cash investment doubles in ~10 years — after that, you're playing with house money.
Negotiation context
- Only 1 days on market — expect competitive offers; lowballing is unlikely to land.
- 5 sale attempts since 11y ago with the ask held roughly flat each time — persistent listings suggest the price (not the market) is what's stuck; bring a comps-based counter.
- Current owner paid $106k; 41% above their basis — modest negotiation headroom, anchor on the comps not their cost.
Questions for the listing agent
- Is there a deadline driving the sale (1031 exchange, divorce, estate, relocation)? That informs how much negotiation room exists.
- Schools are B-rated — typically a magnet for longer-tenancy family renters. What's the average tenant stay here, and is there a school-zone premium baked into asking?
- What's the average days-on-market for RENTAL listings here right now (not sales)? A rising rental-DOM trend means longer vacancies and softer asking-rent achievability than the comps imply.
- What's the recent tenant-quality profile in this submarket — average credit score on applications, eviction rate, late-payment / NSF rate, and stable-employment percentage? A property-management company in the area should have these aggregated.
- How much new for-sale + rental construction is in the pipeline within 1–3 miles? Heavy new supply typically softens prices + rents 12–24 months out; constrained supply supports both.
Investment metrics
- 1% rule
- 1.11% ✓
- Cap rate
- 8.51%
- Cash-on-cash
- 7.92%
- DSCR
- 1.35
- GRM
- 7.5
CMA / ARV
- ARV (on-the-fly)
- $159,840
- Comps found
- 6
Show comp detail 6 sales within ~0.75 mi
| Address | Dist | Beds/Ba | Sqft | Sold | Price | $/sf | Match |
|---|---|---|---|---|---|---|---|
| 211 Woodley Ave | 0.15mi | 3/1.0 | 1,209 (+12%) | 14mo | $190,000 | $157 | 62 |
| 1711 Washington Ave | 0.68mi | 3/1.0 | 1,186 (+10%) | 4mo | $170,000 | $143 | 48 |
| 400 E Pearl St | 0.63mi | 3/1.0 | 925 (-14%) | 0mo | $132,000 | $143 | 46 |
| 404 W Yates Ave | 0.63mi | 3/2.0 | 1,166 (+8%) | 11mo | $173,000 | $148 | 44 |
| 1727 Washington Ave | 0.64mi | 3/1.0 | 1,218 (+13%) | 6mo | $180,000 | $148 | 44 |
| 118 E Pearl St | 0.67mi | 3/1.5 | 1,218 (+13%) | 20mo | $167,500 | $138 | 29 |
Match score weights: distance 35% · size 25% · config 20% · recency 20%. Top-matched comps best support the ARV.
Projected returns pro-forma
-3.0% appreciation · 5.68% rent growth · sell at horizon
- IRR
- -1.2%
- Equity multiple
- 0.95×
- Total profit
- $-2,004
- Equity at exit
- $22,351
- IRR
- 11.1%
- Equity multiple
- 1.98×
- Total profit
- $41,093
- Equity at exit
- $12,961
Cash invested: $41,972 (down + closing). Projections, not guarantees.
Landlord ↔ Tenant lean methodology
- Overall (STATE)
- 73 Landlord-Friendly
- State Ohio
- 73 Landlord-Friendly · R+6
- County
- — inherits STATE
- City
- — inherits STATE
ZIP-level market 45840
- Rents YoY
- 5.7%
- Active inventory
- 219
- Price-to-rent
- 7.5×
Monthly cashflow live
- Estimated rent
- $1,667 medium interval (Pro) →
- Mortgage (P&I)
- −$786
- Tax from tax record
- −$191 /mo · $2,295/yr
- Insurance
- −$62
- HOA
- −$0
- Vacancy / Maint / Mgmt
- −$350
- Net cashflow
- $277
Break-even live
UW: 25.0% down · 7.5% · 30yr · 1.5% tax · 5.0% vac · 8.0% maint · 8.0% mgmt
Financing live
Cash to close
- Down payment
- $37,475
- Closing costs
- $4,497
- Reserves months
- —
- Total cash needed
- —
Loan-product check · same deal, 3 products live
Conventional
25% down · 7.5% · 30yr
- Down + closing
- —
- Monthly P&I
- —
- Monthly cashflow
- —
- DSCR
- —
- Eligible?
- —
Personal DTI + credit; lowest rate.
DSCR
20% down · 8.5% · 30yr
- Down + closing
- —
- Monthly P&I
- —
- Monthly cashflow
- —
- DSCR
- —
- Eligible?
- —
No personal income docs; deal must DSCR.
Hard money
10% down · 12.0% · 12mo
- Down + closing
- —
- Monthly P&I
- —
- Monthly cashflow
- —
- DSCR
- —
- Eligible?
- —
Short-term bridge; refi at stabilization.
Listing history 12 events
-
2026-05-22$149,900 Active
-
2018-12-28soldstatus $106,000
-
2018-12-27soldstatus $106,000 493-char remark
Show marketing remark (500 chars)
NICE 3BR RANCH ON FINDLAY'S SOUTHEND. OPEN CONCEPT LIVING AREA WITH SPLIT BEDROOM CONCEPT. 1 CAR HEATED GARAGE WITH NEW INSULATED GARAGE DOOR AND OPENER. ALL STAINLESS STEEL APPLIANCES STAY INCLUDING DISHWASHER. LAUNDRY IS CURRENTLY IN GARAGE BUT COULD BE BROUGHT BACK INTO THE HOUSE IF DESIRED (SEE AGENT FOR INFORMATION). OUTSIDE PATIO OVERLOOKS LARGE BACKYARD AND STORAGE SHED. THERE IS A WELL ON THE PROPERTY BUT CURRENT OWNER HAS NEVER USED IT. CONTACT LISTING AGENT FOR MORE INFORMATION.
-
2018-12-27soldstatus $106,000 500-char remark
Show marketing remark (500 chars)
NICE 3BR RANCH ON FINDLAY'S SOUTHEND. OPEN CONCEPT LIVING AREA WITH SPLIT BEDROOM CONCEPT. 1 CAR HEATED GARAGE WITH NEW INSULATED GARAGE DOOR AND OPENER. ALL STAINLESS STEEL APPLIANCES STAY INCLUDING DISHWASHER. LAUNDRY IS CURRENTLY IN GARAGE BUT COULD BE BROUGHT BACK INTO THE HOUSE IF DESIRED (SEE AGENT FOR INFORMATION). OUTSIDE PATIO OVERLOOKS LARGE BACKYARD AND STORAGE SHED. THERE IS A WELL ON THE PROPERTY BUT CURRENT OWNER HAS NEVER USED IT. CONTACT LISTING AGENT FOR MORE INFORMATION.
-
2018-10-11$110,000 493-char remark
Show marketing remark (500 chars)
NICE 3BR RANCH ON FINDLAY'S SOUTHEND. OPEN CONCEPT LIVING AREA WITH SPLIT BEDROOM CONCEPT. 1 CAR HEATED GARAGE WITH NEW INSULATED GARAGE DOOR AND OPENER. ALL STAINLESS STEEL APPLIANCES STAY INCLUDING DISHWASHER. LAUNDRY IS CURRENTLY IN GARAGE BUT COULD BE BROUGHT BACK INTO THE HOUSE IF DESIRED (SEE AGENT FOR INFORMATION). OUTSIDE PATIO OVERLOOKS LARGE BACKYARD AND STORAGE SHED. THERE IS A WELL ON THE PROPERTY BUT CURRENT OWNER HAS NEVER USED IT. CONTACT LISTING AGENT FOR MORE INFORMATION.
-
2018-10-11$106,000 500-char remark
Show marketing remark (500 chars)
NICE 3BR RANCH ON FINDLAY'S SOUTHEND. OPEN CONCEPT LIVING AREA WITH SPLIT BEDROOM CONCEPT. 1 CAR HEATED GARAGE WITH NEW INSULATED GARAGE DOOR AND OPENER. ALL STAINLESS STEEL APPLIANCES STAY INCLUDING DISHWASHER. LAUNDRY IS CURRENTLY IN GARAGE BUT COULD BE BROUGHT BACK INTO THE HOUSE IF DESIRED (SEE AGENT FOR INFORMATION). OUTSIDE PATIO OVERLOOKS LARGE BACKYARD AND STORAGE SHED. THERE IS A WELL ON THE PROPERTY BUT CURRENT OWNER HAS NEVER USED IT. CONTACT LISTING AGENT FOR MORE INFORMATION.
-
2016-02-12soldstatus $100,500
-
2016-02-09soldstatus $100,500
-
2016-02-09soldstatus $100,500
-
2015-07-13$99,500
-
2015-07-13$100,500
-
1999-12-09soldstatus $12,000
ⓘ Source: listings_history table (triggers on properties + properties_extension) + one-shot
backfill from property_details.listing_events for pre-trigger history.
Tax reassessment forecast OH · Partial reset (capped growth)
- Current annual tax
- $2,295 · $191/mo
- Projected year-2 tax
- $2,316 · $193/mo
- Expected delta
- +$22/yr (+$2/mo · 1.0%)
ⓘ Screening estimate from a state-policy table — verify with the county assessor before closing.
Climate risk First Street
- Flood 1/10 Low FEMA zone X (unshaded) · 0% chance over 30 yrs
- Wildfire 1/10 Low
- Heat 3/10 Moderate 7 d/yr ≥99°F today · 17 d/yr by 30 yrs out
- Wind 2/10 Low
- Air quality 2/10 Low 1 unhealthy d/yr today · 2 by 30 yrs out
Nearby sold comps map
Loading sold comps map…
Walkable amenities ~0.75 mi
Loading nearby amenities…
Taxation est. · year 1
- Rental income
- $20,002
- − Mortgage interest
- −$8,397
- − Property taxes
- −$2,295
- − Insurance
- −$750
- − Repairs & maintenance
- −$1,600
- − Management
- −$1,600
- − Depreciation
- −$4,361
- Taxable income
- $1,000
- Est. tax owed @ 24.0%
- −$240
- After-tax cash flow
- $3,084/yr
For passive investors: Depreciation is non-cash, so a rental often shows a tax loss while cash-flowing — sheltering income. Rental losses are passive: they offset passive income freely, and up to $25,000/yr can offset ordinary (W-2) income if you actively participate and your MAGI is under $100k (phasing out to $0 by $150k); unused losses carry forward. On sale, claimed depreciation is recaptured at up to 25%, and gains may owe capital-gains tax (a 1031 exchange can defer both). Figures are a year-1 estimate at your 24.0% rate — not tax advice; consult a CPA.
Schools (NCES district)
- District
- Findlay City
- NCES district ID
- 3910000
- Math proficiency
- 56% ▼ -11.00%
- Reading proficiency
- 56% ▼ -9.00%
- Median HH income
- $45,261
- Composite
- 47.31/100
- National rank
- #2300
- State rank
- #357 of 656 in OH
Livability — Findlay
- Score
- 81/100
- State rank
- #98
- US rank
- #1496
Category grades
Schools grade is shown separately in the Schools card above.
Census & demographics
- Census place
- Findlay, OH
- County
- Hancock County · 54,559 people
- City population
- 54,559
- Metro
- Findlay, OH
- Population (ZIP)
- 54,559
- Household income
- $68,083
- Rent vs Own
- Severe rent burden
- 1540.0
Population outlook (Hancock County) Hauer SSP2
- Today (2025)
- 77,526 people
- By 2030
- 77,777 · +0.3%
- By 2040
- 76,976 · -0.7%
- By 2050
- 74,479 · -3.9%
- By 2075
- 65,741 · -15.2%
- By 2100
- 52,942 · -31.7%
Race, ethnicity, and origin ACS 2023
- Neighborhood character
- Predominantly White (85%)
- Race & ethnicity
- White 85% Hispanic / Latino 6% Two or more races 5% Asian 2% Black 2%
- Hispanic origin (detail)
- Mexican 5%
- Common ancestry
- Romanian 3% Italian 2% Lithuanian 2%
- Foreign-born
- 4% · Canada, China
- Languages at home
- 94% English-only · Spanish 3% Other Asian/Pacific 1% Arabic 1%
Political lean MEDSL · Hancock
- 2024 margin
- Solid R (+38.4) · D 30.2% · R 68.7% · Other 1.1%
- 2008→2024 swing
- -15.3pp toward R · 2008: -23.1pp · 2024: -38.4pp
- All cycles
- 2024: R+38.4 2020: R+37.5 2016: R+40.8 2012: R+28.3 2008: R+23.1
Not yet ingested
- Civics
- —
Market trends
- HPI YoY
- ▼ -250.43%
- Current HPI
- 194.9132
- Rent YoY
- ▲ 5.68%
- Metro
- Findlay, OH
- State GDP YoY
- ▲ 1.98%
- F500 in state
- 48
Industry mix (Fortune 500 HQ in OH)
| Industry | F500 HQs | Revenue |
|---|---|---|
| Insurance | 3 | $145B |
|
||
| Industrial Machinery | 3 | $49B |
|
||
| Financial Services | 3 | $24B |
|
||
| Consumer Goods | 2 | $93B |
|
||
| Aerospace / Defense | 2 | $47B |
|
||
| Utilities | 2 | $33B |
|
||
Price history
+1149.2% since first listed12 events — show timeline
- 2026-05-22 Listed $149,900 NORIS
- 2018-12-28 Sold (Public Records) $106,000 Public Records
- 2018-12-27 Sold (MLS) $106,000 NORIS
- 2018-12-27 Sold (MLS) $106,000 NORIS
- 2018-10-11 Listed $106,000 NORIS
- 2018-10-11 Listed $110,000 NORIS
- 2016-02-12 Sold (Public Records) $100,500 Public Records
- 2016-02-09 Sold (MLS) $100,500 NORIS
- 2016-02-09 Sold (MLS) $100,500 NORIS
- 2015-07-13 Listed $100,500 NORIS
- 2015-07-13 Listed $99,500 NORIS
- 1999-12-09 Sold (Public Records) $12,000 Public Records
Property tax history
+4.5%/yrLatest (2025): $2,295 · +9.7% YoY. Source: county tax records.
Cash-flow waterfall
monthlySold comps — $/sqft
last 12 mo · ≤1 miLoading sold comps…