128 S Main St · Antwerp, MI
Flood risk 1/10 · Minimal
- FEMA flood zone
- X (unshaded)
- Chance of flooding over 30 yrs
- 0.0%
- Est. flood insurance / yr
- $473 – $860
Fire risk 2/10 · Minimal
- Est. fire insurance / yr
- $784 – $1,456
Heat risk 2/10 · Minimal
- Hot days now (above 99°F)
- 7 days/yr
- Hot days in 30 yrs
- 16 days/yr
Wind risk 2/10 · Minimal
- Chance of severe wind over 30 yrs
- —
Air-quality risk 3/10 · Minor
- Unhealthy air days now
- 2 days/yr
- Unhealthy air days in 30 yrs
- 4 days/yr
Risk factors via First Street. Map © Google.
Why this score? — see what drove the C+ grade
The composite is a weighted blend of 9 inputs, each scored 0–100. Each bar is that input's sub-score; the figure is the points it added to the 100-point composite (weight × sub-score).
- Cash flow +26.8/30.0
- DSCR +9.2/10.0
- ARV discount +7.5/15.0
- 1% rule +7.0/10.0
- Schools +3.1/10.0
- Rent growth +2.5/5.0
- Livability +2.5/5.0
- Condition / age +2.5/5.0
- Appreciation +0.0/10.0
$200,000
🖨 Deal sheet 📄 Offer letter ✓ Due diligence
Listing remarks
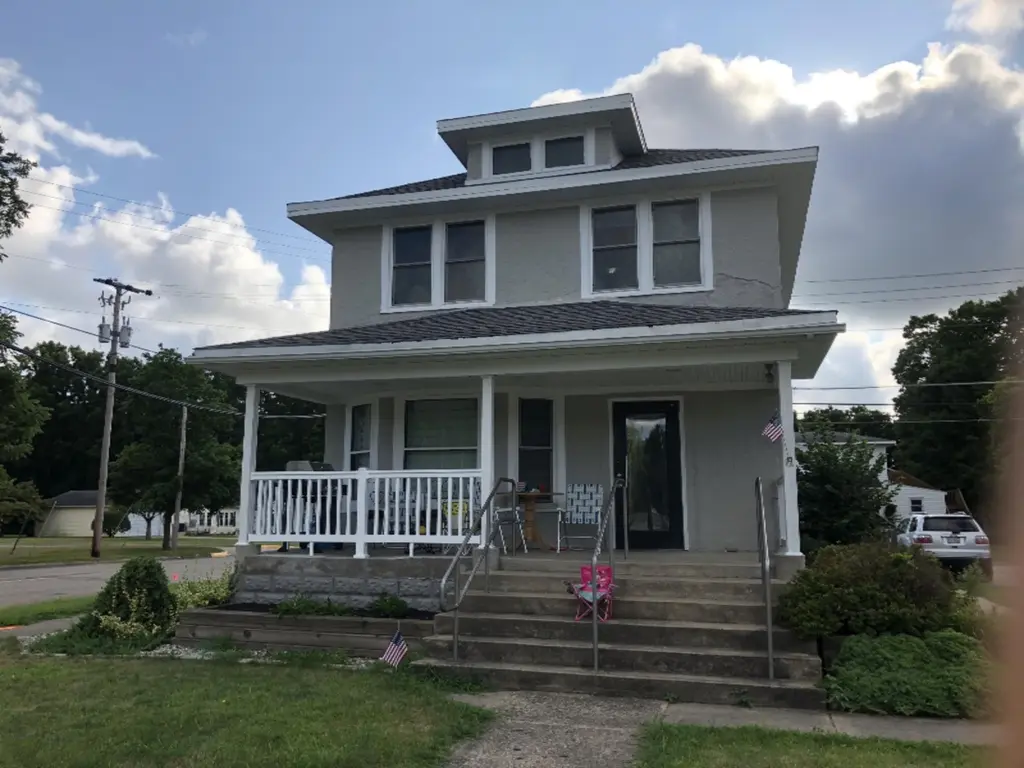
This well maintained duplex (2BR, 1BA + 1BR, 1BA) has had extensive renovations inside and the stucco exterior was painted Summer of 2018. Consistently occupied with combined rental income of ~$1950 per month. Fantastic location, across from the Lawton Fire Station/Village Office and next to the Post Office. A short walk to Lawton Elementary School and the Lawton Park/Splash Pad with brand new pickleball courts! Separate furnaces, electrical panels, central air units and washer/dryer hook-ups. Washer and dryer in lower unit included. Kitchen appliances included. Most windows are vinyl replacement. Could use some minor TLC but move-in ready. Would make an excellent owner-occupied.
Key facts
- Central air units
- Separate furnaces
- Stucco exterior
Tags
Neighborhood map
What this means for you Summary
Snapshot
- This is a 6-bed/2.0-bath single-family listed at $200k.
Deal economics
- At list price, monthly cash flow is $548 ($7k/yr) — positive.
- The deal already cash-flows at list — no discount required.
- Meets the 1% rule at list price ($2k rent vs $200k).
Location & tenants
- Location reads: area grade C — affects rentability + tenant quality, not the cash-flow math above.
- Lawton Community School District (rural): math 27% / reading 45% proficiency, ranked #263 of 540 in MI (top 49%) — families likely to look elsewhere, expect single-tenant / working-renter base with shorter leases.
- Market conditions: 32 active listings in the ZIP; 165 units permitted in Van Buren County in 2024 (0 in 5+ unit buildings).
Forward outlook
- Local home prices are declining (-3.0%/yr); year-one equity from $1k of loan paydown is wiped out by about $6k of value loss. Plan a longer hold.
- Van Buren County population projected at -23% by 2050 — secular population decline; favor cash flow + early exit over multi-decade hold.
- At projected returns (-3.0% appreciation + 3.0% rent growth), your $56k cash investment doubles in ~10 years — after that, you're playing with house money.
Negotiation context
- Only 1 days on market — expect competitive offers; lowballing is unlikely to land.
- 13 sale attempts since 20y ago with the ask held roughly flat each time — persistent listings suggest the price (not the market) is what's stuck; bring a comps-based counter.
- Current owner paid $130k; list at $200k implies a 54% gain — meaningful room to come down on a strong offer.
Risks & watch-outs
- Watch-outs: built in 1932 — expect roof / HVAC / electrical / plumbing capex.
Questions for the listing agent
- Built in 1932 — when were the roof, HVAC, electrical panel, plumbing, and water heater last replaced?
- Is there a deadline driving the sale (1031 exchange, divorce, estate, relocation)? That informs how much negotiation room exists.
- What's the average days-on-market for RENTAL listings here right now (not sales)? A rising rental-DOM trend means longer vacancies and softer asking-rent achievability than the comps imply.
- What's the recent tenant-quality profile in this submarket — average credit score on applications, eviction rate, late-payment / NSF rate, and stable-employment percentage? A property-management company in the area should have these aggregated.
- How much new for-sale + rental construction is in the pipeline within 1–3 miles? Heavy new supply typically softens prices + rents 12–24 months out; constrained supply supports both.
Investment metrics
- 1% rule
- 1.20% ✓
- Cap rate
- 9.58%
- Cash-on-cash
- 11.73%
- DSCR
- 1.52
- GRM
- 6.9
CMA / ARV
No comps found within radius.
Projected returns pro-forma
-3.0% appreciation · 3.0% rent growth · sell at horizon
- IRR
- 1.2%
- Equity multiple
- 1.04×
- Total profit
- $2,481
- Equity at exit
- $29,821
- IRR
- 10.8%
- Equity multiple
- 1.84×
- Total profit
- $47,139
- Equity at exit
- $17,292
Cash invested: $56,000 (down + closing). Projections, not guarantees.
Landlord ↔ Tenant lean methodology
- Overall (STATE)
- 62 Landlord-Friendly
- State Michigan
- 62 Landlord-Friendly · EVEN
- County
- — inherits STATE
- City
- — inherits STATE
ZIP-level market 49065
- Active inventory
- 32
- Price-to-rent
- 6.9×
Monthly cashflow live
- Estimated rent
- $2,406 medium interval (Pro) →
- Mortgage (P&I)
- −$1,049
- Tax from tax record
- −$221 /mo · $2,658/yr
- Insurance
- −$83
- HOA
- −$0
- Vacancy / Maint / Mgmt
- −$505
- Net cashflow
- $548
Break-even live
UW: 25.0% down · 7.5% · 30yr · 1.5% tax · 5.0% vac · 8.0% maint · 8.0% mgmt
Financing live
Cash to close
- Down payment
- $50,000
- Closing costs
- $6,000
- Reserves months
- —
- Total cash needed
- —
Loan-product check · same deal, 3 products live
Conventional
25% down · 7.5% · 30yr
- Down + closing
- —
- Monthly P&I
- —
- Monthly cashflow
- —
- DSCR
- —
- Eligible?
- —
Personal DTI + credit; lowest rate.
DSCR
20% down · 8.5% · 30yr
- Down + closing
- —
- Monthly P&I
- —
- Monthly cashflow
- —
- DSCR
- —
- Eligible?
- —
No personal income docs; deal must DSCR.
Hard money
10% down · 12.0% · 12mo
- Down + closing
- —
- Monthly P&I
- —
- Monthly cashflow
- —
- DSCR
- —
- Eligible?
- —
Short-term bridge; refi at stabilization.
Listing history 2 events
-
2026-06-18remarks 688-char remark
-
2026-06-18$200,000 Active 1 DOM
ⓘ Source: listings_history table (triggers on properties + properties_extension) + one-shot
backfill from property_details.listing_events for pre-trigger history.
Tax reassessment forecast MI · Partial reset (capped growth)
- Current annual tax
- $2,658 · $221/mo
- Projected year-2 tax
- $2,869 · $239/mo
- Expected delta
- +$211/yr (+$18/mo · 7.9%)
ⓘ Screening estimate from a state-policy table — verify with the county assessor before closing.
Climate risk First Street
- Flood 1/10 Low FEMA zone X (unshaded) · 0% chance over 30 yrs
- Wildfire 2/10 Low
- Heat 2/10 Low 7 d/yr ≥99°F today · 16 d/yr by 30 yrs out
- Wind 2/10 Low
- Air quality 3/10 Moderate 2 unhealthy d/yr today · 4 by 30 yrs out
Nearby sold comps map
Loading sold comps map…
Walkable amenities ~0.75 mi
Loading nearby amenities…
Taxation est. · year 1
- Rental income
- $28,878
- − Mortgage interest
- −$11,203
- − Property taxes
- −$2,658
- − Insurance
- −$1,000
- − Repairs & maintenance
- −$2,310
- − Management
- −$2,310
- − Depreciation
- −$5,818
- Taxable income
- $3,579
- Est. tax owed @ 24.0%
- −$859
- After-tax cash flow
- $5,711/yr
For passive investors: Depreciation is non-cash, so a rental often shows a tax loss while cash-flowing — sheltering income. Rental losses are passive: they offset passive income freely, and up to $25,000/yr can offset ordinary (W-2) income if you actively participate and your MAGI is under $100k (phasing out to $0 by $150k); unused losses carry forward. On sale, claimed depreciation is recaptured at up to 25%, and gains may owe capital-gains tax (a 1031 exchange can defer both). Figures are a year-1 estimate at your 24.0% rate — not tax advice; consult a CPA.
Schools (NCES district)
- District
- Lawton Community School District
- NCES district ID
- 2621240
- Math proficiency
- 27% ▼ -9.00%
- Reading proficiency
- 45% ▼ -3.00%
- Median HH income
- $49,315
- Composite
- 31.04/100
- National rank
- #6084
- State rank
- #263 of 540 in MI
Livability — Antwerp
No livability data for this city. (Only ~50 U.S. cities are tracked.)
Census & demographics
- Census place
- Lawton, MI
- Population (ZIP)
- 7,283
Population outlook (Van Buren County) Hauer SSP2
- Today (2025)
- 71,479 people
- By 2030
- 68,693 · -3.9%
- By 2040
- 62,093 · -13.1%
- By 2050
- 55,232 · -22.7%
- By 2075
- 40,786 · -42.9%
- By 2100
- 27,785 · -61.1%
Race, ethnicity, and origin ACS 2023
- Neighborhood character
- Predominantly White (90%)
- Race & ethnicity
- White 90% Two or more races 6% Hispanic / Latino 4%
- Common ancestry
- Romanian 8% Iranian 6% Lithuanian 2%
- Foreign-born
- 1% · Canada, South Korea
- Languages at home
- 98% English-only · Spanish 2%
Political lean MEDSL · Van Buren
- 2024 margin
- R (+15.1) · D 41.7% · R 56.9% · Other 1.4%
- 2008→2024 swing
- -23.9pp toward R · 2008: 8.8pp · 2024: -15.1pp
- All cycles
- 2024: R+15.1 2020: R+12.3 2016: R+13.9 2012: D+0.5 2008: D+8.8
Not yet ingested
- Civics
- —
Market trends
- HPI YoY
- ▼ -162.97%
- Current HPI
- 165.0761
- Rent YoY
- —
- Metro
- —
- State GDP YoY
- ▲ 1.37%
- F500 in state
- 28
Industry mix (Fortune 500 HQ in MI)
| Industry | F500 HQs | Revenue |
|---|---|---|
| Automotive Parts | 3 | $48B |
|
||
| Automotive | 2 | $372B |
|
||
| Chemicals | 1 | $45B |
|
||
| Automotive Retail | 1 | $29B |
|
||
| Healthcare / Medical Devices | 1 | $23B |
|
||
| Automotive Technology | 1 | $20B |
|
||
Price history
+100.2% since first listed38 events — show timeline
- 2026-06-18 Listed $200,000 FSBO.com
- 2025-11-16 Listing Removed — MiRealSource-MiMLS
- 2025-11-15 Listing Removed — REALCOMP
- 2025-10-10 Price Changed $208,000 MiRealSource-MiMLS
- 2025-10-10 Price Changed $208,000 REALCOMP
- 2025-08-08 Relisted — REALCOMP
- 2025-08-07 Listing Removed — REALCOMP
- 2025-07-22 Price Changed $212,000 MiRealSource-MiMLS
- 2025-07-21 Price Changed $212,000 REALCOMP
- 2025-07-08 Price Changed $216,900 MiRealSource-MiMLS
- 2025-07-07 Price Changed $216,900 REALCOMP
- 2025-06-26 Price Changed $224,900 MiRealSource-MiMLS
- 2025-06-26 Price Changed $224,900 REALCOMP
- 2025-05-29 Listed $235,000 REALCOMP
- 2025-05-29 Listed $235,000 MiRealSource-MiMLS
- 2022-05-25 Listing Removed — REALCOMP
- 2020-04-06 Sold (Public Records) $129,500 Public Records
- 2020-03-25 Sold (MLS) $129,500 SW Michigan MLS
- 2020-03-25 Sold (MLS) $129,500 REALCOMP
- 2020-02-06 Pending — SW Michigan MLS
- 2019-11-28 Price Changed $139,900 SW Michigan MLS
- 2019-10-10 Price Changed $144,500 SW Michigan MLS
- 2019-09-03 Price Changed $149,900 SW Michigan MLS
- 2019-08-10 Listing Removed — SW Michigan MLS
- 2019-08-10 Listing Removed — MiRealSource-MiMLS
- 2019-08-10 Listing Removed — REALCOMP
- 2019-08-08 Listed $139,900 MiRealSource-MiMLS
- 2019-08-08 Listed $152,900 SW Michigan MLS
- 2019-08-08 Listed $139,900 REALCOMP
- 2019-07-01 Listed $152,900 SW Michigan MLS
- 2019-07-01 Listed $152,900 MiRealSource-MiMLS
- 2019-07-01 Listed $152,900 REALCOMP
- 2006-12-27 Sold (Public Records) $85,000 Public Records
- 2006-12-22 Sold (MLS) $85,000 SW Michigan MLS
- 2006-11-28 Listing Removed — SW Michigan MLS
- 2006-06-07 Listed $99,900 SW Michigan MLS
- 2006-06-07 Listed $99,900 REALCOMP
- 2006-06-07 Listed $99,900 SW Michigan MLS
Property tax history
+4.0%/yrLatest (2025): $2,658 · +4.9% YoY. Source: county tax records.
Cash-flow waterfall
monthlySold comps — $/sqft
last 12 mo · ≤1 miLoading sold comps…